Observation of spontaneous ordering in the optoelectronic material GaInNP
Y. K. Su,a)C. H. Wu, S. H. Hsu, S. J. Chang, and W. C. Chen
Institute of Microelectronics, Department of Electrical Engineering, National Cheng Kung University, Tainan 701, Taiwan, Republic of China
Y. S. Huang and H. P. Hsu
Department of Electronic Engineering, National Taiwan University of Science and Technology, Taipei 106, Taiwan, Republic of China
共Received 30 October 2003; accepted 19 December 2003兲
We report a detailed structural and optical characterization of high-quality GaInNP films. These films were grown by gas-source molecular-beam epitaxy on GaAs共100兲 substrates. These epitaxial layers were then characterized by a high-resolution x-ray rocking curve 共HRXRC兲 and photoluminescence 共PL兲 measurements. With nitrogen incorporation, the PL peak redshifts, indicating bandgap reduction and the line-width broadening increases due to alloy scattering. The anisotropic properties of the polarized HRXRC and polarized piezoreflectance spectra are used to prove the spontaneous ordering in GaInP incorporating nitrogen. Furthermore, ordering-induced superlattice-like microstructure shown in high-resolution transmission electron microscope images is used to confirm the spontaneous ordering in Ga0.44In0.56NxP1⫺x epitaxial layers. © 2004 American Institute of Physics. 关DOI: 10.1063/1.1650045兴
Recently, Ga0.52In0.48P grown lattice-matched to GaAs
has received considerable attention due to its potential appli-cations in optoelectronic and electronic devices, such as semiconductor lasers,1 heterojunction bipolar transistors 共HBTs兲,2
and high-efficiency tandem solar cells.3 Ga0.52In0.48P/GaAs structures have significant advantages
over AlGaAs/GaAs structures in larger valence-band discon-tinuity, better etch selectivity, and smaller oxidation effect.
Nitrogen incorporation drastically reduces the bandgap energy in GaxIn1⫺xAs, with the majority of the reduction
resulting from lowering of the conduction band.4A similar effect in GaxIn1⫺xP incorporation nitrogen has been reported
in Ref. 5. Thus, GayIn1⫺yNxP1⫺x may be a suitable material
for the emitter and collector of HBTs, especially blocked hole bipolar transistors共BHBTs兲.6
Spontaneous ordering in GaxIn1⫺xP has been widely
in-vestigated in recent years.7,8Depending on its growth condi-tions, GaxIn1⫺xP could be grown on GaAs substrate orderly or disorderly,9 which results in the discrepancy of bandgap energy. The ordering phenomenon in such compounds is a very important property, which will make changes in the electronic and optical properties. Up to now, there has been no article about spontaneous ordering in GayIn1⫺yNxP1⫺x.
In this study, we prepared Ga0.46In0.54NxP1⫺x (x from 0 to
0.02兲 epitaxial layers. PL and high-resolution x-ray rocking curve 共HRXRC兲 analysis are used to characterize these samples. The observation of the ordering phenomenon in GayIn1⫺yNxP1⫺x epitaxial layers by using the anisotropy of
the polarized HRXRC measurement, polarized piezoreflec-tance 共PzR兲 spectra, and high-resolution transmission elec-tron microscope共HRTEM兲 is reported.
All the samples used in this study were grown on GaAs 共100兲 semi-insulating substrates by gas-source molecular-beam epitaxy using elemental Ga and In, thermally cracked
arsine 共AH3兲, phosphine 共PH3兲, and a rf plasma nitrogen radical beam source. After removing the surface oxide of the GaAs substrate at 620 °C under an As2 flux, a 1000-Å-thick buffer GaAs layer was grown. The substrate temperature was then, lowered to the growth temperature, between 380 and 480 °C, and a nitrogen plasma was ignited. Growth was monitored by reflection high-energy electron diffraction. Un-doped 2350-Å-thick Ga0.44In0.56NxP1⫺x layers were grown for this study. The compositions of In and N were deter-mined by HRXRC and theoretical dynamic simulations.10 HRXRC measurement was performed using a Bede x-ray diffractometer. Photoluminescence 共PL兲 measurement was carried out at room temperature by using the 514.5 nm line of an Ar⫹laser as the excitation source. A GaAs photomul-tiplier tube was used to detect the signal at the exit of a 50 cm monochromator. A conventional lock-in amplifier was used for synchronous measurement. For the verification of spontaneous ordering in Ga0.44In0.56NxP1⫺x layers, a polar-ized HRXRC and PzR measurement toward关110兴 and 关1-10兴 polarizations was performed. The PzR measurements were achieved by gluing the thin sample on a 0.15-cm-thick lead zirconate titanate piezoelectric transducer driven by a 300 V rms sinusoidal wave at 200 Hz. In order to enhance the modulation effects, the substrate of the sample was polished with successively finer grades of silicon carbide grinding pa-per to a thickness of about 100m. The alternating expan-sion and contraction of the transducer subjected the sample to an alternating strain with a typical rms ⌬l/l value of ⬃10–5. A 150 W tungsten-halogen lamp filtered by a PTI 0.25 m monochromator provided the monochromatic light. The reflected light was detected by an EG&G-type HUV-2000 B silicon photodiode, and the signal was recorded from a Perkin Elmer 7265 DSP lock-in amplifier. The Oriel visible-near-infrared dichroic linear polarizers were em-ployed for polarization-dependent measurements.
Figure 1 shows the HRXRC of Ga0.46In0.54NxP1⫺x
epi-a兲Electronic mail: yksu@mail.ncku.edu.tw
APPLIED PHYSICS LETTERS VOLUME 84, NUMBER 8 23 FEBRUARY 2004
1299
0003-6951/2004/84(8)/1299/3/$22.00 © 2004 American Institute of Physics
taxial layers with x⫽0, 1%, and 2%. The HRXRC of Ga0.46In0.54P epitaxial layer shows a 0.42% mismatch. With
nitrogen incorporation, the peak of XRC moves toward the peak of the GaAs substrate, indicating that the mismatch between the epitaxial layer and GaAs substrate decreases. However, the epitaxial quality becomes poor for samples with nitrogen incorporation. For the samples with nitrogen content equal to 2%, the splitting peak of XRC reveals the poor epitaxial quality. Figure 2 shows the RT PL spectra of Ga0.46In0.54NxP1⫺xepitaxial layers with x⫽0, 0.5%, and 1%.
The PL peaks are located at wavelengths 679.2, 695.2, and 711.5 nm for nitrogen content equal to 0%, 0.5%, and 1%, respectively. With nitrogen incorporation, the linewidth in-creases due to the alloy scattering, and the redshift of the PL peak indicates bandgap reduction. As shown in Fig. 2, the peak intensity decreases as nitrogen incorporation increases. There are no PL spectra measured for the samples with 2% nitrogen incorporation. Except for the sample without nitro-gen incorporation, there exists a long tail at the higher wave-length observed in the PL spectra. This is supposed to be the nitrogen-induced trap level, including nitrogen isolated
cen-ters, nitrogen pairs, and clusters in the samples with nitrogen incorporation. The illustration inset at the upper right corner of the Fig. 2 shows the PL spectra in logarithm scale. The peak observed at 876.2 nm is contributed by GaAs.
Figure 3 shows the HRXRC of the sample with nitrogen content x⫽1% for 关110兴 and 关1-10兴 polarizations. One more peak adjacent to Ga0.46In0.54N0.01P0.99peak is observed in the HRXRC for the 关1-10兴 polarization, which vanishes for the 关110兴 polarization. The anisotropic properties for the differ-ent polarizations are supposed to result from the spontaneous ordering in the Ga0.46In0.54N0.01P0.99epitaxial layer. Figure 4
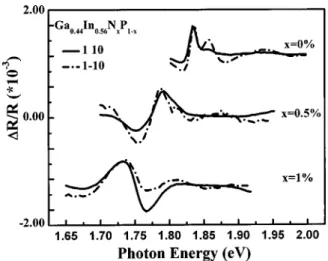
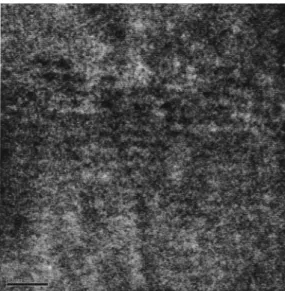
shows the RT PzR spectra of the samples with nitrogen con-tent x⫽0, 0.5%, and 1% for E储关110兴 and E储关1-10兴 polar-izations. The features near band edge are strongly polariza-tion dependent, indicating the existence of some degree of ordering for these samples. The results are confirmed by HR-TEM study of the samples taken from the same wafers. Fig-ure 5 shows the typical关110兴 zone-axis HRTEM image taken from the sample with nitrogen content x⫽0.5%. The ordering-induced supperlattice-like microstructure is obvi-ously seen in this image. It also shows some degree ordering and localized clustering in the sample.
HRXRC and PL measurements are used to characterize the dilute nitrogen incorporation GaInP system. PL spectra show a long tail at higher wavelength, which is supposed to FIG. 1. HRXRC of Ga0.46In0.54NxP1⫺xepitaxial layers with x⫽0, 1%, and
2%.
FIG. 2. RT PL of Ga0.46In0.54NxP1⫺x epitaxial layers with x⫽0, 0.5%, and
1%. The upper right inset illustration shows the RT PL spectra in logarithm scale.
FIG. 3. HRXRC of Ga0.46In0.54N0.01P0.99epitaxial layer for关110兴 and 关1-10兴
polarizations.
FIG. 4. PzR spectra of Ga0.46In0.54NxP1⫺xepitaxial layers with x⫽0, 0.5%,
and 1% for E储关110兴 and E储关1-10兴 polarizations at RT.
1300 Appl. Phys. Lett., Vol. 84, No. 8, 23 February 2004 Suet al.
be a nitrogen-induced trap level. The anisotropic properties of the polarized PzR features near band edge indicate the existence of some degree of ordering for the Ga0.46In0.54NxP1⫺x epitaxial layers. The spontaneous
order-ing is confirmed by the HRTEM image, which shows ordering-induced superlattice-like patterns.
The authors would like to thank C. W. Tu from Depart-ment of ECE, University of California, San Diego for pro-viding epitaxial wafers. This work was supported by the Ministry of Education Program for Promoting Academic Ex-cellence of Universities, Taiwan, R.O.C. under the Grant A-91-E-FA08-1-4.
1Z. L. Liau, S. C. Palmateer, S. H. Groves, J. N. Walpole, and L. J.
Mis-saggia, Appl. Phys. Lett. 60, 6共1992兲.
2D. A. Ahmari, G. Raghavan, Q. J. Hartmann, M. L. Hattendorf, M. Peng,
and G. E. Stillman, IEEE Trans. Electron Devices 46, 634共1996兲.
3K. A. Bertness, S. R. Kurtz, D. J. Friedman, A. E. Kibbler, and J. M.
Olson, Appl. Phys. Lett. 65, 989共1994兲.
4W. Shan, W. Walukiewicz, J. W. Ager III, E. E. Haller, J. F. Geisz, D. J.
Friedman, J. M. Olson, and S. R. Kurtz, Phys. Rev. Lett. 82, 1221共1999兲.
5Y. G. Hong, R. Andre, and C. W. Tu, J. Vac. Sci. Technol. B 19, 1413
共2001兲.
6R. J. Welty, Y. G. Hong, H. P. Xin, K. Mochizuki, C. W. Tu, and P. M.
Asbeck, Proceedings, 2000 IEEE/Cornell Conference on High
Perfor-mance Devices, Piscataway, NJ, pp. 33– 40.
7G. Hatakoshi, K. Itaya, M. Ishikawa, M. Okajima, and Y. Uematsu, IEEE
J. Quantum Electron. 27, 1476共1991兲.
8H. Sugawara, M. Ishikawa, and G. Hatakoshi, Appl. Phys. Lett. 58, 1010
共1991兲.
9H. Kressel, C. I. Nuese, and I. Ladany, J. Appl. Phys. 44, 3266共1973兲. 10
Y. G. Hong, F. S. Juang, M. H. Kim, and C. W. Tu, J. Cryst. Growth 251, 437共2003兲.
FIG. 5. The typical关110兴 zone-axis HRTEM image shows some degree
ordering and localized clusters in a nitrogen-incorporated 共关N兴⫽0.5%兲 sample.
1301
Appl. Phys. Lett., Vol. 84, No. 8, 23 February 2004 Suet al.