用戶端水與能源使用量之關係
93
0
0
全文
(2)
(3) 摘要 水和能源是緊密相關,然而傳統上這二種資源分開管理。能源使用在供水、水的 終端使用,及水的回收再利用,研究顯示水的終端使用消耗最多的能源。 本研究的目的為檢視在用戶端水與能源使用量的關係。首先探討在水生命週期階 段能源的消耗,以助瞭解供水、水的終端使用、廢水處理,及水回收利用等各階段耗 能因素。最後分析公寓,學校及工廠案例,以具體說明水及能源在用戶端使用的關聯 性。 研究結果顯示水與能源相關性以工廠最高,其次為學校及公寓,工廠的水資源使 用與能源的消耗為正相關。再者,三種水的用戶端的能源消耗量有不同的造成因素, 在工廠,使用水的距離、水處理的程度、以及抽水效率為能源消耗最主要的因素;然 而對於公寓及學校,設備的年齡、熱水器及幫浦系統的效率為影響能源消耗的因素。 在用戶的水管理上,應根據能源消耗因素來考量水資源的分配。 關鍵字:水與能源關係、水的終端使用、能源消耗、生命週期分析. i.
(4) Abstract Energy and water are closely related to each other, yet management of the two resources has historically been independent. Energy is consumed in water supply, end use and water recycling. Previous studies found that end use consumed largest energy in the water-energy life cycle. The purpose of this study is to examine the relationship between water and energy consumption at the end-use stage. It first reviewed energy consumption at each stage in the water life cycle that helps to determine factors which increase energy consumption at water supply, end use, wastewater and water recycling. Three cases of an apartment, school and manufacturing plant were employed to analyze the correlation between water and energy consumption at end-use. The analysis results reveal that water consumption’s correlation to energy consumption increases from apartment, school to manufacturing plant. Water usage is positively related to energy consumption in the manufacturing plant. Furthermore, various end users have different factors affecting energy consumption. Factors that affect energy consumption in a manufacturing plant include distance of end users, level of treatment and pump efficiency. Meanwhile, appliance age, efficiency of water heater and pump system are factors that affect energy consumption in the apartment and school. Management can plan on water distribution based on the factors affecting energy consumption at the end use. Keywords: Water-energy nexus, water end use, energy consumption, life cycle analysis. ii.
(5) Acknowledgement First at all, I would like to express my deep gratitude to my Prof. Andrew S. Chang, who has kindly accepted me as his student. Without his full support, advices, patience and kindness, the study would not have completed well. The writing of this thesis has been a tiring yet an eye-opening journey that has taken me across civil engineering field and sustainability issues. This thesis made possible due to his guidance. I wish to thank my parents for their undivided support and interest who inspired me and encouraged me to go my own way, without whom I would be unable to complete my thesis. I also would like to thank my sister and brother. They always support me all the ways, they are my real supporters. I would like to thanks office of international affairs, staff of civil engineering department office and also NCKU for providing academic services and giving me the chance to study in a university with high reputation. At last but not the least I want to thank my friends and colleagues who appreciated me for my work, support, motivated me and also help during this journey. Thank to all of you for these unforgettable and beautiful moments and experiences, I will never forget you.. iii.
(6) Table of Contents 摘要 ........................................................................................................................................ i Abstract ................................................................................................................................ ii Acknowledgement .............................................................................................................. iii Table of contents ................................................................................................................. iv List of tables ....................................................................................................................... vii List of Figures ..................................................................................................................... ix Chapter 1. Introduction ................................................................................................. 1. 1.1 Research Motivation ............................................................................................. 2 1.2 Research Objectives .............................................................................................. 3 1.3 Research Method and Process ............................................................................... 3 1.4 Research Scope and Limitation ............................................................................. 4 Chapter 2. Literature Review ........................................................................................ 6. 2.1 Water Usage and Water-Energy Relationship ....................................................... 6 2.1.1. Water usage .......................................................................................................... 6. 2.1.2. Water-Energy Relationship .................................................................................. 7. 2.2 Water-Energy Life Cycle ....................................................................................... 8 2.2.1. Energy consumption for water extraction .......................................................... 10. 2.2.2. Energy consumption for water treatment and distribution ................................. 11. 2.3 Energy Consumption at Water End Use .............................................................. 14 2.3.1. Water energy use in residential sector ................................................................ 14. 2.3.2. Water energy use in industrial sector ................................................................. 16. 2.4 Energy Consumption for Wastewater Treatment ................................................ 17 2.4.1. Wastewater treatment and energy consumption ................................................. 17. iv.
(7) 2.4.2 Chapter 3. Energy consumption of wastewater reuse.......................................................... 18 Energy Consumption for Water Supply and Wastewater by the Governments ... 19. 3.1 Energy Consumption for Water Supply ............................................................... 19 3.1.1. Energy consumption for extraction and conveyance ......................................... 20. 3.1.2. Energy consumption for treatment and distribution .......................................... 21. 3.2 Energy Consumption for Wastewater .................................................................. 24 3.3 Factors Affecting Energy ..................................................................................... 27 3.3.1. Factors affecting energy consumption ............................................................... 27. 3.3.2. Energy reduction ................................................................................................ 29. Chapter 4. Energy Consumption at End Use and Recycling Water ........................ 31. 4.1 Energy Consumption at End Use......................................................................... 31 4.1.1. Energy demand for residential water use ........................................................... 31. 4.1.2. Energy consumption of industrial water use ...................................................... 33. 4.2 Energy Used for Recycling Water ....................................................................... 34 4.2.1. Reuse of wastewater .......................................................................................... 35. 4.2.2. Energy consumption of recycle water treatment and distribution ..................... 36. 4.2.3. Factors of Energy Consumption and Reduction ................................................ 37. Chapter 5. Case studies ................................................................................................ 40. 5.1 Apartment and Water Energy Consumption Relationship ................................... 40 5.2 School .................................................................................................................. 42 5.2.1. Water used at school .......................................................................................... 42. 5.2.2. Relationship between water and energy consumption in school ....................... 44. 5.3 Manufacturing Plant ............................................................................................ 51 5.3.1. Water use of manufacturing plant ...................................................................... 51. 5.3.2. Relationship between water and energy consumed in manufacturing plant ...... 52 v.
(8) 5.4 Factors Affecting Energy Consumption in Each Case ........................................ 56 Chapter 6. Conclusions and Recommendations ........................................................ 60. 6.1 Conclusions ......................................................................................................... 60 6.2 Recommendations ............................................................................................... 62 References .......................................................................................................................... 63 Appendix A......................................................................................................................... 67 Appendix B......................................................................................................................... 70. vi.
(9) List of Tables Table 2.1 Water withdrawals in different sectors worldwide ................................................ 7 Table 2.2 Water treatment energy consumption ranges in several countries ....................... 13 Table 2.3 Energy consumption in residential water use ...................................................... 16 Table 2.4 Energy consumption of secondary wastewater treatments .................................. 18 Table 3.1 Impact factors for energy consumption ............................................................... 19 Table 3.2 Water source of total water extraction ................................................................. 20 Table 3.3 Energy for surface water and groundwater pumping........................................... 21 Table 3.4 Energy use for different water treatments ............................................................ 22 Table 3.5 Energy usage for desalination .............................................................................. 23 Table 3.6 Electricity use for different treatment technologies ............................................. 26 Table 3.7 Factor affecting energy consumption .................................................................. 28 Table 4.1 Wastewater reuse market by end users ................................................................ 35 Table 4.2 Factors affecting energy consumption at end use and recycling water ............... 38 Table 5.1 Water and power consumption of an apartment .................................................. 41 Table 5.2 School case data ................................................................................................... 43 Table 5.3 Water and energy consumption of department A ................................................. 46 Table 5.4 Rainfall average per month in Tainan (mm) ........................................................ 46 Table 5.5 Water and energy consumption of department B ................................................. 47 Table 5.6 Water and energy consumption of department C ................................................. 49 Table 5.7 Rs between water and energy of the school ......................................................... 50 Table 5.8 Areas, number of students and water/energy consumptions ................................ 50 Table 5.9 UPW quantity and power consumption of the plant ............................................ 53 Table 5.10 Wastewater quantity and power consumption of the plant ................................ 54. vii.
(10) Table 5.11 Reclaim quantity and power consumption of the plant ..................................... 55 Table 5.12 Relationship between water treated and power consumed ................................ 56 Table 5.13 Factors affecting energy consumption in each case .......................................... 57. viii.
(11) List of Figures Figure 1.1 Water flow at end use ........................................................................................... 2 Figure 1.2 Research process .................................................................................................. 4 Figure 2.1 Relationship of water-energy nexus ..................................................................... 8 Figure 2.2 Water flow of water life cycle .............................................................................. 9 Figure 2.3 Typical water treatment plant operations for surface water source .................... 12 Figure 2.4 Typical water treatment plant operations for surface water source .................... 15 Figure 2.5 Typical water treatment plant operations for surface water source .................... 16 Figure 3.1 Electricity consumed at activated sludge systems ............................................. 26 Figure 4.1 Energy consumption by different sectors (MOEA 2012) ................................... 33 Figure 4.2 Flow chart of UPW treatment system ................................................................ 34 Figure 5.1 Areas of the school ............................................................................................. 43 Figure 5.2 Flow chart of water use in a school .................................................................... 44 Figure 5.3 Flow chart of water use in a plant ...................................................................... 52 Figure 5.4 Relationships between water and energy consumption in different cases ......... 58. ix.
(12)
(13) Chapter 1. Introduction. Water is essential for human daily needs and most activities of the human society. Nevertheless, water resources are becoming increasingly scarce in many parts of the world due to population growth, climates and lifestyle changes, intergovernmental relations and economic demands (Lee 2012). Energy is fundamental to the quality of our lives and sustainability of daily activities. Nowadays, developing countries are facing energy crisis as the reserves of gas and oil are diminishing (WEC 2013). In fact, water and energy are coupled in intimate ways. Water is required for fuel cycle, transportation and electricity transmission stage, etc. The processes involving water such as water extraction, treatment, distribution, and disposal in turn consume energy (Siddiqi 2011). Despite the interconnections, historically water and energy have been regulated and managed independently of one another. Planning for energy supply traditionally gave inadequate consideration to water supply issues. Consecutively, planning for water supply often neglected to fully consider about energy requirements (Stillwell 2010). Yet, growing demand of water and energy resources has received increasing attention in recent years. A research in California has shown that 19% of the electricity in the state is consumed for water-related services (Klein 2005). As stated by Klein (2005), significant amount of energy is consumed to treat and distribute water before supplying to residential, agricultural, domestic consumption and sanitation use. Energy consumption is mainly involved in the process of water pumping, conveyance and purification (Lienhard 2012).. 1.
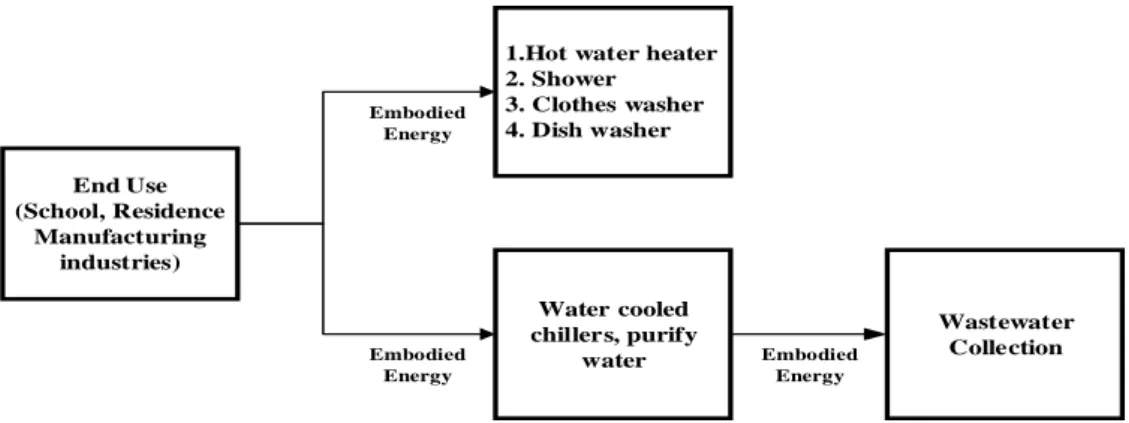
(14) 1.1 Research Motivation Treated raw water is distributed to end users such as residential, commercial, industrial sectors. The highest amount of energy is consumed at the end-use process among all the water life cycle processes (Rothausen, 2011). According to Reffold (2008), end use demand has contributed 89% of CO2 from the water system. Water is necessary for water heating, washing clothes and dishes, showering in the end use stage which consumes substantial amount of energy. However, Janda (2011) revealed that part of end use high energy intensity comes from human behavior that has a very substantial role in setting water related energy consumption. The embodied energy in the water end use stage should be studied to have a better understanding of energy consumption. Figure 1.1 shows the water flow at end use such as schools, residence and manufacturing plants. Basically water in residence is used for hot water heater, shower, clothes washer and dish washer. As for manufacturing plants, embodied energy is found in water cooled chiller and water purification. There is a lack of consciousness on water and energy consumption at the end use stage. Hence, it is crucial to analyze relationship between water and energy consumption at end use and raise public awareness of the effects of water use on national energy consumption.. Embodied Energy. 1.Hot water heater 2. Shower 3. Clothes washer 4. Dish washer. End Use (School, Residence Manufacturing industries). Embodied Energy. Water cooled chillers, purify water. Embodied Energy. Figure 1.1 Water flow at end use. 2. Wastewater Collection.
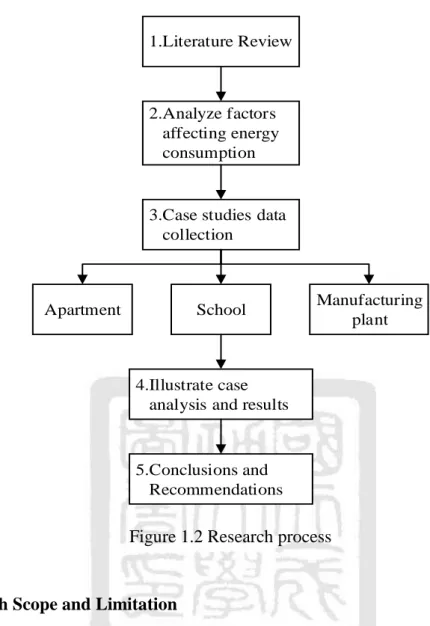
(15) 1.2 Research Objectives The objectives of this research are: (1) to analyze the relationships between water and energy consumption at end use (apartment, school and manufacturing plant), and (2) identify the factors affecting energy consumption at end use. The outcomes of the research serve as important information to implement effective water management strategies for organizations.. 1.3 Research Method and Process This study reviews the background of water-energy life cycle and investigates the relationships between water and energy consumption at water end use. Previous studies are reviewed to identify factors affecting energy consumption at 1) water supply and wastewater by government, 2) end use and recycling water. Three case of a apartment, school and manufacturing plant are solicited to provide data for verification analysis. The research process with six steps is presented in Figure 1.2. Step 1: Review literature that covers water usage and water-energy relationship, water-energy life cycle, energy consumption at water end use and energy consumption for wastewater treatment. Step 2: Analyze factors affecting energy consumption at water supply, wastewater, end use and recycling water. Step 3: Obtain data of the total amount of water and energy used from the bimonthly water and energy utility bills of the apartment, school and manufacturing plant. Step 4: Analyze the relationships between water and energy consumption of the three cases. Factors that affect energy consumption can be applied in the studied cases. Step 5: Present the conclusions and recommendations.. 3.
(16) 1.Literature Review. 2.Analyze factors affecting energy consumption. 3.Case studies data collection. Apartment. School. Manufacturing plant. 4.Illustrate case analysis and results. 5.Conclusions and Recommendations. Figure 1.2 Research process. 1.4 Research Scope and Limitation This research is conducted to analyze the relationships between water and energy consumed at end use. The research scope covered the water and energy used at an apartment, school and manufacturing plant. There are some limitations in this research: (1) Water and energy usage involves a wide range of stakeholders and therefore data are not often readily available. (2) Not many previous studies analyzed factors affecting energy consumed at end use. More studies mentioned the factors affecting energy consumption at water supply instead of at end use, although this mentioning is not their research focus. Hence, the factors referred from water supply and end use in this study might not be 4.
(17) complete. (3) The data used for the three case studies were modified not to reveal the case’s operation facts, especially for the manufacturing plant.. 5.
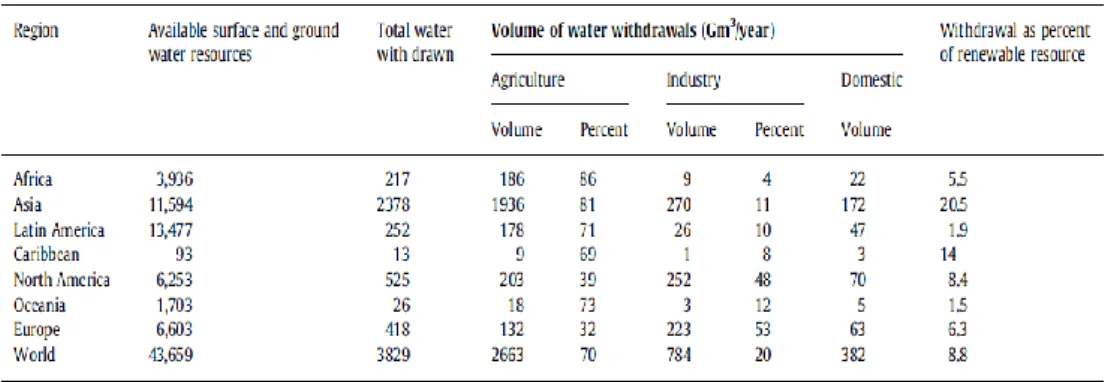
(18) Chapter 2. Literature Review. A literature review was carried out on water-energy relationship. Relevant studies are presented in the following section: 2.1) water usage and water-energy relationship, 2.2) water-energy life cycle, 2.3) energy consumption at water end use, and 2.4) energy consumption for wastewater treatment.. 2.1 Water Usage and Water-Energy Relationship Water is the most and essential human need. Global water withdrawals have increased rapidly over the past decades, and are expected continue grow in the near future (Mo 2011). As we know that available water is depleted, alternatives that may have larger energy and resource requirements. Besides that, the relationship between water and energy has received increasing attention in recent years in light of growing water and energy resource demand (Sanders 2012). The following section 2.1.1 introduces about water usage and 2.1.2 water-energy relationship.. 2.1.1 Water usage Water covers 71% of the earth's surface and is dynamic for all known forms of life. Water directly or indirectly affects all aspects of our life. In many regions of the world, freshwater is regarded as a scarce resource (Hussey 2012). Basically, water are withdrawn for agriculture, industry and domestic sectors. In recent years, water use of each sector has been increasing. Table 2.1 shows the water withdrawals in different sectors (Lienhard 2012).. 6.
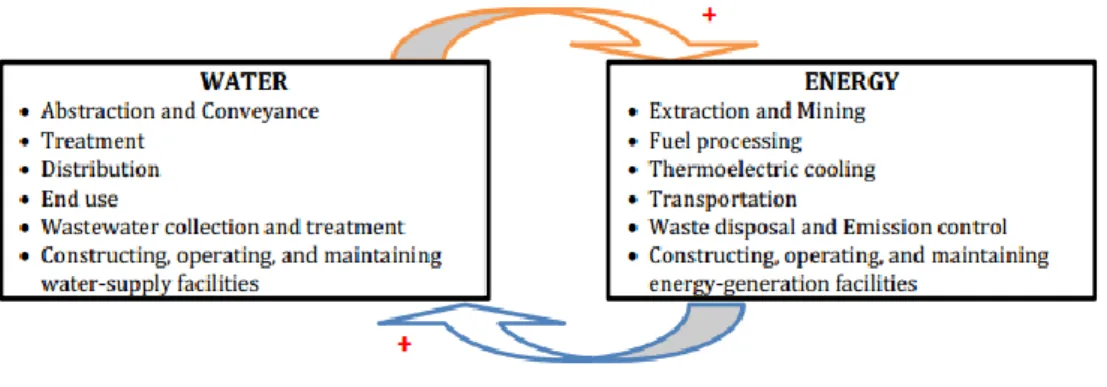
(19) Table 2.1 Water withdrawals in different sectors worldwide. From: Lienhard (2012) We can see that Latin America, Asia’s and Europe countries extract water from surface and ground water. Asia’s water consumption largely takes place in agriculture with 1,936 Gm3/year. North America and Europe withdraw more water for the industrial sector and with 252 and 223 Gm3/year, respectively.. 2.1.2 Water-Energy Relationship The two fundamental resources that support most aspects of human well-being are water and energy. It has been increasingly recognized that energy and water sustainability are intimately intertwined (Schnoor 2011). At a basic level, electricity generation requires water while water treatment and transportation uses electricity. Generally, there has been little evidence to prove the nature of these links, largely due to the presumption that water has never been not a threat to energy security, and vice versa (Marsh 2008). This presumption is now being challenged because increasing demand, and more recently climate change will directly affect both of the resource. Normally water is required for the production of energy, and energy is required in the treatment and transport of water. Meanwhile, water supply and sewage disposal also need energy – a linked relationship known as the water-energy nexus (Pittock 2012). Figure 2.1 7.
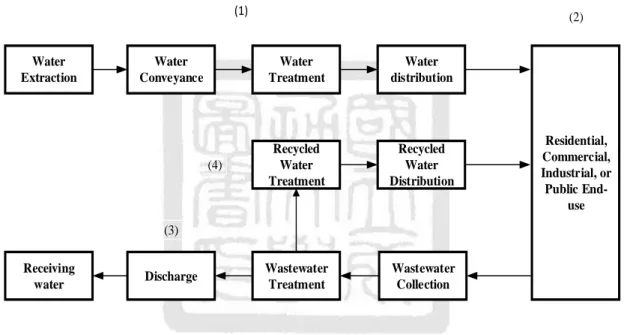
(20) shows the relationship of water and energy nexus.. From: DHI (2008) Figure 2.1 Relationship of water-energy nexus Before providing it to the consumers, water requires a significant amount of energy. Figure 2.1 shows that the source water is extracted and conveyed after being pumped from groundwater, surface water. After that, transfer the water from source treatment plants which are filtration, oxidation, and conventional treatment. Treated water is distributed to end use. Besides that, water-supply facilities such as construction, operation, and maintenance require a significant amount of energy (Sanders 2012). In addition, water is essential for components in power production and they are divided into several categories: thermoelectric cooling, hydropower, energy fuel cycle (mining, extraction, refining), fuel production and emission controls. Energy is distinguished as delivered energy and transport energy (Sovacool 2009). Delivered energy is the energy consumed by the end user. Every step of energy cycle involves water inputs and water discharges, and both often involves different sources and different water bodies, respectively (Global water forum 2011).. 2.2 Water-Energy Life Cycle Nowadays readily-available water sources are depleting, future supply options will likely have higher energy requirements (ASE 2002). Wilkinson (2000) outlined the major 8.
(21) energy consuming components in the water life cycle. The flow chart presented in Figure 2.2 illustrates the four stages of water life cycle. 1) Primary water extraction, conveyance, treatment and distribution (imported and local), 2) Residential, commercial, industrial or public end-use, 3) Wastewater collection, treatment, discharge to receiving water, and 4) Recycled water treatment and distribution. (1). Water Extraction. Water Conveyance. (4). (2) Water Treatment. Water distribution. Recycled Water Treatment. Recycled Water Distribution. Wastewater Treatment. Wastewater Collection. Residential, Commercial, Industrial, or Public Enduse. (3). Receiving water. Discharge. Figure 2.2 Water flow of water life cycle There are processes in each stage in Figure 2.2 that consume energy from thermal sources under differing conditions of temperature and primary energy supply. This is particularly true for natural gas heating of water and of some steam-driven desalination processes (Lienhard 2012). The energy consumed by each process is expressed in terms of kWh indicating the electricity per cubic meter of water applied or served. Urban water system has significant impact to the environment from energy consumption associated with GHG emissions (Lee 2012). It shows that 2–3% of energy consumption is used to pump and treat urban water worldwide. The following section 9.
(22) reviews the studies investigating which stage of water cycle consumes more energy.. 2.2.1 Energy consumption for water extraction A strong connection exists between water provision and energy consumption. From Figure 2.2, we can see that a typical water life cycle starts with extraction, and the natural resources such as groundwater, rivers, surface water, and oceans are extracted (Lienhard 2012). Water resources extracted from different natural resources will consume different amounts of energy. Groundwater Collection and conveyance of groundwater typically uses more electricity than surface water sources in the same location due to the energy requirements of pumping water from underground aquifers (Reardon 2010). Energy required for pumping varies with water depth. Pumping from a depth of 36.6m requires 0.14kWh/m3 while pumping from 122m requires 0.53kWh/m3 (Harbeck 2002). Besides that, energy consumed also depends on the location of the water source in relative to the location of discharge and the frictional resistance of flow (Ahfeld 2011). The pump efficiency, pipeline, pipe material roughness, and volumetric demand for water also affect the amount of energy consumed. Surface water Energy consumed on surface water depends on the tunnels, aqueducts and pipelines of the water supply systems. Majority energy consumption of these systems varies considerably in response to the length of system and the elevation changes (Lienhard 2012). The energy requirements for conveying source water to the treatment plant vary with geography. Long-haul and uphill water pipelines require more energy for pumping, while. 10.
(23) partially gravity-fed systems require less. Brackish groundwater and seawater are becoming more common sources of raw water in the world where freshwater supplies are not readily available. Seawater desalination plants are usually located close to the coast. So there is little energy required to convey the water to the treatment plant. In additional, energy requirements for pumping and conveying brackish groundwater are similar to those for freshwater aquifer sources (Stillwell 2010).. 2.2.2 Energy consumption for water treatment and distribution Once water is extracted from natural sources, it requires energy for treatment before being distributed to end use. Young (2010) mentioned that 7% of worldwide electricity is consumed for the distribution of drinking water and the treatment of wastewater. This is because once water is extracted from groundwater, surface, lakes, oceans, sea and is delivered to a geographic area where it will be used, it is processed through treatment systems for removal of micro-organisms and suspended solid to meet health and other quality standards (Wilkinson 2000). In addition, the treatment and distribution processes require varying amount of energy depending on the water quality, topography of the area served and system requirements. Franklin (1996) said that energy is consumed during water treatment because many water utilities will install energy-consuming technologies such as ozone for disinfection and membrane filtration for removal of particulate and organic matter.. 11.
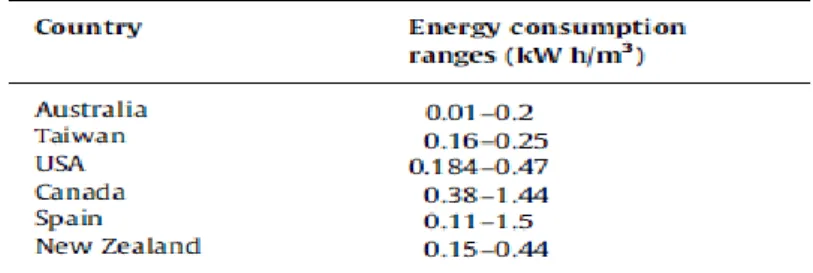
(24) Treatment for ground and surface sources Normally, conventional water treatment is used for surface and groundwater sources. A typical surface water treatment plant, shown in Figure 2.3, uses a combination of physical and chemical treatment processes to remove contaminants from water.. From: Stillwell (2010) Figure 2.3 Typical water treatment plant operations for surface water source In the treatment processes shown in Figure 2.3, pumping between processes not including raw water pumping or treated water distribution requires 44% of the total electricity used for water treatment. The actual treatment processes: flocculation, sedimentation, filtration, and disinfection consume remaining 56% of the total electricity (Goldstein 2002). Groundwater treatment is similar to the surface water treatment, in which the energy consumption in the treatment system depends on the water quality (Tripathi 2007). Table 2.2 shows the conventional water treatment energy consumption ranges in several countries. It shows that Spain has the highest upper limit energy consumption for water treatment. This is because Spain uses reverse osmosis desalination to treat water. Meanwhile, Taiwan is the 3rd ranked country to consume energy for water treatment (Cheng 2002).. 12.
(25) Table 2.2 Water treatment energy consumption ranges in several countries. From: Cheng (2002) Treatment for desalination Desalination is considered to compensate diminishing supply and increasing demand of water (Pearce 2008). Seawater is more saline than water drawn from wells, rivers or other sources. It needs more stringent treatment measures to remove the high concentrations of dissolved ions. The minimum energy required to desalinate water is proportional to the salinity of the raw water, but the energy required in practice also depends upon the technology (Singh 2011). Commonly desalination uses thermal processes such as multi-stage flash and reverse osmosis for treatment. Additional energy consumption intensity for seawater desalination is substantially higher than less saline water (Narayan 2012). Distribution Once water has been collected and treated to applicable standards, it will be distributed to end users. Distribution requires pumping, the most energy-intensive aspect of water systems. Water distribution represents 85% of the energy use for typical surface water supply, while treatment is responsible for the other 15% (Stillwell 2010). The energy requirements for water distribution vary with the distribution of end users in relationship to the treatment plant. Additionally, aging infrastructure with old pipelines 13.
(26) has leaks and creates more friction, requiring more electricity for water distribution (Stanford 2013).. 2.3 Energy Consumption at Water End Use The treated raw water will then be distributed to various end uses such as residential, commercial and industrial sectors. Yet end-use processes often have the highest energy intensity of all water life cycle processes, and they deserve far greater attention (Rothausen 2011). Energy inputs are required for the following functions (Arpke 2006): . Treatment (water softening and filtration),. . Recirculation loops within building and facilities,. . Additional pressurization,. . Thermal requirements (heating and cooling), and. . Wastewater pumping.. 2.3.1 Water energy use in residential sector Water use in the home is one of the most energy-intensive aspects of the water sector in the US (Sander 2012). Common household water uses shown in Figure 2.4 include clothes washer, showers, faucets, baths and dishwasher. The processes of pumping water, heating, and washing clothes consume widely varying amounts of energy per unit water (Shimoda 2010). But the most influential end use energy consumptions in residential sector are instead water heating, cooling and washing machine.. 14.
(27) Bath, 2%. Dishwasher 2%. Other domestic, 3%. Toilet , 31%. Faucet, 18%. Shower, 19%. Toilet. Clothes washer. Shower. Other domestic. Bath. Dishwasher. Clothes washer, 25% Faucet. From: Shimoda (2010) Figure 2.4 Typical water treatment plant operations for surface water source Water is usually heated or cooled before consumption in most residential sectors. Bathing involves the most intensive use of hot water at residential home (Kempton 1988). The consumption of energy for water heating was measured by Kempton (1988). Each person is estimated to consume energy of 1.8-4.7kWh/d. In a typical house, heating water accounts for 15% of the total household energy use and nearly 30% of indoor water use is hot water. Wallgren (2009) reported that about 22% of total electricity is used for cooking processes in Swedish household. Cheng (2002) analyzed the energy consumption in six-story residential water use focusing on electric energy consumption (kWh) and hot water heating in the residential building. Table 2.3 indicates an evaluation of energy consumption in residential water use. According to this analysis, hot water consumed energy of around 6.5kwh/m3 in this residency and most energy consumptions come from water heating equipment with 5.55kwh/m3. This means that the equipment consumes around 85% of the total energy consumption in the residence. Therefore, water heating is considered to consume most 15.
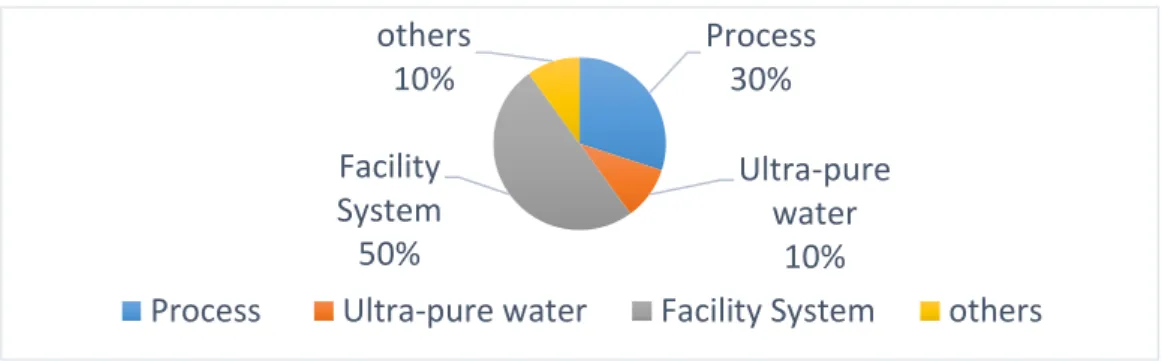
(28) energy in the residence. Table 2.3 Energy consumption in residential water use. From: Cheng (2002). 2.3.2 Water energy use in industrial sector Furthermore, the industrial sector such as manufacturing plants requires a significant amount of water in their processing system (Murphy 2003). In the semiconductor industry, water must undergo treatment processes such as filter, conventional treatment and membrane filtration whereby the energy is consumed during the treatment process (Hu 2003). Figure 2.5 shows the categories of electricity consumption of a fab. It can be seen that the facility system accounts for 50% of power consumed. The processing tool accounts for almost 30%, the ultra-pure water consumes 10% of the total power, and others 10 % (MOEA 2012). others 10%. Process 30%. Facility System 50% Process. Ultra-pure water. Ultra-pure water 10% Facility System. others. Figure 2.5 Typical water treatment plant operations for surface water source. 16.
(29) 2.4 Energy Consumption for Wastewater Treatment Once water is used by the end users, it moves through a wastewater collection system to a treatment plant and later discharged back into the environment. In some cases, water may leave the treatment plant to be used again before eventually being discharged. Used water may require treatment to a prescribed standard before it is discharged or reused (Lienhard 2012). A wastewater system requires energy for collection and conveyance, treatment operations and processes, and solid processing in the treatment facilities (Wilkinson 2000).. 2.4.1 Wastewater treatment and energy consumption Wastewater treatment is classified into three level of primary, secondary and tertiary treatment. Normally, domestic waste water is treated with primary and secondary. Primary treatment processes include waste collection, screening, size reduction, grit removal and sedimentation. These are low energy intensity processes if compared with secondary treatment (Hammer 2008). Secondary treatment includes aeration and membrane bioreactor processes. Aeration is the process by which air is circulated through, mixed with or dissolved in a liquid or substances. For the membrane bioreactor (MBR) is the combination of a membrane process like microfiltration or ultrafiltration with a suspended growth bioreactor, and is now widely used for municipal and industrial wastewater treatment with plant sizes up to 80,000 population equivalent. Both of the processe helps substantial removal of organic material and suspended dissolved solids (Lienhard 2012). However, only 20-30% of nitrogen can be removed from the wastewater. Table 2.4 shows the energy consumed in the secondary treatment system. Sweden is shown to require more energy consumption during the treatment processes, followed by Australia. 17.
(30) Table 2.4 Energy consumption of secondary wastewater treatments. From: Crawford (2009) Tertiary treatment consumes substantial amounts of energy. The energy consumed depends on size of the plant, location of the treatment plant, type of impurity, end users of water in the area, quality pf treatment. Besides that, type of impurity is the major parameter that affects the energy consumption in wastewater treatment. In summary, wastewater treatment requires greater amounts of energy to treat water back to effluent discharge standards.. 2.4.2 Energy consumption of wastewater reuse Nowadays, wastewater recycling becomes more accepted and has been adopted in several countries. Singapore and Isreal recycle about 50% and 87% of their wastewater, respectively, and the US uses only 8% of its treated wastewater. In Australia, residential wastewater reuse consumed 0.27-1.2kWh/m3 of electrical energy, while large scale potable waste water pumping and recycling with reverse osmosis process consumed 2.8-3.8 kWh/m3 of electricity (Anserson 2006). Wastewater reuse by contextualizing increases not only the amount of water that could be conserved but also the potential of energy savings (Kajenthira 2012).. 18.
(31) Chapter 3. Energy Consumption for Water Supply and Wastewater by the Governments. Followed by the review of energy consumed in water life cycle, this chapter investigates the energy consumption for water supply and wastewater treatment. Section 3.1 analyzes energy consumption for water supply; Section 3.2 analyzes energy use for wastewater treatment.. 3.1 Energy Consumption for Water Supply The environmental impacts associated with water supply are more compounded by energy required during extraction, treatment, and distribution. Basically, the government pays 33% of energy budget for public utilities (CEC 2003). Treatment consumes most energy in water supply phase at approximately 80% (Stokes 2006). The factors affecting energy consumption for water supply are shown in Table 3.1 (Rothausen 2011). The factors affecting energy consumption in abstraction and conveyance are: (1) pumping water from source, and (2) transferring water source to treatment plant. The amount of energy consumed by pumping system depends on the depth of the source. The factors of energy consumption in treatment and distribution depending on the treatment system are: (1) filtration and ultraviolet treatment, (2) desalination, and (3) pumping. They are analyzed in Section 3.1.1 and Section 3.1.2 below. Table 3.1 Impact factors for energy consumption Phases 1. 2. 1. 2. 3.. Extraction and conveyance Treatment and distribution. 19. Factors Pump water from source Transfer water to treatment plant Filtration and ultraviolet treatment Desalination Pumping.
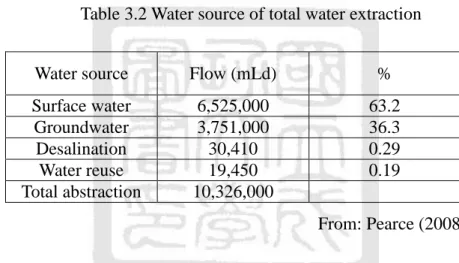
(32) 3.1.1 Energy consumption for extraction and conveyance NRDC (2004) mentioned that water extraction and conveyance consume most energy for the whole process of water supply. In general, water resources come from different natural sources. Most water supplies are dominated by surface water sources which comprise more than 60% of the total water abstraction and the remainder is provided from groundwater as shown in Table 3.2 (Pearce 2008). While extraction desalination and water reuse are fairly insubstantial in total water abstraction, they only constitute 0.3% and 0.2%, respectively. Table 3.2 Water source of total water extraction Water source. Flow (mLd). %. Surface water Groundwater Desalination Water reuse Total abstraction. 6,525,000 3,751,000 30,410 19,450 10,326,000. 63.2 36.3 0.29 0.19 From: Pearce (2008). Extracting water from different sources can require varying amount of energy. Typically, little or no energy is required to extract surface water for supply (Bennett et al 2010). This is because surface water normally comes from lakes and rivers, which can be directly stored at reservoir. Therefore, construction and maintenance of dams and reservoirs are the contributors for energy consumption of surface water. Burton (1996) said that energy devoted to groundwater pumping depends on (1) how far the water must be pumped before reaching the surface, (2) the volume of groundwater pumped, and (3) the types of pumping devices water right holders choose to use ( for example, efficiency and fuel type). Besides that, changes in water table elevation and 20.
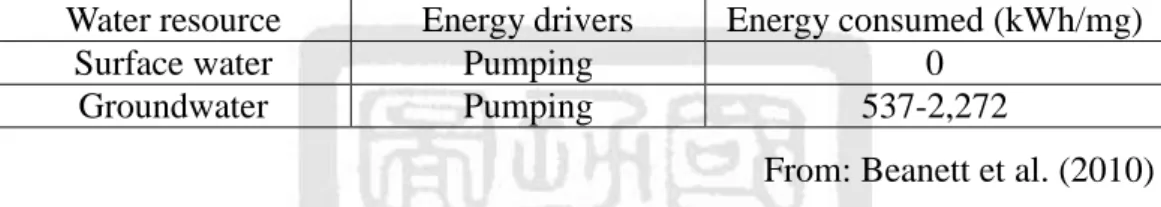
(33) clogged well screens cause groundwater pumps to run less efficiently, thus increasing the amount of energy needed to pump groundwater (Zhu et al. 2007). Based on Bennett (2010), different water sources are discovered to consume different amounts of energy in pumping system. Table 3.3 shows that groundwater pumping consumes more energy than surface water. While surface water source consumes zero energy, the energy consumed by groundwater is 537-2,272 mega gallons (mg), depending on the location of the water from the source. Table 3.3 Energy for surface water and groundwater pumping Water resource Surface water Groundwater. Energy drivers Pumping Pumping. Energy consumed (kWh/mg) 0 537-2,272 From: Beanett et al. (2010). Once water is pumped from natural source it will be conveyed to a treatment plant. For water conveyance system, a number of factors such as length of pipeline, pipeline diameter, and elevation changes affect energy consumed for water transportation (Siddiqi 2011). Water volume and the distance of water travel are the key factors affecting energy consumption. As population nowadays expands into places where water must be imported, water supplies become more energy intensive. Water transfer systems, which are used to import water to one area, have both pumps and generators to obtain water over the hills and mountains, where a lot of energy is lost. Furthermore, energy requirements are highly dependent on topography, the size of the municipality and the distances that water must travel (Gleick 1994).. 3.1.2 Energy consumption for treatment and distribution The construction, maintenance, and operation costs of urban water treatment systems represent a significant part of government spending on municipal infrastructure (Cheng 21.
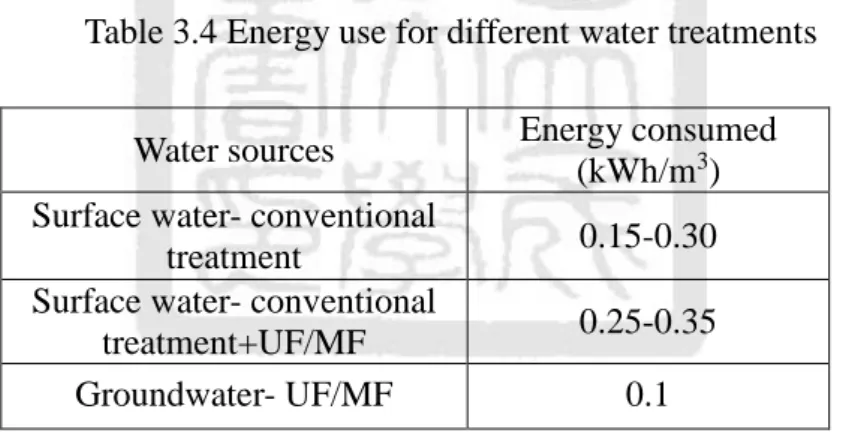
(34) 2002). The energy consumption for water treatment and distribution accounts for 1% of total energy consumption in Japan. Treatment processes require varying amounts of energy depending on factors such as water quality, topography of the area serve, and system requirement (Wilkinson 2000). Normally surface water and groundwater use conventional treatment to remove contaminants and particle. However, many countries begin to consider using pretreatment to reserve osmosis or nanofiltration system in order to help reduce cost of the overall system and improve on-stream time and security of supply (Pearce 2008). Conventional treatment commonly helps remove suspended material from water and chemical disinfection. If conventional treatment is used treat the water source, it will consume more energy than microfiltration and ultrafiltration. Table 3.4 illustrates energy consumed in different water treatment processes (Pearce 2008). Table 3.4 Energy use for different water treatments Energy consumed (kWh/m3). Water sources Surface water- conventional treatment Surface water- conventional treatment+UF/MF Groundwater- UF/MF. 0.15-0.30 0.25-0.35 0.1 From: Pearce (2008). Table 3.4 shows that surface water using conventional treatment as pretreatment or ultrafiltration/microfiltration consumes more energy than groundwater using ultrafiltration and microfiltration without the conventional process. This is because conventional pretreatment has very high chemical cost and is unattractive for RO pretreatment. If only ultrafiltration and microfiltration are used to treat the groundwater under influence by surface water, it will not consume much energy. Moreover, water treatment will involve more energy insensitive process such as ozone and ultraviolet light that will consume more 22.
(35) energy in the treatment system (Elliot 2003). Water scarcity is an issue in many parts of the world. Many countries consider using desalination and imported water due to increasing demand of water. Desalination is classified into brackish and seawater desalination. In some parts of the world, coastal aquifers are brackish due to saline intrusion (Pearce 2008). More saline water sources such as brackish groundwater and seawater can be converted into usable water supplies by reducing the contents of total dissolved solid (TDS) or salt and minerals. The energy intensity of desalted water depends primarily on the volume of the water being desalted, the quality of the source water supply, and the technology used to desalt the water (Bennett et al. 2010). Table 3.5 illustrates the energy consumed in brackish surface water, groundwater, desalination and seawater, treatment for desalination used pretreatment, reserve osmosis system. Seawater desalination consumed the highest energy. This is because salinity TDS in brackish surface water and groundwater are 930ppm and 2,200 ppm respectively, which are lower than seawater with 11,000ppm. Energy required to desalinate water is proportional to the salinity of the raw water, but the energy required in practice also depends upon the technology employed (Lienhard 2012). Table 3.5 Energy usage for desalination Energy consumed (kWh/m3) 0.83 0.98 1.67 2.3-4.0. Water Sources Brackish surface water Brackish groundwater Brackish desalination Seawater desalination. From: Pearce (2008) In comparison to treatment of groundwater and surface water, desalting is much more. 23.
(36) energy intensive. Although desalination is energy intensive, it may remain advantageous relative to alternative such as long distance water transfers when overall costs, life-cycle energy expenditures, and environmental impacts are taken into account. Lee (2012) mentioned that Taiwan water department finds out water pumping consumes 90% of the total energy demand in water treatment plant. After treatment, water is usually pumped at high pressure to the distribution and storage system. The factor of energy required for distribution pumping is mainly driven by size, elevation, system age, and configuration of the system. Pump efficiency could have significant impacts on energy consumption of distribution. For example, many distribution systems rely on gravity to propel water into and through the pipe network (Boulos 2002). Changing old piping can be helpful to reduce the energy consumption as pipe age prone to building up a mineral inside the tube through a process known as tuberculation. This increases friction and head loss requiring extra pumping (EPRI 2002).. 3.2 Energy Consumption for Wastewater Wastewater requires energy for treatment until it meets the higher standards of water quality and environmental regulation. As Figure 2.2 indicates, wastewater consumes electricity in three stages: collection, treatment, and discharge to receiving water. A wastewater treatment system consists of a network of sewers collecting wastewater and transporting sewage from the customers (residential, industrial and agricultural users). CEC (2005) mentioned that pump water depending on topography system size and age. Wastewater pumps, pumping both liquids and solids, are intrinsically less efficient than water pumps. Hence, it will affect the amount of energy consumed. Besides that, aging wastewater collection systems result in additional inflow and infiltration (I/I), leading to. 24.
(37) higher pumping and treatment costs. MOE (2012) mentioned that treating 1m3 of domestic wastewater requires 0.4142kWh of energy while Japan only consumes 0.3496 kWh. It may be because the wastewater in Taiwan includes industrial and residential types, thus consuming more energy to work with it. Wastewater treatment is classified into primary, secondary, and tertiary treatment. Solids removed during the primary wastewater treatment are usually treated and reused for fertilizers, incinerated or disposed of in landfills (Stanford 2013). The more solids, the higher energy is required for disposal and incineration. In industrial park, treating 1m3 wastewater consumes 9.26x10⁻¹ kWh of electricity (Tong 2013). After that, it will go through the secondary treatment to remove organic matter and remaining suspended solids through biological treatment. It is pumped into an aeration tank to provide oxygen for those organisms, which is the most energy-intensive step of the processes. Figure 3.1 illustrates the electricity requirement for activated sludge systems. From this figure, we can see that aeration consumes the highest energy at 54.1%, followed by wastewater pumping and anaerobic digestion which account for 14.3% and 14.2%, respectively.. 25.
(38) Grit, 1.4 Screens, 0 Clarifiers,…. Wastewater pumping , 14.3 lighting &building , 8.1 Chlorination, 0.3 Belt Press, 3.9 Anaerobic Digestion, 14.2. Aeration, 54.1. Gravity Thickening , Return sludge 0.1 pumping , 0.5. Figure 3.1 Electricity consumed at activated sludge systems For the advanced wastewater treatment, over three-fourths of the total electricity required for wastewater treatment is used for processes aimed to separating solids and liquids – diffused air aeration, nitrification, gravity and flotation settling, digestion, and dewatering. Over 30% of the electricity is required for aeration alone due to the use of energy-intensive blowers. The electricity requirements per unit of wastewater increases as shown in Table 3.6. The increasing energy intensity from trickling filter to activated sludge treatment shows the large electricity requirement for blowers used during aeration. Table 3.6 Electricity use for different treatment technologies Technology Trickling filter Activated sludge Advanced treatment without nitrification Advanced treatment with nitrification. kWh/m3 0.25 0.34 0.40 0.50. From: Stillwell (2011) Unlike water treatment plant, electricity required per unit of volume in wastewater treatment plant varies with treatment plant size. Larger wastewater treatment plants. 26.
(39) provide significant economies of scale, and recent trends reflect a move toward larger capacity wastewater treatment plants for this reason. For example, 1 MGD (mega gallon per day) of wastewater treatment plant size will consume high intensity of energy compared with larger wastewater treatment plant (Stillwell 2010). Following treatment, effluent is discharged into water-receiving bodies. Most cities locate wastewater treatment plants at low elevations so as to minimize the energy costs of pumping treated effluent and raw sewage.. 3.3 Factors Affecting Energy The above two sections has analyzed the energy consumption for water supply and wastewater treatment. This section identifies the factors that affect energy consumption and reduction from the prior studies.. 3.3.1 Factors affecting energy consumption Eight factors affecting energy consumption are drawn from the eight studies as shown in Table 3.7. These factors are sorted into 3 categories: water source, water quality, and treatment plant. Water source has two factors: location and depth. Water quality contains type of water and solids in water. Type of membrane system, pump efficiency, plant size, and age are the four treatment plant factors affecting energy consumption. The bottom row shows the number of times each factor is mentioned in the eight studies. Among these factors, type of water and type of membrane system are mentioned five times, respectively. Pump efficiency, plant size, and age are mentioned three times, and factors of location and depth of water source are mentioned twice.. 27.
(40) Table 3.7 Factor affecting energy consumption. Factors Studies Wilkinson (2000) Elliot (2003) Pearce (2008) Bennett et al. (2010) Stillwell (2010) Rothausen (2011) Lee (2012) Tong (2013) Total. Water Source Location. Depth. Water Quality Type of Water. Solids in water. Treatment plant Type of membrane system. Pump efficiency. Plant size. Age. . . . . . . . . . . . . . . . . . . 2. 2. 5. 1. . 5. 3. 3. 3. The water source location affects energy consumption. For example, the energy needed for conveyance of water from ground or sea is different. Energy required for pumping also varies with depth of water source. Water extraction from different sources is categorized as a water quality factor. For example, surface water extracted from rivers contains suspended solid such as sand, silt, algae and microorganism. Water extracted from ground might contain dissolved gases, inorganic, organic and chemical. On the other hand, seawater has higher salinity as compared to surface water and groundwater. In order to remove salinity and total dissolve solid (TDS), it needs more stringent treatment which will consume energy depending on the water of salinity. Furthermore, the more solids in water, the higher energy is required for disposal and incineration. Membrane is used in various water and wastewater treatment system to treat contaminated water. Some of water contain contaminants such as dissolved minerals, 28.
(41) particulates, bacteria, organic and microorganism require typical membrane system to treat it. For example, sieving mechanism in ultrafiltration and membrane filtration provides an absolute barrier to particles greater than the size of the membrane pores in order to ensure a much better than reserve osmosis (RO). Therefore, choosing a suitable membrane system is very important as it affect energy consumption in a treatment plant. Efficiency of pumps will affect energy consumption. A pump with lower efficiency tends to consume more energy to pump water to treatment plant. Furthermore, smaller plants size will consume higher intensity of energy compared to larger plants. Further, age of the plant will directly affect energy consumption. Older plants requires more energy for treatment or pumping process as compared to new ones.. 3.3.2 Energy reduction Energy consumption for water supply and wastewater have become higher recently. The governments in many countries have started to reducing energy for water supply and wastewater, and also tried to reduce the embedded energy for water supply and wastewater. Two things are taken as follows: (1) Infrastructure upgrades. There are several high energy efficiency and demand management opportunities in the water and wastewater. Pumps account for up to 95 percent of the energy used to distribute drinking water (CEC 2005) so that enhanced pump efficiency could have significant impacts on distribution’s energy consumption. For example, many distribution systems rely on gravity to propel water into and through the pipe network. Systems that do not have such beneficial topography can employ algorithms to create temporal rules dictating whether a pump should be turned on or off to maximize energy efficiency (Boulos, 2002). Changing old piping can be helpful. Traditionally pipes are made out of iron, which corrodes and degrades over 29.
(42) time, thereby weakening their structure and leading to leaks and ruptures. As pipes age, they are prone to a mineral build up inside the tube through a process known as tuberculation. This increases friction and causes unnecessary head loss, requiring extra pumping (EPRI, 2002). Other significant improvements include leak detection sensor technologies for new installations and retrofits, or pipe lining to repair aged systems. (2) Increased instrumentation and control. Treatment plants benefit from instrumentation and control of dissolved oxygen in the aeration basins as aeration equipment can be controlled to maintain dissolved oxygen levels and optimize the overall performance of the aeration system and thus help to control the energy consumed by treatment plants (Burton 1996).. 30.
(43) Chapter 4. Energy Consumption at End Use and Recycling Water. Water consumption for end use and recycling has high energy intensity among water life cycle processes. This chapter analyzes the energy consumption for end use and recycling water. Section 4.1 analyzes energy consumption at end use, and Section 4.2 analyzes energy used for water recycling.. 4.1 Energy Consumption at End Use Lee (2012) mentioned that end use phase are the most significant of energy consumed for the water system. Apart from house pumps and water heating equipment, domestic water-use equipment such as dishwashers, clothes washing machines, clothes dryers, and cooking devices also increases the consumption of energy (Ito 1997). Section 4.1.1 investigates the energy use of household appliance in residential sector. The household appliance includes showerhead, house pump, clothes washer, and toilet. On the other hand, Section 4.1.2 discusses the industrial processes, including purifying water and chiller, which result in energy consumption in industrial sector.. 4.1.1 Energy demand for residential water use In Taiwan, residents account for 18% in the total energy consumption as they usually consume energy for water heating and cooling (Lee 2012). Hot water equipment, one of the most necessary equipment used in the residential building, emits carbon dioxide when water heating is carried out in the long term. Nonetheless, people rarely concern about the problem. Hot water is used for shower, clothes washing, cooking and water boiling, while cool water is used for toilet. Lee (2012) mentioned that energy demands for hot-water-intensive appliance account for significant fractions of total demand during the 31.
(44) end use phase: 73% for clothes washer and 93% for showerhead. Normally, energy consumption of water heating for showerhead is the indirect source of electricity consumption in the water system. Eggertson (2005) said that hot water accounted for 21% of the total residential secondary energy use; Lee (1998) showed that water heating accounts for about 18% of their home energy bill. Commonly used electric water heaters use an electrical resistance element to heat water directly in the US, but some commercial water heaters employ the heat pump principle and are therefore more efficient (EP 2003). This is because heat pump water heaters can cut the cost of electric water heating by more than half. The reason is that electric water heaters lose heat from the tank and fittings throughout the day when the remaining hot water is stored after shower, thus wasting a significant amount of energy (Cheng 2002). Besides that, the lifespan of appliance is one of the core factors which will directly affect the amount of energy consumption. This is because useful time of the appliance before it is replaced while it is most environmentally beneficial (Chakley et al. 2003). Residential plumbing used for hot water pipes consumes a significant amount of energy. For example, the frequency of hot water daily usage is twice higher in winter, and the amount of energy wastage is 0.47 kWh. Over the long term, energy wastage by residential water users is thus enormously significant. Furthermore, doing laundry uses energy for various tasks, including mechanized work or manual labor, hot water heating, and pumping. In the recent years, the end use of residential use clothes washer has increased rapidly. From the report of MOEA (2012), the energy consumption of each laundry has increased from 360,542 to 429,841kWh from. 32.
(45) 2009 to 2012. Located on the top story of a residential building or on mechanical floors, a house pump is commonly used to supply elevated house tanks. House pumps include an electric motor or impeller (Cheng 2002). Energy consumed by house pumps depends on the pump efficiency, the height of the building, and the specific weight of water. If the efficiency of the pump is 80%, the water can pump rapidly at the same time can reduce the energy consumption (EPRI 2013).. 4.1.2 Energy consumption of industrial water use Figure 4.1 indicates the general categories of energy use in Taiwan. From here, we can see that industrial sector contributes to the highest electricity consumption at the percentage of 61%, followed by services at 19% and residential sector at 18%. Southern Taiwan Science Park (STSP) supplies 200,000 tons of water to the industrial sector daily as industrial plants usually require a significant amount of water (溫源鳳 民 91). Tap water is used in processing system, chiller water system, irrigation, and domestic use (TSMC 2013).. Services 19% Residential 18% Agricultural 1%. Industrial 61%. Transportation. 1%. Figure 4.1 Energy consumption by different sectors (MOEA 2012). 33.
(46) Water is normally consumed during wafer fabrication. This is because processing system requires high amount of ultra-pure water to remove contaminants (Murphy 2003). It must undergo treatment before being supplied to processing system. Ultra-pure water will consume a significant amount of energy because it contains many steps for the purification of tap water (Hu 2003). Figure 4.2 shows the flow chart of ultra-pure water system. Each stage inserts different amounts of chemical substance to purify the tap water into ultra-pure water. Pretreatment system uses multimedia filtration to help remove suspended solids, colloids or heavy metals entrained within the water run in order to avoid the risk of fouling the membrane surface. The pretreated water then passes through make-up system for primary treatment, which includes activated carbon filter, reserve osmosis and ultraviolet. Polishing system contains ultraviolet and ultrafiltration. The energy consumption during primary and secondary treatment depends on the quality of the raw water (Wilkinson 2000).. Raw water. Pretreatment System. Make-up system (Primary Treatment). Polishing System (Secondary Treatment). Point of Use. Figure 4.2 Flow chart of UPW treatment system Besides that, William (2002) mentioned that all chemical inputs in semiconductor processes must thus go through rigorous purification processes, generally based on vacuum distillation. Distillation is well known to be an energy intensive process, accounting for around 7% of energy consumed of the US chemical industry (Sorenson 1997).. 4.2 Energy Used for Recycling Water Section 4.2.1 discusses the reuse of wastewater, and Section 4.2.2 explains the energy 34.
(47) consumption of recycle water treatment and distribution.. 4.2.1 Reuse of wastewater Effective treatment and reuse of wastewater in combination with water conservation measures potentially help reduce both groundwater and desalinated water withdrawal while decreasing the energy use in groundwater withdrawal and in the production and transportation of desalinated water (Kajenthira 2012). Basically, municipal and industrial wastewater can be reused within the industrial sector with lower levels of treatment, such as secondary, tertiary, and advanced treatment. Most of the treated wastewater is returned to streams, rivers or lakes. In some cases, when water is recycled or reclaimed and is treated to an acceptable standard, it is safe to be reused in non-potable application, e.g., agricultural and landscape irrigation, groundwater recharge, industrial cooling, and toilet flushing (Sanders 2012). Table 4.1 illustrates the segmentation of wastewater reuse at end use (Pearce 2008). This table shows that industrial and agricultural sectors reuse wastewater the most at the percentage of 65.5% and 23%, respectively. Table 4.1 Wastewater reuse market by end users End User. %. Industry and power. 65.5. Municipal. 11. Agriculture. 23. Other. 0.5 From: Pearce (2008). Using reclaimed water can help to increases water quantity for end use. It helps reduce the use of potable water by industrial, housing, and recreational development. 35.
(48) project that use reclaimed water. It also helps reduce the amount of groundwater withdrawal (Haering 2009). However, treatment for wastewater consumes a significant amount of energy.. 4.2.2 Energy consumption of recycle water treatment and distribution TSMC is one of the companies which is aware of the problem of water shortage, therefore they promote water saving. In 2012, TSMC’s process water recycling rate reached 86.5%. The water recycling involves the recycle of air conditioning condensation for cooling tower, as well as the recycle of backwash wastewater from active carbon tower and sand filter tower by filtration for secondary water use (TSMC 2013). Although water reuse saves a lot of water, it requires an additional energy investment during the treatment (Stillwell 2011). Chen(2012)analyzed that different water recycling rates consume different amounts of energy. The result of his studies shows that higher recycling rate will consume more energy to treat the recycled water. Furthermore, Tong (2013) discovered that recycle 1m3 of wastewater used for horticulture consumes 27.7x10⁻¹ kWh of energy during the treatment. Recycled wastewater is able to replace tap water for horticulture, but it is energy consuming and inefficient for other uses. In the UK, using grey water can potentially save more water but this will, on the contrary, increase greenhouse gas emission as compared to other water demands (Environment Agency 2010). It shows that 25 mega liter (ML) of water is saved per year along with the net carbon emissions of 3,000-5,400 tCO2eq, which is equal to 1 kgCO2eq/m3 of water saved in communal appliances and 3.6 kgCO2eq/m3 in individual domestic appliances (Environment Agency 2010). This is because life time carbon footprints of grey water recycling system consist of embodied carbon and the majority of. 36.
(49) the carbon emitted is from operational use. The operational energy and carbon intensity is higher than raw water, electricity for pumps, treatment, disinfection, and controls system. Recycled water will be distributed back to various end users: residential, agriculture, industrial users. Water reused in the residential and industrial sectors helps decrease overall energy consumption. Basically, recycled water uses as in landscape irrigation and toilet flushing do not require water to be treated to drinking water standard (Stillwell 2010). Besides that, recycled water plumbing to each end user consumes energy depending on the distance of the end user. Tong (2013) mentioned that water reuse in an industrial park is treated with advanced treatment. The recycled water is then used for horticulture, and the distribution to horticulture will consume energy.. 4.2.3 Factors of Energy Consumption and Reduction Nine relevant studies mentioned six factors affecting energy consumption at end use and recycling water as shown in Table 4.2. Household consists of three factors: appliance age, efficiency of water heater and pump system. Distance of end users, level of treatment and pumping efficiency are the factors involved in a treatment system. The bottom row in Table 4.2 also presents the number of times each factor is mentioned in the nine studies. Level of treatment and water heater efficiency are mentioned four and three times, respectively. Pump efficiency is mentioned two times, while appliance age, pump system and distance of end users are just mentioned one times. Normally, the appliance (cloth washer and dishwasher) use at household has a certain use period. An end user will not buy a new washing machine when the old one is still functioning properly. But the old appliance will consume more energy. Furthermore, common household water use of cloth washers, showers, bath and dishwasher generally. 37.
(50) draw a portion of heated water. Energy consumed from a water heater is depending on efficiency of water heater. Residence used electric-resistance water heater works by heating water and storing it in an insulated tank. It is an inexpensive and easy way to install. Table 4.2 Factors affecting energy consumption at end use and recycling water Factors Studies. Household Efficiency Appliance of water age heater. Sorenson (1997) Cheng (2002) William (2002) Hu (2003) EP (2003) Chakley et al. (2003) Stillwell (2011) Lee (2012). Pump system. Treatment system Distance Level of Pump of end treatment efficiency users . . . . EA (2012) Total. . 1. 3. 1. 1. . . 4. 2. However, some commercial use heat pump water heaters can reduce the cost of electric water heating. Therefore, some water heaters are more efficient in energy consumption. On the other hand, pump system that pumps water from water tank to residence with high efficiency will consume energy. Once recycled water is treated, it will be distributed to end users. Distance of end users is a factor that needs to be considered during distribution of recycled water to the end users. Longer distance consumes higher amount of energy.. 38.
(51) Level of treatment used is dependent on the water quality. The water which contains contaminants such as dissolved minerals, particulates, bacteria and organic requires typical purification system to treat it. Water treatment for reuse would need the secondary and tertiary treatment systems that will consume large amount of energy as compared to primary treatment system. This is because secondary and tertiary treatments involve the membrane system to treat suspended solid. Furthermore, pump efficiency also directly affects energy consumed in the treatment system, because conveyance of tap water to treatment system requires pumping system to pump water. Pump system of lower efficiency requires higher energy consumption to pump water during treatment. Many end users or companies have started to concern about the energy reduction problem. For example, manufacturing companies begin to use heat pumps to replace boilers as heating source for ultrapure water. Besides that, they also replace low efficiency water pumps with high efficiency ones, to reduce a significant amount of energy for around 10-30% in the treatment system (TSMC 2013).. 39.
(52) Chapter 5. Case studies. This chapter analyzes the relationships between water and energy consumed at end use. Factors that affect energy consumption in the end-use stage can be applied in the case studies. Three case studies in Sections 5.1 to 5.3 are apartment, school and manufacturing plant.. 5.1 Apartment and Water Energy Consumption Relationship Section 2.3.1 mentioned that water use in home is one of the most energy-intensive aspects. This case studies the relationship between water and energy use in an apartment. Section 5.1.1 analyzes the data to investigate the relationship between water and energy consumed by the apartment. The Spearman’s rank correlation coefficient was used in analyzing the relationship between water and energy consumption at end use. Non-parametric method such as Spearman’s rank is suitable for preliminary study and makes fewer assumptions (Elise 2002). The equation of Spearman’s rho is as below (Steve 2005): Rs 1 . 6 d i. 2. n n 2 1. Rs is correlation coefficient, di is the difference between the two variables, n is the number of individual. The Spearman’s rank order correlation coefficient Rs can take values from +1 to -1. Rs of +1 indicates a perfect association of ranks. Rs of zero indicates no association between ranks and a Rs of -1 indicates a perfect negative association of ranks. The closer Rs is to zero, the weaker the association between the ranks. Normally water end use in an apartment includes toilet, bathroom, cloth washer, and dishwasher. Table 5.1 shows the amount of water and energy consumed at the 14th floor of. 40.
(53) the apartment from 2012 to 2014. The period of 7-8/2013 shows the highest difference of 9. The reason can be that the amount of water consumption is low but July and August are the hot summer that consumes a large amount of power in air conditioning. Table 5.1 Water and power consumption of an apartment Resource Month 5-6 7-8 2012 9-10 11-12 1-2 3-4 5-6 2013 7-8 9-10 11-12 1-2 2014 3-4 Rs. Water m3 Rank 10 12 21 11 42 4.5 52 2 67 1 38 8 37 9 32 10 42 4.5 41 6 39 7 44 3. Power kWh Rank 135 12 580 3 356 6 285 10 361 5 327 8 666 2 834 1 415 4 280 11 260 9 351 7 -0.12. di. di2. 0 8 -1.5 -8 -4 0 7 9 0.5 -5 -2 -4. 0 64 2.25 64 16 0 49 81 0.25 25 4 16. The bottom row Rs is -0.12 shows the negative low relationship. This means that the amount of water consumed somehow increases but amount of energy consumed decreases. The low water consumption in residential sector is due to the fact that most people seldom cook at home and boil water. Hence, water consumption is unlikely to affect the energy consumption at most part (Chang 2002). Factors that affect energy consumption in residence are the appliance age and efficiency of water heater. Efficiency of water heater and appliance age can help to reduce energy consumption. This is because the longer use period of appliance will consume high amount of energy. Replace an old appliance with new one to reduce energy consumed. Water heating is perhaps the most complicated process of all residential end-uses. Usage behavior varies greatly and depends on the ownership of other appliances (e.g., 41.
(54) clothes washers and dishwashers), the characteristics of those appliances and other water-using equipment, the water inlet temperatures, the hot water temperature set points, and the water use temperatures (Koomey 1994). In addition, season change will affect energy consumption. For example, power consumption in 7-8/2012 and 5-8/2013 is almost double than other months. The power consumed in October to April decreases in the winter season as residents seldom use air conditioners. With yearly comparison, we can see that water and energy consumption has very weak relationship. Rs value of -0.12 indicates a low level of fitness between them. It can be concluded that the water and energy consumptions for this apartment household are not related.. 5.2 School The energy-water relationship exists at a relatively smaller scale in such as campus or school. Therefore, this section will examine it by analyzing the relationship between water and energy consumed in school sector. Section 5.2.1 analyses water use in school while section 5.2.2 studies the relationship between water and energy consumption in school.. 5.2.1 Water used at school This section uses one case school located in Tainan to analyze the relationships between water and energy consumed. Figure 5.1 illustrates the school areas and they are divided into three departments. Each department area and the number of students is shown in Table 5.2. The areas of departments B and C are larger than department A, but the number of students in department A is more than those in departments B and C (Appendix A, record 2). In addition, green land area of department C is larger than the other two 42.
數據
+7
相關文件
• Non-vanishing Berry phase results from a non-analyticity in the electronic wave function as function of R.. • Non-vanishing Berry phase results from a non-analyticity in
The IEC endeavours to ensure that the information contained in this presentation is accurate as of the date of its presentation, but the information is provided on an
Reclamation Rock Cavern Development Reuse of Ex-quarry Sites Redevelopment.. Rezoning Land
To make a study of the challenge of special horizontal SCM and uncertain fuzzy partner relationship they’re facing, analyze the relative factors of supply chain partner affect
It finds the water-leaking factors for structures, and then discusses prevention methods and measures from design and constructional point of views.. It was found that
Randall,D.,te al,(1997),Water Supply Planning Simulation Model Using Mixed-Integer Linear Programming, Jouenal of Water Resources Planning and
Scaffolds are indispensable in construction projects, and human factors engineering discipline is discussing labor at work and their routine life, in which the
According to the study, the order of factors which affect the eutrophication of the Shinmen Reservoir are Secchi transparency, total phosphorous, Chlorophyll-a, water
