Using the Contingent Ranking Approach to Assess the Total Economic Valuation the of Arasbaran Forests in Iran
Maryam Haghjou, 1,4) Babollah Hayati, 2) Esmaeil Pishbahar, 2) Morteza Molaei 3)
【 Summary】
Forests are among the most important natural resources utilized for economic development in many developing countries, including Iran. The contribution of forest-derived products and services to social and economic development is irrefutable. Recent destruction and deforestation activities have led to loss of a large portion of forest-associated interests, thus motivating forest conservation actions. Covering an area of around 148,000 ha, the Arasbaran forests are located in the northernmost parts of East Azerbaijan and Ardabil Provinces of Iran. In addition to the preser- vation of economic, social, and cultural attractions, the Arasbaran forests provide unique treasures of environmental resources in northwestern Iran due to rare plant and animal species they host, as well as the intact and broad landscapes within them. The present study aimed to estimate the total economic value of the Arasbaran forests using a contingent ranking method. Required data were acquired through field studies and questionnaires filled out by 334 visitors and citizens from 10 cities in 3 provinces: East Azerbaijan, West Azerbaijan, and Ardabil. According to the valuation method used in this study, a ranked ordered logit regression model was applied. Results showed that information and refugium functions were the most, and the production function was the least valuable attributes of the forests with 71% and < 0.5% of contributions, respectively. In addi- tion, the regulatory functions and non-used values were other value components of the forests at 14.5 and 14% of contributions, respectively. Based on the results, respondents’ level of education, income, number of annual visits to the forests, and their friendly attitudes towards the Arasbaran forests had significant positive impacts on willingness to pay of respondents for the values of the forests. Results of the present study can serve as proper guidelines not only for policymaking and planning purposes, but also to attract public participation in the course of conservation and sustain- able use of the valuable resources.
Key words: Arasbaran forest, contingent ranking, ranked ordered logit, total economic valuation.
Haghjou M, Hayati B, Pishbahar E, Molaei M. 2016. Using the contingent ranking approach to as- sess the total economic valuation the of arasbaran forests in iran. Taiwan J For Sci 31(2):89- 104.
1)
Ph.D Candidate, Department. of Agricultural Economics, University of Tabriz, Tabriz, Iran.
2)
Associated Professors, Department. of Agricultural Economics, University of Tabriz, Tabriz, Iran.
3)
Assistant Professors, Department. of Agricultural Economics, University of Urmia, Urmia, Iran.
4)
Corresponding author, e-mail:maryam.haghjou@yahoo.com; Tel: +989144099326.
Received August 2015, Accepted October 2015. 2015年8月送審 2015年10月通過。
研究報告
利用隨機排序法評量伊朗阿拉斯巴倫森林 之加總經濟價值
Maryam Haghjou 1,4) Babollah Hayati 2) Esmaeil Pishbahar 2) Morteza Molaei 3)
摘 要
於包括伊朗在內許多開發中國家,森林是用作經濟發展的最重要資源之一。森林衍生的產物與 服務對社會與經濟的貢獻是無庸置疑的。近年的破壞與毀林活動已導致與森林有關利益的大幅流失,
因此促進了森林保育運動。位於伊朗東亞塞拜然省與亞達比爾省最北地區的阿拉斯巴倫森林覆蓋了 148,000公頃的面積。除了保存了經濟、社會與文化的吸引力,阿拉斯巴倫森林也提供伊朗西北部獨特 的環境資源寶庫,乃因其中棲息了多種稀有植物與動物物種;以及其間完整與多樣的地景。本研究旨 在利用隨機排序法來估算阿拉斯巴倫的總經濟價值。所需之數據係透過田野研究以及由來自東亞塞拜 然、西亞塞拜然與亞達比爾三個省之10個城市334位訪客與公民所填之問卷而建立者。跟據本研究所用 之評價方法,對數據實施了順序排比之邏輯回歸分析。結果顯示森林之資訊與庇護所功能為最重要價 值;而生產功能則是價值最低的特徵,分別佔了貢獻度的71%與< 0.5%。此外森林之調節功能與非利 用價值成分則分別貢獻了14.5與14%。基於這項結果,填卷者之教育程度、收入、每年往訪森林的次 數,以及其對阿拉斯巴倫森林的友善態度,對於填卷者願意為森林的價值付出,有顯著的正面影響。
本研究的結果不僅可作為政策制定與計畫之指導用途,也可作為吸引公眾參與珍貴資源保育與永續利 用的途徑。
關鍵詞:阿拉斯巴倫森林、隨機排序法、順序排列邏輯、總經濟價值。
Haghjou M, Hayati B, Pishbahar E, Molaei M。2016。利用隨機排序法評量伊朗阿拉斯巴倫森
林之加總經濟價值。台灣林業科學31(2):89-104。
INTRODUCTION
According to estimates presented by the World Bank, the net present value costs of damages caused by deforestation and degra- dation of forests in the Caspian Sea in Iran, which is the loss of benefits and functions of the forest in 2002, were about US$ 760×10
6and 147×10
6respectively, which was 0.8%
of Iran’s gross domestic product in that year (World Bank 2005).
There are various divisions of the eco- nomic value of natural resources such as for- ests. However, considering the characteristics
of the Arasbaran forests, the economic value of forests can be divided into 2 general cat- egories: a) use values and b) non-use values.
A) Use values are the means of 3 categories:
1. Direct consumption values consisting of production value (Such as firewood).
2. Indirect consumption values, which are information functions consisting of “rec- reation value,” “research and educational value,” “historical value,” and “esthetic value;” and
3. Non-consumption values consisting of “ref-
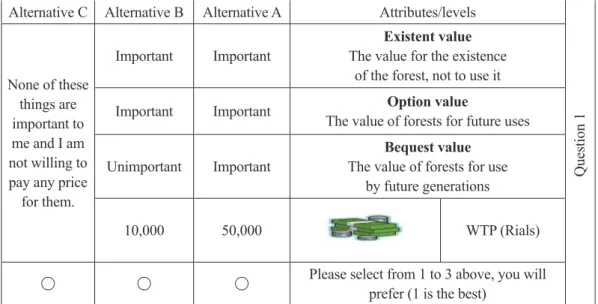
ugium function” (protection of animal spe- cies) and “regulation function” (regulation of gas, conservation of water and soil). B) Non-use values include the existence value (the value that a person gives to an environ- mental resource’s existence, even without using it), bequest value (the value of forest resources for future generations), and option value (the value which a person gives to an environmental resource for future possible usage of it) (Heal et al. 2005, Watson 2007, Pak et al. 2010, Pascual et al. 2010).
The total area of East Azerbaijan’s forests is about 188,000 ha in which about 164,000 ha of forest belongs to Arasbaran.
The area of 148,000 ha of this forest has been reported as conservational and protected for- ests. (Approximately 78,560 hectares-about 56% of the areas is specified as protected for- ests). With respect to Arasbaran’s specific cli- matic conditions, the existence of 1072 spe- cies of plants and 97 species of animals have reported in the area; therefore, it is supported as a reserve of the “Biosphere” by UNESCO since 1976 and is one of the 10 Biosphere reserves in Iran. Arasbaran with its beautiful nature, pleasant landscapes, historical monu- ments, and places of power has a powerful potential to attract tourists. Medicinal plants in the region with significant value, as one of the pillars of regional development may be of particular importance (Department of Natural Resources in East Azerbaijan 2003).
Unfortunately there are no organized manage- ment on un-protected areas in this region, and also since almost all of the precious animal and plant species are in protected areas, this study focused on protected Arasbaran forests.
Unfortunately, there is no organized man- agement of unprotected areas in this region.
However, almost all of the precious animal and plant species are found in protected areas at the same region. Therefore, the present
study focuses on protected Arasbaran fo- rests.
Due to the extensive use of wood for coal production in the past, the present situa- tion of the forests is delicate and fragile, and they are in the danger of destruction (Depart- ment of Natural Resources in East Azerbaijan 2003). Arasbaran forests are one of Iran’s natural treasures, are located in Iran’s North- west regions, and like other natural resources consist of non-use values.
Due to the importance of economic valu- ation of the environment, including-forests, many researchers have addressed this issue.
In some studies, contingent valuation methods have been applied to estimate the economic value of forests and other environmental ser- vices (Sattout et al. 2007, Khodaverdizadeh et al. 2008, Barala et al. 2008, Mollaei 2009, Pattison 2009, Jahanshahi and Mousavi 2011, Tao et al. 2012).
Some other researchers have used a choice experiment for environmental valu- ations (Meyerhoff et al. 2009, Taylor and Longo 2010, Wallmo and Lew 2011, Cerda et al. 2013, Salehnia 2011). In other studies, the contingent ranking approach was applied for economic valuation of the environment (such as Garrod and Willis 1997, Kumar and Kant 2007). In some studies, to assess the recre- ational value of environmental services, the travel cost method is used (such as: Hayati et al. 2011, Chae et al. 2012). Other studies used 2 valuation methods and tried to compare their results in valuation of the environment (like Sayyadi et al. 2005, Bateman et al. 2006, Mogas et al. 2009).
Results from the above-mentioned litera-
ture review indicate that despite the various
effects of variables in the studies, factors such
as demographic, economic, and social variables
associated with each studied resource’s charac-
teristics, besides the respondent’s environmental
attitudes, can influence a respondent’s will- ingness to pay (WTP) for different features of environmental resources.
Given that the non-productive functions are the most valuable functions of the Aras- baran forests, and one of the most important ways to protect and restore natural resources such as forests is assistance from public par- ticipation, motivating social orientation in order to protect this resource is critical. The emphasis of this study was estimations of non-use values (the option, existence, and bequest values) Moreover, values of infor- mation and refugium functions of the forest were estimated using the contingent ranking (CR) method, which seems to be compatible with the general behavior of a consumer which is based on ranking of preferences and choosing between them. Therefore, the rank-ordered logit model, which is also suit- able for the CR method and was introduced by Beggs et al. (1981) is applied in this study.
The overall purpose of this study was to estimate the total economic value of the Aras- baran forests which includes a) the production value; b) the value of information functions (research and educational, recreation, esthetic value and natural landscapes of the forest); c) regulatory functions; d) refugium value; and e) the non-use values (existent, option, and be- quest values) being the value of the heritage and values of the Arasbaran forests”.
MATERIALS AND METHODS Estimating the value of production and regulatory functions of the Arasbaran forests
To estimate the total economic value of environmental resources, including the Arasbaran forests, consideration-of the production and regulatory function is neces-
sary. In this respect, to calculate gas regula- tion, carbon and the oxygen produced by the Arasbaran forest were estimated. To estimate the value of water conservation in the forests, the value of penetrated water in the soil and the value of runoff of the forests were calculated. To estimate the value of soil conservation, the value of the Arasba- ran forests in reducing agricultural land use, in addition to decreasing sedimentation in reservoirs and maintaining soil fertility, was calculated.
Because of the conservation and protec- tive functions of the Arasbaran forests, fire- wood is the only product which can be cited as a production value of these forests. To cal- culate the value of production, a direct market valuation method or the market price method was used (Amirnejad et al. 2005).
Information and refugium values and non-use functions of the Arasbaran forests
The economic value as a valuable tool is connected to human utility maximization and is a human-oriented value. This means that it is based on people and their preferences. If there was a direct market for environmental goods and services, using normal pricing methods to value environmental services would be possible. However, the lack of a suitable market for many environmental func- tions makes usage of these methods almost impossible. Hence one of the best methods of estimating non-market service is the stated preference method.
Stated preference methods have been developed in recent decades. These methods attempt to directly measure people’s willing- ness to pay. The stated preference approach relies on data gathered through direct ques- tioning of respondents and their preferences.
The method consists of several valuation
techniques. The common feature of all these
techniques is direct questions of people about their possible choices in a hypothetical market. This approach includes the “contin- gent valuation method” (CVM) and “multi- valuation techniques,” such as “choice ex- periment” and “contingent ranking.” In the present study, the contingent ranking method was applied, since we assumed that ranking, instead of choosing, when a person is facing many features of a good, is more compat- ible with their normal manner. With this approach, a respondent was asked to rank his/her choices according to his preferences from the most important to the least impor- tant alternatives. For this reason, ranking data, can offer more information compared to the choice experiment (in which a respon- dent is asked to choose between different alternatives). However, this method is more complicated compared to other methods. The contingent ranking method can result in wel- fare-adapted estimations, provided that the status quo option is one of the alternatives in the choice series. In the case the respondent dis not interested in any of improvement alternatives, he/she can choose that one (Liu and Wirtz 2010).
The implicit price of each attribute is the final rate of substitution between non- monetary and monetary attributes, and it is calculated from the ratio of non-monetary factors to the monetary one:
Marginal WTP = − [ β non-monetary ] . β monetary (1)
The first and most important step in multiple valuation techniques, including contingent ranking, is designing the choice cards. To this end, the main attributes of the resource and the level of each attribute are identified; then the cards and henceforth the questionnaires are designed according to the characteristics of the test. In practice, attributes are selected from a review of
previous studies or interviews with expert groups (target group). It should be noted that the prices paid for the studied resources are one of the reviewed attributes, and through the monetary factor, it is possible to estimate the WPT for each attribute of the forest. Furthermore, levels of each attribute are identified through exploratory studies, literature reviews, and interviews with tar- get groups. The statistical design theory is used for level composition and formation of appropriate scenarios to present to respon- dents. A complete factorial design is one of the available options at this stage.
However, because of a large number
of compounds in this technique, alterna-
tive methods such as the “partial factorial
design” is used in which the number of pos-
sible combinations is greatly reduced. Table
1 shows the selected attributes in valuing
Arasbaran forests’ services. As can be seen,
the use functions of Arasbaran forests were
divided into 5 attributes with 3 levels. In this
regard, the 12 alternatives and 6 choice sets
were determined and were gathered in 2 trio-
blocks. SAS 9.2 software (SAS, Cary, NC,
USA) was used for designing the cards. Each
choice set included the relative improve-
ment and optimum environmental conditions
besides 1 status quo option. All levels have
special characteristics, which are designed
and presented to the respondents through
consulting with the Environment Agency’s
experts and their improvement plans for the
Arasbaran forests. For non-use values of the
Arasbaran forests, it was observed that the
existing option value and bequest value had
2 levels (important or not important), while
the bid price had 3 levels. In this regard, like
the previous one, through application of the
software, 6 alternatives and 3 choice sets
were obtained, which were presented in a
trio block.
According to what was mentioned above, the required data for non-market valuation in this study were gathered from a field study and through a questionnaire designed for this purpose. The sample, consisting of 335 respon- dents, was chosen from 10 cities of 3 states which are located within a radius of 225 km of the forests. The questionnaire was formed of 4 sections: 1) the respondent attitudes towards the Arasbaran forests, 2) the respondent de- mographic features (such as their income, age, etc.) 3) choice cards to estimate respondents WTP for use values of the Arasbaran forests (except from production and regulation func- tions the values of which were calculated from other methods that were explained above), and 4) choice cards to estimate non-use values of the forests. The sample cards and their expla- nations to estimate the use and non-use values are shown in Appendices A and B.
Ranked ordered logit model (exploded logit regression)
The exploded logit regression is used in much marketing research. This model, in fact, is the expanded conditional logit model of McFadden (1974) which was presented by Beggs et al. (1981) in the economic literature.
The model was developed by Hausman and Ruud (1987) and was entitled the Ranked ordered logit model. The basic techniques of this model are based on a random utility model (RUM) (Kumar and Kant 2007).
It is supposed that respondent i derives utility U
ijfor each forest value j, which in- cludes a systematic component, µ
ij, and a ran- dom component, ε
ij:
U
ij= μ
ij+ ε
ij(2)
Respondent i would rank the forest at- tribute j higher than forest value k, providing that. U
ij> U
iik. The error term, ε
ij, is supposed to be independent and identically distributed, and assumes that:
Prob ﴾ε
ij< t﴿ = exp {-exp﴾-t﴿} (3) Therefore the odds of ranking j higher that k can be explained through:
exp{U
ij- U
ik} (4)
The utility’s systematic component, U
ij, can be specified through a linear function of a set of explanatory variables, X
is, as below:
U
ij= β
jX
i; (5)
in which the X
ivector contains some vari- ables which describe respondents’ character- istics, yet they do not differ among various attributes of the forest. Also β represent the coefficients’ row vector which should be es- Table 1. Studied attributes and their levels in the Arasbaran forests
Bid price Recreation Educational Natural Refugium
(Rills) and tourism and research landscape and function Attributes value value esthetic value (protected species)
Information and Refugium functions of the Arasbaran forests
10,000 Crisis Crisis Crisis Crisis
30,000 improvement Relative improvement Relative improvement Relative improvement Relative levels
50,000 Optimum Optimum Optimum Optimum
Non-use value of the Arasbaran forests
10,000 Bequest value Option value Existence value Value
20,000 Important Important Important levels
30,000 Not Important Not Important Not Important
timated. The coefficients for those variables would differ among forest attributes; more- over, one of the β
jvectors needs to be set equal to 0 for the identification achievement (the selection of the reference forest attribute is arbitrary). The model is equivalent to the common multinomial logit regression model, although, the name “exploded logit” name is applied to indicate an observed rank ordering of J forest attributes and can be regarded as an “explosion” into J-1 independent observa- tions, in a way that if U
i1U
i2... U
ij, it can be expanded as: U
i1U
ij, j = 2,..., J, U
i2U
ij, j = 3,..., J,..., U
ij-1U
ij(Salomon 2003). Therefore, the data are considered to be a sequence of choices, in which the forest attribute or value with the highest preference is chosen over all other forest attributes, while the value of the second highest preference is picked over all but the first one, and this can be continued as above. This explosion is possible through the independence assump- tion from irrelevant alternatives (IIA) which is also known as Luce’s choice axiom, which indicates that the relative preference for any 2 forest attributes is indifferent to the choice set’s other features (Kumar and Kant 2007).
The random utility model connotes the fol- lowing likelihood Li for a single respondent as below:
L
i= (6)
in which σ
ijk= 1, if Y
ik> Y
iJ, and σ
ijk= 0, oth- erwise.
The statistical population of this study was 334 people, who were chosen randomly among visitors to the Arasbaran forests and also citizens of 10 neighboring cities (all were within a radius of 250 km of the forests), from 3 abutting provinces: West Azerbaijan, East Azerbaijan, and Ardabil.
It should be noted that the sample size was calculated using the formula introduced by Orme (1998).
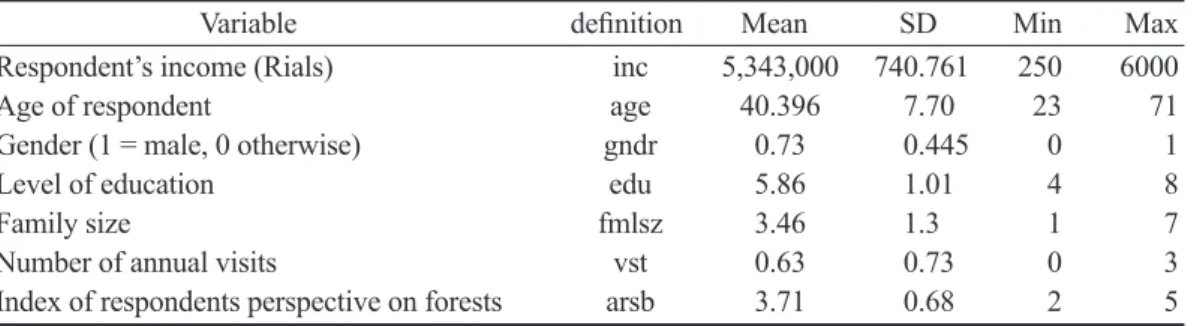
RESULTS AND DISCUSSION Statistical characteristics of the respon- dents are presented in Table 2. The mean of age variable represents a middle-aged popu- lation of respondents. The majority of study subjects were married men and individuals with small families. The mean of annual gross income indicates a normal income for the majority of respondents, which have less than 1 visit per year to the forests. The ars variable indicates individuals’ friendly attitude toward the Arasbaran forests. (index of friendly at- titude towards Arasbaran). The index con- sisted of 10 speeches to measure respondents’
friendly attitudes towards the forests, such as ignoring some utilities for safeguarding them.
Each speech was evaluated through codes from 5 (very important) to 1 (not important).
Mean of this variable indicates the relative importance of the Arasbaran forests from respondents’ point of view. Furthermore, the variable edu represents the educational level of respondents, which is an ordinal vari- able identified as: 1 = illiterate, 2 = primary School, 3 = junior high school, 4 = senior high school, 5 = associate diploma (AD), 6 = BSc, 7 = Msc, and 8 = PhD. The mean of this variable indicated that most respondents had an academic education level.
Result of estimating the information, refugium and non-use values of Arasba- ran forests
Table 3 shows the result of estimation of
the ranked ordered logit regression to deter-
mine the value of information and refugium
functions of the Arasbaran forests. The vari-
ables animed and aniwell show the relative
improvement and optimum conditions of animals that live in the forests, respectively.
Also the variables viemed and viewell indi- cate the relative improvement and optimum condition of the forests’ natural landscape and their esthetic values, respectively. Moreover, the variables edumed and eduwell show the relative improvement and optimum condi- tions of research and educational opportuni- ties of the forests, respectively. Finally the variables recmed and recwell indicate the relative improvement and optimum condition of recreation and tourism facilities in the for- ests, while the variable P, shows the bidding price.
To infer the effects of individual vari- ables that affected people’s WTP, the ranked ordered logit model with interactions of the bid price (p) with these factors was also estimated, and the results of estimations of both models are presented in Table 3. The variables pedu, pinc, pars, and pbaz show interactions of P with the respondent’s educa- tion level, income, friendly attitudes towards the Arasbaran forests, and number of annual visits to the forests, respectively.
According to results shown in the tables, the relative improvement and optimum condi- tion of each attribute had positive effects on respondents’ WTP, as expected. Furthermore, according to the interaction model results, respondents’ level of education, income,
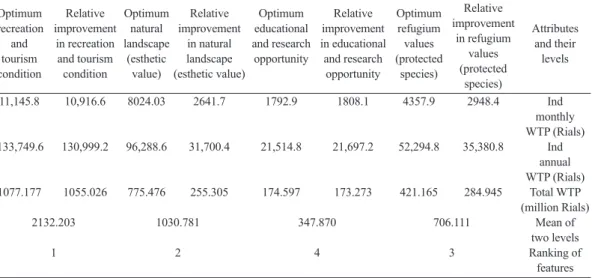
number of annual visits to the forests, and friendly attitudes towards the Arasbaran forests significantly increased the WTP of respondents for the forests’ attributes. Similar results from these variables’ positive effects on respondents’ WTP were presented in other studies such as: Sayadi et al. (2005), Bateman et al. (2006), Sattout et al. (2007), Mogas et al. (2009) and Tao et al. (2012). The monthly, annual and total (considering population of three studied provinces) WTP for each char- acteristic was calculated through equation (1), and results are presented in Table 4. As can be seen, the recreation and educational func- tions were the most and the least important features, respectively. The same ranking re- sults were obtained through the direct ranking question of the attributes which was asked of respondents in the questionnaire.
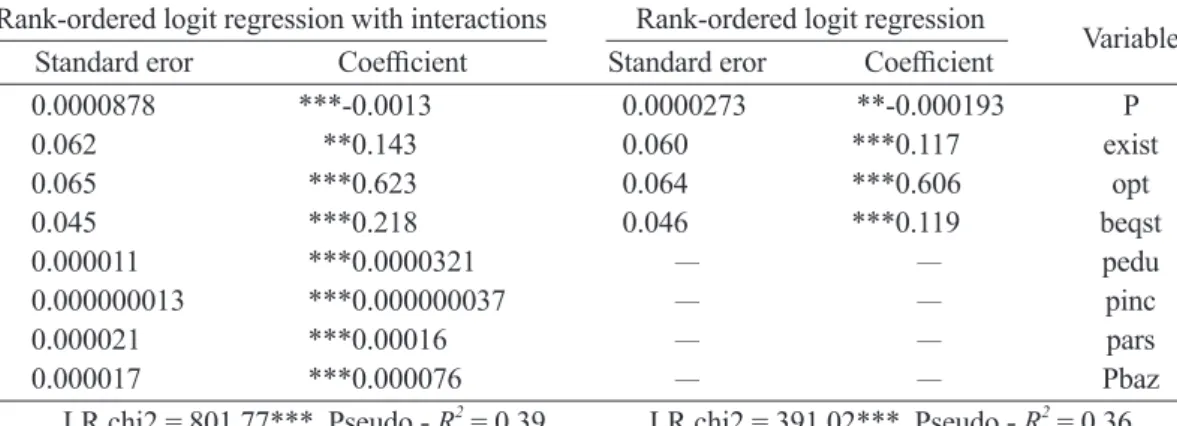
Table 5 shows the result of the estimation of the ranked ordered logit regression of non- use values of the Arasbaran forests. The vari- ables exist, opt and beqst show the importance of the existence value, option value and be- quest value to respondents, respectively. Fur- thermore, the variable, P shows the bid price.
To infer the effects of individual vari- ables that influence people’s WTP, the ranked ordered logit model with interactions of the bid price (p) with these factors was also es- timated. Results of the estimations of both models are presented in Table 5.
Table 2. Variable definition and sample statistics
Variable definition Mean SD Min Max
Respondent’s income (Rials) inc 5,343,000 740.761 250 6000
Age of respondent age 40.396 7.70 23 71
Gender (1 = male, 0 otherwise) gndr 0.73 0.445 0 1
Level of education edu 5.86 1.01 4 8
Family size fmlsz 3.46 1.3 1 7
Number of annual visits vst 0.63 0.73 0 3
Index of respondents perspective on forests arsb 3.71 0.68 2 5
In 2015 the average exchange rate was US$ 1.00 ≈ 32,000 Rials.
Table 4. Results of the willingness to pay extracting and ranking of information and refugium features
Optimum Relative Optimum Relative Optimum Relative Optimum Relative
recreation improvement natural improvement educational improvement refugium improvement Attributes and in recreation landscape in natural and research in educational values in refugium and their tourism and tourism (esthetic landscape opportunity and research (protected values levels condition condition value) (esthetic value) opportunity species) (protected
species)
11,145.8 10,916.6 8024.03 2641.7 1792.9 1808.1 4357.9 2948.4 Ind
monthly
WTP (Rials)
133,749.6 130,999.2 96,288.6 31,700.4 21,514.8 21,697.2 52,294.8 35,380.8 Ind
annual
WTP (Rials)
1077.177 1055.026 775.476 255.305 174.597 173.273 421.165 284.945 Total WTP
(million Rials)
2132.203 1030.781 347.870 706.111 Mean of two levels
1 2 4 3 Ranking of
features
According to the results, the impor- tance of each attribute had a positive effect on respondents’ WTP, as expected. More- over, based on the interaction model results, respondents’ level of education, income, number of annual visits to the forests and
their friendly attitudes towards the Arasbaran forests had positive effects on the WTP of respondents for the forests’ non-use values.
Using equation (1), the monthly, annual, and total WTP levels for each value were calcu- lated, and results are presented in Table 6.
Table 3. Estimation result of the rank-ordered logit model about information and refugium functions of the Arasbaran forests
Rank-ordered logit regression with interactions Rank-ordered logit regression Variable Standard eror Coefficient Standard eror Coefficient
0.0000609 ***-0.000483 0.0000237 -0.0000346 P
0.0361 ***0.141 0.036 ***0.0260 Animed
0.047 ***0.210 0.047 ***0.0392 Aniwell
0.066 **0.126 0.067 ***0.215 Viemed
0.034 ***0.385 0.033 ***0.560 Viewell
0.049 **0.086 0.038 ***0.116 Edumed
0.037 *0.087 0.050 ***0.182 Eduwell
0.067 ***0.524 0.049 ***80.847 Recmed
0.044 ***0.535 0.068 ***0.916 Recwell
0.0000083 ***0.000016 — — Pedu
0.0000000096 ***0.000000027 — — Pinc
0.0000148 ***0.000083 — — Pars
0.0000132 ***0.000053 — — Pbaz
LR chi2 = 728.11, Pseudo - R
2= 0.38 LR chi2 = 628.63, Pseudo - R
2= 0.40
*** p < 0.01, ** p < 0.05, * p < 0.1.
As presented in the table, the option and existence values were the most and the least important values, respectively. The same ranking results were obtained through the direct ranking question of the attributes which was asked of respondents in the ques- tionnaire. According to the conditions of the region (which are unsuitable for public trans- portation and comfortable visits), the impor- tance of the option value was expected.
Calculation results of the value of regu- lation and production functions of the Arasbaran forests
To determine the value of gas regulation, first the physical amount of carbon absorption and oxygen production through the photosyn- thesis formula were calculated as 18,778.64 and 83,078.04 tons, respectively. Multiplying
these moduli with the related price of each one, the value of each function was obtained about 138.207×10
9Rials (US$ 4.5×10
6for CO
2absorption and 140.9×10
9Rials (about US$ 4.8×10
6for oxygen production and fi- nally 279.107×10
9Rials (US$ 9.3×10
6for the total value of gas regulation of Arasbaran forests.
Applying hydraulic precipitation equa- tions to the forest, values of water preserva- tion in the soil and runoff regulated by the forests were estimated to be about 254.74 and 198.34×10
6m
3, respectively. The price of underground water in the Arasbaran re- gion (1300 Rials/m
3) was used to present the value of penetrated water in the soil, and the cost of reserving each cubic meter of water behind a dam (1100 Rials/m
3) was chosen as the value of runoff regulation. As a re- Table 6. Results of the willingness to pay extracting and ranking of non-use values
İmportance of İmportance of İmportence of Values
bequest value option value existent value
1914.79 5477.40 1262.55 Ind. monthly WTP (Rials)
22,977.48 65,728.89 15,150.6 Ind. annual WTP (Rials)
185.05 529.35 122.01 Total WTP (million Rials)
2 1 3 Ranking of values
In 2015 the average exchange rate was US$ 1.00 ≈ 32,000 Rials.
Table 5. Estimation result of rank-ordered logit model non-use values of the Arasbaran forests Rank-ordered logit regression with interactions Rank-ordered logit regression Variable Standard eror Coefficient Standard eror Coefficient
0.0000878 ***-0.0013 0.0000273 **-0.000193 P
0.062 **0.143 0.060 ***0.117 exist
0.065 ***0.623 0.064 ***0.606 opt
0.045 ***0.218 0.046 ***0.119 beqst
0.000011 ***0.0000321 — — pedu
0.000000013 ***0.000000037 — — pinc
0.000021 ***0.00016 — — pars
0.000017 ***0.000076 — — Pbaz
LR chi2 = 801.77***, Pseudo - R
2= 0.39 LR chi2 = 391.02***, Pseudo - R
2= 0.36
*** p < 0.01, ** p < 0.05, * p < 0.1.
sult, the value of penetrated water in the soil was about 331.16×10
9Rials (about US$
10.34×10
6), the value of runoff regulation achieved about 218.17×10
9Rials (about US$ 6.8×10
6, and finally the value of total water preservation through the forests was calculated about 549.33×10
9Rials (about US$ 17.14×10
6).
To estimate the value of soil preservation in the Arasbaran forests as a decrease in non- usage of agricultural lands, the reduction in sedimentation of reservoirs and maintaining the soil fertility by the forests were calculat- ed. The physical estimation of these activities was done based on a fact that the difference in erosion in forest and non-forest regions shows the soil conservation value of the forests.
Finally, the values of the forests’ impact on non-usage of agricultural lands, reduction in sedimentation of reservoirs, and maintaining the soil fertility were calculated to be about 23.48, 0.153×10
9and 0.0230×10
9Rials,
respectively, and the total value of soil pres- ervation by the Arasbaran forests was about 23.647×10
9Rials (about US$ 0.8×10
6).
In order to calculate the value of timber products in the optimum sustainable utiliza- tion condition (noting that these forests are protected and there is no real wood extraction from them), the equivalent prices of timber of other forests were used, which indicated that the potential value of wood products of these forests was about 24.111×10
9Rials (about US$ 0.8×10
6).
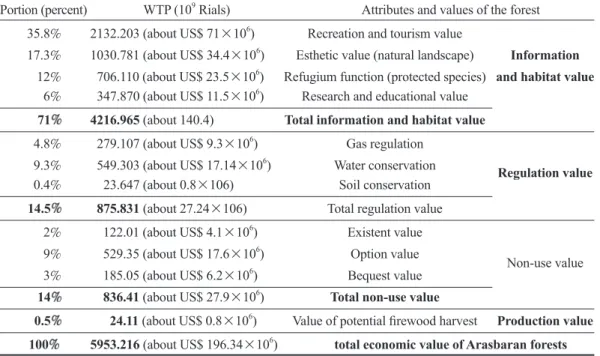
Table 7 shows the estimation result of the total economic valuation of the Arasbaran forests. As can be seen, the information and refugium functions at 71% and the produc- tion value at 0.5% were the most and least valuable attributes of the forests, respectively.
This issue shows the great importance of environmental valuation, especially forest valuation, since in the case of sole production value of forests being considered in the GNP,
Table 7. Estimation of total economic value of Arasbaran forests
Portion (percent) WTP (10
9Rials) Attributes and values of the forest 35.8% 2132.203 (about US$ 71×10
6) Recreation and tourism value
17.3% 1030.781 (about US$ 34.4×10
6) Esthetic value (natural landscape)
Information12% 706.110 (about US$ 23.5×10
6) Refugium function (protected species)
and habitat value6% 347.870 (about US$ 11.5×10
6) Research and educational value
71 4216.965 (about 140.4) Total information and habitat value4.8% 279.107 (about US$ 9.3×10
6) Gas regulation
9.3% 549.303 (about US$ 17.14×10
6) Water conservation
Regulation value0.4% 23.647 (about 0.8×10⁶) Soil conservation
14.5 875.831 (about 27.24×10⁶)
Total regulation value 2% 122.01 (about US$ 4.1×10
6) Existent value
9% 529.35 (about US$ 17.6×10
6) Option value Non-use value 3% 185.05 (about US$ 6.2×10
6) Bequest value
14 836.41 (about US$ 27.9×10⁶
)
Total non-use value0.5 24.11 (about US$ 0.8×10⁶