國立臺灣大學電機資訊學院資訊工程學研究所 博士論文
Graduate Institute of Computer Science and Information Engineering College of Electrical Engineering and Computer Science
National Taiwan University Doctoral Dissertation
意在言外?微文本中情緒、合法性與反諷之辨識與分析 Beyond Literal Meanings: Recognition and Analysis
of Emotions, Legality and Irony in Microtexts
唐宜傑 Yi-jie Tang
指導教授:陳信希 博士 Advisor: Hsin-Hsi Chen, Ph.D.
中華民國 104 年 6 月
June 2015
i
誌謝
本論文得以順利完成,要特別感謝指導教授陳信希老師。由於他的指導,使我 能從語言學領域轉換到截然不同的資訊工程學研究環境,並得以將研究成果發表在 數個與自然語言處理相關的國際性研討會上,最後還能完成這份博士論文,這些都 是我在進入資訊所之前所無法想像的。
本論文承蒙陳光華老師、鄭壬壬老師、古倫維老師、張嘉惠老師在實驗設計和 演算法方面給予指教,而宋麗梅老師與蘇以文老師也在語言學方面給予指正和提 醒。他們確實使我發現自己的不足之處,在此也向他們表達感謝。
另外也要謝謝實驗室碩士班同學李長曄,他收集的微網誌語料庫對於論文的各 項實驗提供了不少助益。
摘要
傳統自然語言處理所偵測和辨識的目標,多是可與表面形式直接連結的元素,
然而語言中亦存在著非字面或非詞彙的層面,這些現象並無法直接由字面解析的方 式來了解。而在微文本(microtext)中,由於文字篇幅受到限制,因此這些方面的 分析變得更加困難。不論在情感分析、意見探勘、問答系統、或對話系統等應用中,
這些問題皆可能而造成障礙。在本研究中,我們探討線上溝通中三個超越字面層面 的現象:情緒、合法性、反諷,並以微網誌平台上的訊息和政府公布的短語為語料 來進行偵測演算法研究和相關語言分析。
在微網誌的情緒研究方面,我們採用微網誌作者常用的圖形化表情符號為情緒 標記,來建立正面情緒和反面情緒微網誌資料集。情緒的偵測採用分類演算法進行,
除了文字特徵之外,還加入社交關係、使用者行為、相關度等因素作為特徵。研究 發現,若適當搭配文字特徵和特定非文字特徵,可達到最佳偵測結果。此外,我們 也探討貼文者與回應者之間的情緒轉換,並就詞頻、語意、情感等方面來比較微網 誌文字內容和線上長篇文章間的差異。
隨著近來線上行銷活動持續成長,大量與行銷相關的微文本內容亦在線上產 生。這些文本可能包含不應讓使用者列入參考的不當資訊,但這種誤導性質經常無 法簡單地從訊息本身看出。不論對於網站讀者、廣告主、廣告服務商和政府管理單 位來說,如何辨識這些不當行銷資訊,都已成為一項重要的課題。本研究以政府公 布的違規廣告敍述和購物網站商品描述作為非法與合法廣告資料集,透過單一分類 和二元分類演算法進行合法性預測,並以單詞組、同義詞典、政府規範內容和相對 頻率比率對數等特徵進行實驗。結果發現結合單詞組和相對頻率比率對數作為特 徵,可得到最佳的結果。相對頻率比率對數也用於對非法廣告資料集進行動詞組的 探勘,這些動詞組皆由動詞與受詞組成,所形成的非法廣告用詞表可讓廣告主和政 府單位作為辨識廣告合法性的參考依據。此外,本研究也實作一套不當線上廣告辨 識系統,希望能為相關機構和使用者提供自動辨識機制,以節省人力並減少此類不
iii
當行銷活動所帶來的危害。
反諷是一種少見但具有強烈效果的表達方式。英語的 verbal irony 一詞可指字 面語意和真實語意相反或有程度差異的表達方式。本研究將焦點集中在以正面字面 語意來表達負面實際語意的短語,並以微網誌作為語料,進行以下研究:(1) 中文反 諷語料庫的建構 (2) 反諷語言結構的探討 (3) 反諷線索的歸納 (4) 反諷成分的辨 識。
為了儘可能找到足夠的反諷文字型式,本研究以表情符號作為情緒極性標記,
並以 NTUSD 意見詞典和微網誌正負面情緒詞典作為情緒判斷依據,透過反復式自 助法(bootstrapping)來尋找反諷訊息,也就是先觀察特定反諷文字形式,接著以 此形式為基礎透過半自動方法找出微網誌語料中的反諷訊息,再以其中新發現的反 諷文字形式重複進行原步驟,直到無法發現新形式為止。以此方法,我們成功地建 立了第一個中文反諷語料庫。在反諷訊息辨識上,則採用條件隨機域(CRF)作為 演算法,並以中文詞以及其詞類標記作為特徵來進行。此辨識方法可以減少前述方 法中人工介入的程度。在對反諷結構進行分析後,我們認為有三項成分構成反諷文 字:(1) 反語 (2) 情境資訊 (3) 修辭成分。這些成分亦明確標示在我們的反諷語料 庫中。
ABSTRACT
The non-literal or non-lexical aspects of communication cannot be interpreted directly and literally. The identification and analysis of real intent beyond literal meanings is a challenging task in natural language processing, especially when working on microtexts such as microblogs that are limited to 140 characters. The recognition and analysis of these components are crucial for many applications including sentiment analysis, opinion mining, question answering and chatterbots. In this study, emotion recognition, online advertising legality identification and verbal irony analysis are examined.
In the emotion recognition experiments, the generation of user emotions on a microblogging platform is modeled from both writers’ and readers’ perspectives.
Graphic emoticons, which are commonly used to express users’ emotions, serve as emotion labels so that microtext emotion datasets can be constructed. To build classifiers for the emotion identification task, support vector machine (SVM)-based algorithms are adopted. In addition to textual features, non-verbal factors, including social relation, user behavior and relevance degree, are also used as features. The experimental results show that the combination of textual, social and behavioral features can be used to achieve the best emotion-prediction performance. The emotional transitions from the poster to the responder in a conversation are also analyzed and predicted in this study.
As online advertising continues to grow, Internet users, advertisers, online advertising platforms and the authorities all have the need to avoid or prevent the issues that false and/or misleading advertisements can potentially cause. Many of these false
v
advertising messages are present in short texts, and their appropriateness cannot be easily interpreted. This problem is addressed by building one-class and two-class classifiers with datasets consisting of short illegal advertising statements published by the government and product descriptions from an online shopping website. The results show that the models using the log relative frequency ratio (logRF) combined with unigrams as features achieve the best performance. The logRF values are also used to mine verb phrases that are typically used in illegal advertisements. These verb phrases can be used as a reference for both the advertisers and the authorities. A web-based false advertisement recognition system was also built in this study using the techniques applied to the above experiments in order to reduce human effort in filtering false advertising messages and help protect Internet users from misleading advertising.
In verbal irony, the literal meaning of an utterance can be the opposite of what is actually meant. For simplification, this study focuses on ironic expressions in which negative actual meanings are represented by positive words. Ironic messages in microblogs are infrequent and cannot be identified by simply examining the literal meanings of the words. To construct a Chinese irony corpus, ironic messages are collected from microblogs based on emoticon use, linguistic forms and sentiment polarity through a bootstrapping approach. Five types of irony patterns are found in the collected ironic messages. The structure of ironic expressions is also analyzed, and three types of elements are found to form an ironic expression. A conditional random field (CRF)-based approach is used to automatically identify irony elements and ironic messages and reduce the human effort in the bootstrapping approach of irony pattern discovery.
TABLE OF CONTENTS
誌謝 ... i
摘要 ... ii
ABSTRACT ... iv
TABLE OF CONTENTS ... vi
LIST OF FIGURES ... x
LIST OF TABLES ... xii
Chapter 1 Introduction ... 1
Chapter 2 Real Intent in Microtexts ... 4
2.1 What Is a Microtext? ... 4
2.2 Microblogging Platforms ... 6
2.2.1 Microtexts on Twitter ... 6
2.2.2 Microtexts on Plurk ... 6
2.3 Intent Hidden in Microtexts ... 7
2.3.1 Emotions ... 8
2.3.2 Adverting Legality ... 10
2.3.3 Irony ... 11
Chapter 3 Emotions in Microblogs ... 13
3.1 Dataset ... 14
3.1.1 Emoticons on Plurk ... 14
3.1.2 The Plurk Dataset ... 15
3.2 Reader/Writer Perspective ... 16
vii
3.2.1 Reader Perspective ... 17
3.2.2 Writer Perspective ... 17
3.2.3 Reader and Writer Perspective ... 18
3.3 Emotion Modeling ... 18
3.3.1 Text Features (T) ... 18
3.3.2 Social Relation (S) ... 19
3.3.3 User Behavior (B) ... 20
3.3.4 Relevance Degree (R) ... 21
3.3.5 Normalization ... 21
3.4 Results ... 22
3.4.1 Text Features (T) ... 22
3.4.2 Combination of Feature Sets ... 23
3.4.3 Different Perspectives ... 25
3.4.4 Writer Model ... 26
3.5 Writer-Reader Emotion Transition ... 26
3.5.1 Sentiment Word Mining ... 27
3.5.2 Analysis of Mined Words ... 30
3.5.3 Writer-Reader Emotion Prediction ... 31
3.6 Microtexts Compared to Regular Texts ... 33
3.6.1 Microblog Corpus vs. Balanced Corpus ... 34
3.6.2 Analysis of Lexical Semantics ... 34
3.6.3 Literal Text vs. Spoken Language ... 40
3.6.4 Analysis of Sentiment Polarity ... 40
Chapter 4 Advertising Legality ... 43
4.1 Illegal Advertising ... 43
4.2 Datasets ... 45
4.3 Recognition Models ... 46
4.3.1 One-Class Classifiers ... 47
4.3.2 Binary Classifiers ... 48
4.4 Overstated Verb Phrase Mining ... 54
4.5 Building False Advertising Recognition System ... 56
4.5.1 Pre-processing Module ... 56
4.5.2 Recognition Module ... 57
4.5.3 Explanation Module ... 58
4.5.4 User Interface ... 58
Chapter 5 Verbal Irony ... 61
5.1 Irony and Sarcasm ... 61
5.2 Irony Corpus Construction ... 64
5.2.1 Finding Irony from an Emotion-Tagged Corpus ... 64
5.2.2 Candidates Extraction ... 66
5.2.3 Pattern Mining ... 66
5.3 Irony Patterns ... 68
5.3.1 Degree Adverbs + Positive Adjective ... 68
5.3.2 The Use of Positive Adjective with High Intensity ... 69
5.3.3 The Use of Positive Noun with High Intensity ... 70
5.3.4 The Use of 很好 (very good) ... 70
5.3.5 可以再...一點 (“It’s okay for someone/something to be worse”) ... 71
5.4 Linguistic Structure of Irony ... 72
5.4.1 Ironic Word/Phrase ... 72
5.4.2 Contextual Information ... 73
ix
5.4.3 Rhetoric ... 75
5.4.4 Corpus Labeling ... 75
5.5 Clues to Irony ... 76
5.6 Irony Recognition ... 82
5.6.1 CRF-based Algorithms ... 82
5.6.2 Irony Element Identification ... 83
5.6.3 Ironic Message Identification ... 85
Chapter 6 Conclusion ... 88
REFERENCE ... 91
LIST OF FIGURES
Figure 2.1 A conversation on Plurk ... 6
Figure 3.1 Emoticons as positive and negative labels ... 14
Figure 3.2 Different emotion generation models on Plurk ... 16
Figure 3.3 Category distribution of emotion words ... 31
Figure 3.4 Sense distribution in terms of 12 large categories of thetop 100 words ... 38
Figure 3.5 Sense distribution in terms of 12 large categories of the top 3,000 words ... 39
Figure 3.6 Sense distribution in terms of 94 middle categories of the top 3,000 words ... 39
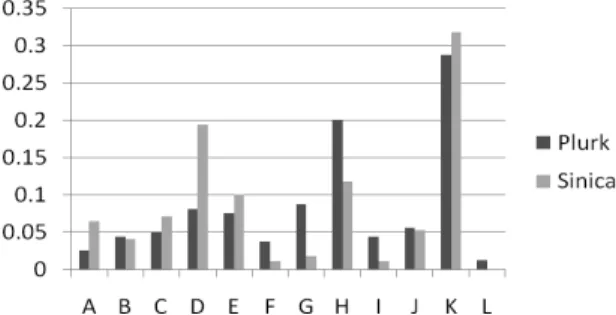
Figure 3.7 Ratio of sentiment words in top n high-frequency words in the Plurk and Sinica corpora ... 41
Figure 3.8 Ratio of sentiment words in top n high-frequency words in the Plurk corpus ... 42
Figure 3.9 Ratio of sentiment words in top n high-frequency words in Sinica Corpus ... 42
Figure 4.1 Illegal food advertising statements from an advertisement provided by the government and their English translations ... 44
Figure 4.2 System architecture of FAdR ... 57
Figure 4.3 An illegal advertisement example ... 59
Figure 4.4 Screenshot of the FAdR recognition results ... 60
xi
Figure 5.1 The bootstrapping procedure. ... 64 Figure 5.2 An example message with ironic element tags ... 76 Figure 5.3 Feature template used in CRF++ ... 84
LIST OF TABLES
Table 3.1 Accuracies of different feture sets ... 22
Table 3.2 Accuracies of models with different feature combinations ... 24
Table 3.3 Similarity among emotion transition datasets ... 27
Table 3.4 Accuracies of emotion prediction ... 33
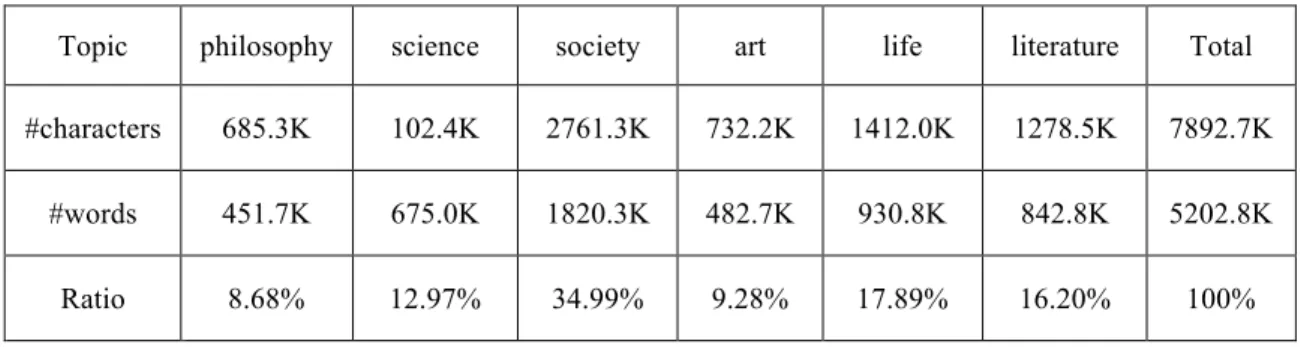
Table 3.5 Topic statistics of Sinica 3.0 Corpus ... 34
Table 3.6 Taxonomy of Cilin ... 36
Table 3.7 List of top 10 high logRFPlurk-Sinica words and top 10 high logRFSinica-Plurk words ... 38
Table 3.8 Distribution of sentiment words in NTUSD sentiment dictionary ... 41
Table 4.1 Accuracies of classifiers in different rejection rates ... 47
Table 4.2 Accuracies of advertising legality recognition models ... 49
Table 4.3 Illegal advertising statement examples announced by the government ... 49
Table 4.4 Individual accuracies of illegal and legal advertising recognition on food dataset ... 54
Table 4.5 Individual accuracies of illegal and legal advertising recognition on cosmetic dataset ... 54
Table 4.6 Example illegal verb phrases mined from the FOOD and COS datasets ... 55
Table 5.1 Likelihoods of irony for random 1,000 messages with specific patterns ... 78
Table 5.2 Experimental results of irony element identification ... 85
Chapter 1 Introduction
Literal communication refers to the conveyance of ideas, sentiments and intentions through devices that express the original or usual sense of words. The research of non-literal or non-lexical expression identification has drawn researchers’ attention in recent years. Katz and Giesbrecht (2006) used meaning vectors for literal and non-literal expression classification. Some previous work (e.g., Sporleder and Li, 2009) explored non-literal communications by focusing on the interpretation and recognition of idioms.
Jimenez, Becerra and Gelbukh (2013) introduced a system to discriminate between literal and figurative usage of phrases. In this study, the analysis and identification of three aspects of online communication are explored beyond literal meanings: emotion, advertising legality and verbal irony.
Traditional tasks in natural language processing (NLP) include word segmentation, word sense disambiguation, grammatical structure parsing, POS tagging, machine translation, named entity recognition, etc. Most of them are performed on traditional long texts and are based on the assumption that linguistic information can be retrieved from literal meanings. The data sources of traditional texts include books, news articles, journal articles, and classical literature. Such texts consist mainly of grammatically well-structured sentences and contain few “errors.” In the case of any ungrammatical sentences, typos and misprints, they are usually considered noise and thus are finally ignored in NLP tasks.
In recent years, many studies have turned their attention to more challenging tasks such as opinion mining and sentiment analysis. With the emergence of a large number of contents generated by average Internet users, newer and more informal language uses have been taken into account.
To perform the identification and analysis tasks in this study, microtexts, a newly emerging category of texts, are used. The objects of microtext analysis include instant messages, Short Message Service (SMS) messages, microblog postings and other short texts. The characteristics of a microtext, suggested by Ellen (2011), include the following:
(1) Individual author contributions are very brief and almost always less than a paragraph.
(2) The grammar used by the authors is generally informal.
(3) The text is “semi-structured” by traditional NLP definitions.
The datasets used in this study were collected from a microblogging platform and short advertising statements made public by the government. As can be seen in this study, the properties specific to microtexts make the processing of non-literal and non-lexical communications in these datasets challenging.
Emotions have only an indirect link to lexical senses. The recognition of emotions expressed in microblogs must not only deal with literal meanings of words but also take non-lexical factors such as social relation and user behavior into account. In Chapter 3, emotion-modeling approaches are proposed from both writers’ and readers’
perspectives. The disagreement between the emotions of the writer and the reader is also analyzed. In addition, the differences between microblogs and regular online articles are studied in terms of sentiment, word frequency and semantics.
Online advertising is an important way of delivering promotional messages today.
Misleading and overstated advertisements are serious issues for Internet users, advertisers and the authorities. In Chapter 4, online advertising legality identification
models using textual and the log relative frequency ratio as features are proposed. A web-based system for false online advertisement recognition was also constructed.
Recognizing irony is one of the most challenging issues in natural language processing. In some previous research (e.g., Davidov, 2010; Filatova, 2012), the identification of sarcasm was studied, but a clear definition of “sarcasm” was not included. In Chapter 5, we deal with only ironic expressions in which the literal meaning is the opposite of the actual meaning. A bootstrapping approach is proposed to construct a Chinese irony corpus and to discover irony patterns. The elements of irony and the clues to irony are also analyzed. Finally, a conditional random field (CRF)-based algorithm is used to detect irony elements and ironic messages in order to improve the bootstrapping procedure.
Chapter 2 Real Intent in Microtexts
Microtexts are relatively short and provide less information than traditional articles, making NLP tasks performed on these short texts challenging. Discovering actual intent in microtexts beyond their literal meanings is even more difficult. In this chapter, the concept of microtext is introduced. The scopes of the three main topics—emotion modeling, advertising legality identification, and irony analysis, as well as related work—are covered.
2.1 What Is a Microtext?
In recent years, a large number of short texts have been generated by users on instant messaging platforms, online social media platforms and mobile devices. These texts, which have been referred to as microtexts in some studies (Ellen, 2011), are relatively short and informal compared to news, blog posts and other online articles.
Ellen (2011) proposed a working definition of “microtext” as follows.
(1) Individual author contributions are very brief, consisting of as little as a single word, and almost always less than a paragraph. Frequently the contribution is a single sentence or less.
(2) The grammar used by the authors is generally informal and unstructured, relative to the pertinent domain. Errors and abbreviations are more common.
(3) The text is “semi-structured” by traditional NLP definitions since it contains some meta-data in proportion to some free-text. At a minimum, all microtext has a minute-level timestamp and a source attribution (author).
A microtext may be an SMS message, instant message, chatroom message, voicemail transcription, microblog post, blog comment, or query used for an intelligent personal assistant on a smartphone. In the PTT bulletin board system (telnet://ptt.cc), a popular online forum in Taiwan, a large number of positive comments (推) and negative comments (噓) are also posted every day. Every PTT comment is limited to 55 characters, and thus makes another form of microtext.
Based on our observation, the characteristics of microtexts compared to those of traditional long texts are described below.
(1) Fewer words or characters are used. Occasionally, only non-textual elements, such as emoticons and URLs, are present.
(2) Informal words, phrases, symbols and grammar are frequently used. Typos, errors, abbreviations, slang and jargon are common.
(3) Components of a formal article structure, such as the title, subtitle, introduction and conclusion, are generally missing.
(4) No traditional tags can be added, but hashtags can be added anywhere within a short text.
(5) A microtext can be part of a conversation. In this case, the contextual information can usually be obtained.
Since traditional techniques of natural language processing for long texts do not translate well to microtext (Ellen, 2011), new algorithms must be developed for microtext in order to increase the performance of NLP and data mining tasks.
2.2 Microblogging Platforms
2.2.1 Microtexts on Twitter
As of March 31, 2015, the Twitter microblogging platform had more than 302 million active users.1 Short messages sent on Twitter, or “tweets,” can never exceed the 140-character limit. This is why Twitter has soon become a critical resource of short text analysis since its launch in 2006. Due to the characteristics of microtexts described in Section 2.1, performing common NLP tasks on Twitter has been regarded as a challenge. According to Kaufmann (2010), the performance of the named entity recognition task in tweets was “extremely poor.” Dent and Paul (2011) also found question detection within Twitter to be a major challenge. The traditional part-of-speech tagging algorithms were also found to perform poorly, with error rates up to 10 times higher than those on the newswire (Derczynski et al., 2013).
2.2.2 Microtexts on Plurk
In addition to Twitter, Plurk has once become one of the largest online social networks in Taiwan and in a few other countries. Messages on Plurk are also limited to 140 characters. From this viewpoint, Plurk is similar to Twitter and other microblogging platforms. Unlike Twitter, however, Plurk also acts like an instant messaging system
1 https://about.twitter.com/company
My new iPod ☺
Loves
Thinks Awesome!☺
Good for you! ☺
Says
Says Can’t afford it
Post
Qualifier
Poster
User1 User2 User3 Reply
Emoticon
Figure 2.1 A conversation on Plurk
because a user can send messages to specific users and see replies as soon as they respond. A post and its replies are grouped within a box on the screen, indicating that they are messages from the same conversation. Every post can be given one of the 18 optional “qualifiers,” which are one-word verbs indicating the poster’s action or feelings: loves, likes, shares, gives, hates, wants, wishes, needs, will, hopes, asks, has, was, wonders, feels, thinks, says, and is.
Figure 2.1 shows a typical conversation on Plurk. In this conversation, the first line was entered by a poster. He chose "loves" as the qualifier, stating that he "loves the iPod." The following messages were entered by other users as replies to the poster.
Their messages are followed by graphic emoticons that express their emotions.
In this study, the Plurk Corpus (Lee, 2010), which contains 20,265,405 Traditional Chinese posts generated from April 1 to October 31, 2009, is used for microtext processing.
2.3 Intent Hidden in Microtexts
The objective of the study is to identify and analyze several types of intent that are hidden or “disguised” in short texts and therefore cannot be accessed directly by analyzing the literal meanings or senses.
Although the emotions behind a short text can usually be linked to the literal meanings of the words that make up the text, the actual emotions to be expressed by the author can be affected by specific conditions and contexts present in a conversation.
This can be one of the reasons authors choose to use emoticons in their microblog posts in additional to textual expressions. In this case, non-verbal and/or non-literal information needs to be obtained in order to identify the actual emotions.
Online advertising in violation of regulations provides false or misleading
information. The advertiser’s intent may be to use information that is unreliable or should not consulted by customers to influence their purchase decisions. The recognition of the appropriateness of such advertisements should be explored beyond the literal meanings.
Irony is another phenomenon that does not exhibit real intent in the surface form of an utterance. Irony should be precisely identified in order to correctly obtain the actual meanings behind an expression. If an ironic expression is incorrectly treated as a regular expression, the literal meaning, which is opposite to the author’s real intent, will be retrieved, causing a serious problem for any natural language understanding tasks and semantic analysis.
2.3.1 Emotions
Interactions between emotion and language occur in many aspects of communication. In spoken language, the speaker’s emotions can be revealed in lexical levels as well as non-lexical levels such as phonetic features, gestures and facial expressions. In written texts, especially microtexts, emotions may not be able to be decoded by solely examining the verbal form, and the features and factors beyond literal meanings thus need to be taken into account for emotion detection. For example, the following two messages posted by two different Plurk users exhibit totally different emotions, while the same words are used:
(1) 該睡了 :-) 晚安!!
(It’s time for bed. :-) Good night!!) (2) 該睡了= =,晚安
(It’s time for bed = =. Good night.)
Emotion mining and detection are crucial for many applications, including customer care (Gupta, Gilbert, and Fabbrizio, 2010), sales prediction (Liu, et al., 2007), game animation (Bernhaupt et al., 2007), and robot simulation (Becker, Kopp, and Wachsmuth, 2004). Typical tasks in emotion mining include capturing people’s feelings, predicting their reactions to events, and generating suitable emotions.
Since a large number of online articles have become available, many studies have started collecting these long texts and implementing specialized algorithms to automatically identify emotions in this kind of content. Mishne (2005) adopted a corpus of LiveJournal articles that included indications of writers’ moods to train mood classifiers with SVM. Mishne and Rijke (2006) used a blog corpus to identify the intensity of community mood during some given time intervals. Jung, Choi, and Myaeng (2007) also focused on the mood-classification problem in LiveJournal.
Some studies have tried to obtain lists of emotion-related words from Chinese blog articles and use classification algorithms to identify author’s emotions. Yang, Lin, and Chen (2007a) used articles posted on the Yahoo Kimo Blog website as corpora to build emotion lexicons. A collocation model was proposed to learn emotional lexicons from blog articles. Emotion classification at the sentence level was experimented on by using the mined lexicons to demonstrate their usefulness. Yang, Lin, and Chen (2008) further investigated emotion classification of blog corpora using SVM and conditional random field (CRF) machine-learning techniques. The emotion classifiers were trained at the sentence level and applied to the document level. Their experiments showed that CRF classifiers outperformed SVM classifiers.
Lin, Yang and Chen (2007) pioneered reader emotion analysis with an emotion-tagged corpus generated from Yahoo Kimo news articles. They later classified
documents into reader emotion categories with SVM and Naïve Bayes classifiers (Lin, Yang and Chen, 2008). Besides classification, Lin and Chen (2008) proposed algorithms based on pairwise loss minimization (PLM) and emotional distribution regression (EDR) to rank reader emotions. They showed that EDR was better at predicting the most popular emotion, while PLM produced ranked lists that had higher correlation with the correct lists. Yang, Lin, and Chen (2009) further introduced the application of emotion analysis from both writers’ and readers’ perspectives. The relationships between writer and reader emotions were discussed in their work.
As for emotion identification in short texts, some studies have started to implement classification models in the processing of microblogs and news headlines. Strapparava and Mihalcea (2007) focused on the emotion classification of news headlines. Go, Huang, and Bhayani (2009) used distant supervision for sentiment classification of Twitter messages, or “tweets,” with SVM outperforming Naïve Bayes and Maximum Entropy and resulting in 82.2% accuracy. Sun et al. (2010) focused on the Plurk microblogging platform and used textual content and the NTU Sentiment Dictionary to build their feature set. In a recent study, Vanzo, Croce and Basili (2014) investigated contextual information found in tweets and proposed a context-based model for sentiment detection.
2.3.2 Adverting Legality
Computational advertising has attracted much attention in recent years. How to
“best match” between a given user and a suitable advertisement in a given context is one of the major issues (Gabrilovich et al., 2008 and 2009). Some previous studies on Internet advertising focused on bidding (selecting) advertisements and placing them in the best (right) positions. Ghosh et al. (2009) proposed bidding strategies for the
allocation of advertisements. Edelman, Ostrovsky and Schwarz (2007) investigated generalized second-price (GSP) auction for online advertising. Huang, Lin, and Chen (2008) classified instant messaging dialogues into the Yahoo categories and applied the method to advertisement recommendation. Cheng and Cantú-Paz (2010) proposed a framework to predict the probability of individual users’ clicks on ads. Scaiano and Inkpen (2011) used a set of Wikipedia articles as an annotated corpus to find negative key phrases to avoid displaying advertisements to non-target audience.
Unlike advertisement bidding, matching and recommendation in computational advertising, this study focuses on illegal advertisement recognition. Illegal advertising is similar to ad spams2 for financial gain, but the former uses false, overstated or misleading statements to defraud customers, while the latter creates artificial ad traffic, inflates click/impression, and so on, to defraud online advertising systems such as AdWords. Advertising legality recognition is a new field in NLP and data mining. Food, cosmetics, and medicine are three major objects used in illegal advertising. Since advertisements that make health claims are highly regulated in many countries, this study focuses on food-related and cosmetics-related advertising.
2.3.3 Irony
Sarcasm and irony have been studied by linguistics and cognitive scientists for years (Giora and Fein, 1999; Gibbs and Colston, 2007), but there has been no concrete definition of the linguistic structure of irony. In recent years, some studies within computer science domain, as mentioned below, have also started focusing on the processing of sarcasm and irony.
2 http://support.google.com/adwordspolicy/bin/answer.py?hl=en&answer=50424
Veale and Hao (2010) constructed a corpus of ironic similes using the wildcarded query “as * as a *” in a search engine. Lukin and Walker (2013) used a bootstrapping method to improve the performance of the classifiers for identifying sarcastic and nasty utterances in online dialogues.
In order to perform irony detection experiments on tweets, many studies used the hashtag to automatically find ironic expressions on Twitter. This is an efficient way because a Twitter user can annotate his or her ironic expressions by adding the #irony or
#sarcasm hashtag to tweets. Davidov et al. (2010) collected messages from Twitter and product reviews from Amazon.com using the Mechanical Turk service. In their study, the #sarcasm hashtag was used as ground truth, and a k-nearest neighbor strategy was used for classification. González-Ibáñez et al. (2011) also made use of hashtags in Twitter as labels to build a sarcasm corpus. According to the latter paper, both human classification and automatic classification methods achieved low accuracy in sarcasm detection. Filatova (2012) used a crowdsourcing approach to generate an irony and sarcasm corpus. Reyes et al. (2012) analyzed humor and irony based on user-generated tags, such as #humor and #irony, on Twitter.
Hashtag-based approaches are not always suitable for irony corpus construction for all languages. As of March 9, 2014, only 113 messages were found to contain the hashtag #反諷 (#irony) on Weibo, the largest Chinese-language microblogging platform.
This study differs from the previous work in that we employ negative emoticons and positive words as clues to capture irony. The linguistic patterns mined from the irony corpus can be used to detect if a sentence is ironic.
Chapter 3 Emotions in Microblogs
Corpora annotated with emotion information are indispensable for emotion modeling. Social media, such as blogging platforms, encourage users to share their emotions through writing. For example, bloggers regularly use emoticons to express personal feelings in their posts. To encourage more reader interactions, some news media, e.g., Yahoo Kimo News, provide readers a voting mechanism so they can express their feelings about news articles they’ve just read. A collection of blogger posts and news article reader responses forms writer and reader emotion-tagged corpora, respectively, facilitating writer emotion and reader emotion mining.
Previous studies (e.g., Yang, Lin and Chen, 2007a; Yang, Lin and Chen, 2007b;
Yang, Lin and Chen, 2008) have used an emotion-tagged blog corpus to investigate the ways in which people express their emotions, trying to detect writers’ affective status with textual contents they have written. While these studies aimed to perform emotion analysis and detection from writers’ perspective, some other papers have focused on reader emotion generation (Lin, Yang and Chen, 2007; Lin and Chen, 2008; Lin, Yang and Chen, 2008) using emotion-tagged news datasets, modeling how readers react to articles on news websites.
To study how writer emotion affects readers’ feelings, Yang, Lin and Chen (2009) used the Yahoo Kimo Blog and Yahoo Kimo News to produce a dataset annotated with both writers’ and readers’ emotions. They constructed a document-level reader-emotion classifier using the Yahoo Kimo News corpus and applied the classifier to the Yahoo Kimo Blog corpus. In this way, a new blog corpus labeled with both writer and reader emotions was obtained.
The major problem with the above approach is that the reader emotion tagging on
the writer corpus depends on classification performance. Plurk, a unique social network and microblogging platform, provides useful resources where we can find dialogues consisting of original posts and their corresponding replies. A poster begins by publishing a post along with an emotion, then a replier responds to the post and labels it with an emotion symbol. The replier acts as a reader as well as a writer when they send their responses. Therefore, the original poster has only a writer emotion, but the replier has both a writer emotion and a reader emotion.
In this chapter, emotion mining models built from either the writer perspective, reader perspective, and combination of both writer and reader perspectives are proposed.
To collect data including both writers’ and readers’ emotional information, messages are extracted from Plurk, ending up with 50,000 conversations in the dataset.
The Support Vector Machine (SVM) algorithm is adopted to build classifiers for emotion prediction. Like many other related studies, textual features are used as basic feature sets for training and testing. Since the conversations in the dataset contain communications and interactions between users, some non-linguistic features were also taken into account. As a result, four types of features, namely, linguistic features, social relation, user behavior, and relevance degree, are used.
3.1 Dataset
3.1.1 Emoticons on Plurk
Positive Negative
Figure 3.1 Emoticons as positive and negative labels
The short messages in the Plurk Corpus are used for the emotion identification experiments. The Plurk website provides 78 basic graphic emoticons, which are commonly used by users. In this experiment, 35 of the emoticons are chosen and categorized into the positive and negative group. The other 43 are either neutral or cannot be clearly categorized and are thus excluded to minimize uncertainty. Figure 3.1 lists the Plurk emoticons used in this study.
3.1.2 The Plurk Dataset
In the Plurk dataset, there are 50,000 conversations dating from Jun 21, 2008 to Nov 7, 2009, and each of them consists of a post with or without an emoticon and a corresponding reply with an emoticon. Only the earliest reply for each conversation has been included because this can help us make sure the reply is a response to the original post rather than to other responses. All messages are in Traditional Chinese.
Some messages are filtered out by their qualifiers. For example, messages with the
“share” qualifier are not included because most “shares” are hyperlinks or images rather than general text messages. If a message contains an emoticon that is not shown in Figure 3.1, it will also be filtered out. Such an emoticon does not present obvious positive or negative emotion and will not be used in this study.
In the dataset, there are 42,115 conversations with a positive reply and 7,885 conversations with a negative reply. These conversations are obtained randomly from the Plurk website, and thus they should reflect their actual distribution on Plurk. For this reason the dataset is used without adjusting the proportion of the two emotion types.
The proportion of positive conversations (84.23%) is used as baseline.
3.2 Reader/Writer Perspective
Most related studies focus on the analysis and detection of writers’ emotion, since a writer’s content has a more direct link to his emotion, and corpora containing writers’
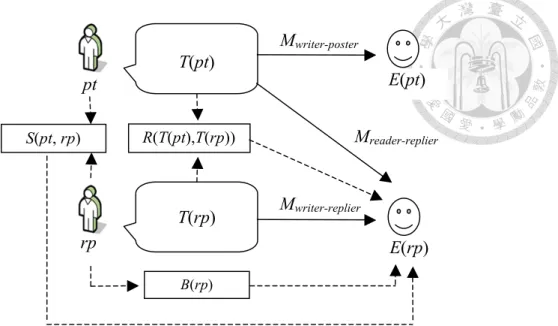
emotion are easier to find on the Web. In our experiment, the goal is to model the generation of reader’s emotion and to see how this kind of emotion can be related to the content written by poster, replier, or both. Depending on different perspectives, we have 3 types of models: reader model, writer model, and reader + writer model. Figure 3.2 shows important components in these models: the poster pt; the text T(pt) that pt posts;
a replier rp; the text T(rp) used by rp to reply to pt; rp’s emotion E(rp); S(pt,rp), which rp
R(T(pt),T(rp))
B(rp)
pt
E(rp) T(rp)
T(pt)
E(pt)
S(pt, rp) Mreader-replier
Mwriter-replier
Mwriter-poster
Figure 3.2 Different emotion generation models on Plurk
denotes the social relationship between pt and rp; B(rp), which denotes the behavior of rp; and R(T(pt),T(rp)), which denotes the relevance between the post T(pt) and the reply T(rp).
3.2.1 Reader Perspective
By looking at a replier’s emotion from readers’ perspective, a reader model can be built. In this model, it is assumed that a replier’s emotion is directly generated by reading the poster’s message and then the replier expresses his emotion by using an emoticon in his reply. It is indicated by the model Mreader-replier in Figure 3.2. We therefore have E(rp)=Mreader-replier(T(pt)) where Mreader-replier is a function that maps T(pt) into an emotion. Besides T(pt), the social relationship between rp and pt and the behavior of rp such that E(rp)=Mreader-replier(T(pt), S(pt,rp), B(rp)) are also taken into account.
3.2.2 Writer Perspective
In a conversation, both the poster and the replier generate textual contents. To model emotion generation from writers’ perspective, it is assumed that users’ emotions are related to their own contents. Thus, we have two types of writer model: poster’s writer model and replier’s writer model. This study focuses on replier’s writer model, while poster’s writer model is listed for comparison. For replier’s writer model, a replier’s content is used to predict his own emotion. The model Mwriter-replier in Figure 3.2 indicates the generation of a replier’s emotion from writers’ perspective. This can be represented by E(rp)=Mwriter-replier(T(rp)) where Mwriter-replier is a function that maps T(rp) into an emotion. Besides T(rp), we can consider social relationship between rp and pt and the behavior of rp such that E(rp)=Mwriter-replier (T(rp), S(pt,rp), B(rp)). For
poster’s writer model, a post’s content is used to predict his emotion. That is, E(pt)=Mwriter-poster(T(pt)).
3.2.3 Reader and Writer Perspective
In this kind of model, readers’ and writers’ perspectives are combined, assuming that a replier’s emotion is related to both poster’s content and the replier’s own content.
A replier’s emotion is thus predicted using poster’s and replier’s texts. This is represented by E(rp)=Mreader-writer(T(pt), T(rp), R(T(pt), T(rp))) where Mreader-writer is a function maps T(pt), T(rp), R(T(pt),T(rp)) into an emotion. Besides textual information, social relationship between rp and pt and the behavior of rp into this function can also be incorporated.
3.3 Emotion Modeling
SVM is adopted as classifiers to predict emotions from reader and/or writer perspectives. Besides textual features, non-textual features, such as social relation, user behavior, and relevance degree, are also used.
3.3.1 Text Features (T)
Since about 70% of Chinese words are disyllabic and new words and slangs are commonly used on social media, bigrams are used instead of words as features. Chinese character bigrams in all poster’s and/or replier’s messages are extracted. The relationship between a bigram w and an emotion e as probability P(w|e) is modeled.
The training set is composed of conversations between posters and repliers. A conversation scenario between a poster and a replier is described as follows. A poster pt writes a post T(pt) with emotion E(pt). After a replier rp reads the post T(pt), rp writes a
reply T(rp) with emotion E(rp). Note that poster pt writes and replier rp reads the same message T(pt) and respectively express emotions E(pt) and E(rp). In contrast, replier rp reads and writes different messages, i.e., T(pt) and T(rp), with the same emotion E(rp).
As a result, three datasets can be built: Dwriter-poster, Dreader-replier, and Dwriter-replier. Dwriter-poster is composed of all the messages of posters along with their emotions.
Dreader-replier consists of all the messages that repliers read and emotions that they express.
Dwriter-replier denotes a set of messages and emotions that repliers convey. The three data sets are used to train Pwriter-poster, Preader-replier, and Pwriter-replier, respectively.
To implement SVM in the experiments, libSVM (Chang and Lin, 2001) is adpated as the classification tool. The libSVM parameter selection tool shows that the classifiers yield the best results when C=3 and gamma=0.13.
3.3.2 Social Relation (S)
Each replier has his own interaction preference. The social relationship between a poster and a replier is the first cue. Therefore, the social relationship between two users is measured according to their interaction degree. The following three features are proposed.
As shown below, S1 defines the interaction degree between users u1 and u2 as their total number of interactions. D is a multiset of conversations (u1, u2), and u1 and u2 are poster and replier in the conversation.
The second social relation feature S2 considers how often user u1 posts messages.
In (2), start and end denote the starting and ending day of the interaction between user u1 and u2. S2 equals to S1 divided by the frequency of posts by poster u1.
It is also important to take how often a replier posts a reply into consideration. S3
defined as follows captures this idea.
3.3.3 User Behavior (B)
The user behavior features model the subjective tendency of a user. The history of a specific replier shows which emotions he tends to express. B-int defines the negative tendency of user u.
In the above formula, u is a replier, E(u) is the replier’s emotion with a value 0 (negative) or 1 (positive). C is the frequency of E(u). This indicator does not take the interaction with posters into account.
The other user behavior feature represents how often a replier expresses his positive emotion to a specific poster. This feature is called interactive behavior (B+int) and is defined as follows.
In some cases, replier’s behavior history is not available. Back-off smoothing is used to deal with this issue. Interactive user behavior after smoothing (Bs) is defined as:
In (6), rp is a replier, pt is a poster, and RP is a set of all repliers. K1 and K2 are set to 1 in the experiments.
3.3.4 Relevance Degree (R)
Although a post and its reply are in the same conversation, they are not necessarily on the same topic or fully related to each other. This may affect the use of emoticons, so relevance degree should be dealt with. R(T(pt), T(rp)) is defined as follows:
R(T(pt), T(rp))=
If there exists an anaphoric element or a conjunction in replier’s message, then it is assumed that the conversation is related and the value 1 is assigned to the relevance degree. Nine anaphoric elements and 43 conjunctions are adopted. Otherwise, we check if the post and the reply overlap. More overlapped words mean that they are more related. It is assumed that the post and the reply have some basic relationship, so the default relevance degree is set to 0.5.
3.3.5 Normalization
The size of the linguistic feature set is much larger than the three non-linguistic feature sets, so the following vector normalization method is applied to deal with the issue:
F is a vector representing the values of n features f1, f2, f3, …, fn. Each f value is divided by the length of F. Finally, the new values nf1, nf2, nf3, …, nfn. constitute the normalized F.
3.4 Results
Classifiers were trained and tested with 10-fold cross-validation. In this section, the results of the models from the three types of perspectives are shown and discussed.
3.4.1 Text Features (T)
T Reader model 80.67%
Writer model 88.75%
Reader+Writer model 88.71%
S 82.78%
B-int 84.14%
B+int 86.25%
Bs 86.93%
R 81.53%
Table 3.1 Accuracies of different feture sets
An individual feature set is used at a time to compare the performance. The linguistic feature set (T) is used to model replier’s emotion generation from three different perspectives. When performing the prediction task with the reader model and
the writer model, 3,000 bigrams from poster’s and replier’s messages were used, respectively. To perform the task with the reader + writer model, all the bigrams from both the reader and writer models were used. As a result, a total of 6,000 features are used.
Table 3.1 shows that the writer model and the reader + writer model achieved higher performance than the reader model. The performance of the writer model is slightly higher than that of the reader + writer model, but the t-test shows that the difference is insignificant. The performance of the writer model and the reader + writer model is higher than the baseline (84.23%), while the performance of the reader model is lower than that of the baseline.
The classifier with the interactive user behavior (B+int) feature outperformed the one with the non-interactive user behavior (B-int) feature, achieving performance (86.25%) higher than the baseline. After applying back-off smoothing, the interactive user behavior (Bs) proved to achieve even higher performance (86.93%), which is the best among all non-linguistic feature sets.
The social relation (S) and relevance degree (R) features result in lower performance than the baseline. In summary, when each of the non-linguistic feature sets is used individually, Bs is the most effective: Bs > B+int > B-int > S > R. For the behavior feature set, back-off smoothing is useful. In addition, the behavior pattern in response to a specific poster is more useful than to all posters, suggesting that the affective interaction between two given users may be based on a certain pattern.
3.4.2 Combination of Feature Sets
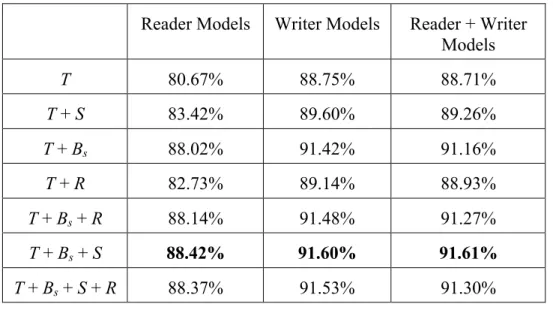
Experimentation with some combinations of different feature sets is also performed. Table 3.2 shows the results with these combinations from reader, writer, and
reader and writer perspectives. Writer models still outperformed reader models and are slightly better than reader+writer models for all feature combinations except for the model with the T + Bs + S combination.
When combined with textual features, the behavioral feature set was still more powerful than social relation and relevance degree. However, all the 3 non-textual feature sets are helpful since paired t-tests show that the differences between T and T + Bs, T and T + S, and T and T + R are significant (p < 0.05).
Reader Models Writer Models Reader + Writer Models
T 80.67% 88.75% 88.71%
T + S 83.42% 89.60% 89.26%
T + Bs 88.02% 91.42% 91.16%
T + R 82.73% 89.14% 88.93%
T + Bs + R 88.14% 91.48% 91.27%
T + Bs + S 88.42% 91.60% 91.61%
T + Bs + S + R 88.37% 91.53% 91.30%
Table 3.2 Accuracies of models with different feature combinations
Because Bs is most useful when used with textual features, T + Bs, T + Bs + S and T + Bs + R were compared to find out how S and R can improve performance. For the reader models, the difference between T + Bs and T + Bs + S is significant (p < 0.05), but the difference between T + Bs and T + Bs + R is insignificant. This suggests that T + Bs + S is a more useful combination than T + Bs + R. For writer and reader + writer models, T + Bs + S still outperformed T + Bs + R.
Although each of the 3 non-linguistic features can improve performance, combining all of them (T + Bs + S + R) does not achieve the highest performance. The best performance is achieved by the combination of T + Bs + S regardless of which
perspective is adopted. According to results of the paired t-test, the difference between T + Bs + S + R and T + Bs + S is insignificant for the reader model and the writer model.
This suggests that although adding R to the combination does not decrease the performance significantly, it is also not helpful. The reasons for this can be the following: both social relation and interactive behavior are related to interaction between two specific users, so their effects may overlap. In addition, only 14.73% of the conversations have a relevance value higher than 0.5.
3.4.3 Different Perspectives
For all feature set combinations, the writer models and the reader + writer models achieve better performance than the reader models. These differences are significant according to the paired t-tests, which suggests that the message generated by the replier him- or herself contains more useful information than the message generated by the poster and then read by the replier.
When using the textual feature set only, the performance of the reader model (80.67%) was much lower than that of the writer model (88.75%) and reader + writer model (88.71%). When T is used with Bs and S, in contrast, the performance of the reader model is 88.42%, only slightly lower than the performance of the writer model (91.60%) and the reader + writer mode (91.61%). This indicates that non-linguistic features play a more important role when modeling emotion generation on a social network.
The performance of textual feature set for the writer model is 88.75%, slightly higher than that for the reader + writer model (88.71%). According to results of the paired t-test, the difference between them is insignificant. For the T + Bs + S combination, the performance of the reader + writer model (91.61%) is slightly higher
than that of the writer model (91.60%), though the difference is also insignificant. It thus makes little difference in performance whether emotion generation is modeled from writers’ perspective or both readers’ and writers’ perspectives. In this series of experiments, 91.61% was the highest accuracy achieved.
3.4.4 Writer Model
As mentioned in the Section 3.3, posters’ writer mode also exists. In such a model, only the linguistic feature set can be used, and the classification accuracy is 89.19%.
The t-test shows that the difference between posters’ and repliers’ writer models are insignificant (p<0.082). However, it is important to note that the dataset used for the posters’ writer model differs from the one used for the repliers’ writer model, so this comparison is for reference only.
3.5 Writer-Reader Emotion Transition
In a conversation, the emotions behind the writer’s post and replier’s response can be different. The process of changing from the writer emotion to reader emotion is called writer-reader emotion transition in this section. The study on what factors affect the emotion transition is important for human language understanding and has many potential applications.
Most previous studies on emotion analysis first focused on writers’ perspective.
Pang et al. (2002) classified movie reviews into positive and negative emotions.
Wiebe (2000) investigated the subjectivity of adjectives. Aman and Szpakowicz (2007) labeled phrases with emotional categories. Beyond binary classification, Mishne (2005) classified blog posts into 37 emotion classes. Some recent studies (Lin, Yang and Chen, 2008; Lin and Chen, 2008; Yang, Lin and Chen, 2009) proposed reader emotion
analysis approaches.
In this section, Plurk conversations with both writers’ and readers’ emoticons are used. Linguistic features are mined from the writer-reader emotion dataset, and then emotion transitions between writers and readers are predicted.
3.5.1 Sentiment Word Mining
On microblogging platforms, a microblogger may play the role of both a writer and a reader. When posting the first message, he or she is a writer. After reading the repliers’
messages, he or she can give some feedback. In this case, he or she becomes a reader of the replies. To avoid the confusion, we collect only the first message of a conversation and the first reply to the first message. Then the corpus is divided into four datasets based on the emotion transition types: (pos, pos), (pos, neg), (neg, neg) and (neg, pos). For clarity, the four datasets are named as PP, PN, NN, and NP datasets, respectively. A total of 79,042 conversations form the experimental corpus. The number of instances in each dataset PP, NN, and NP is 20,000.
The number of instances in the dataset PN is 19,042 because fewer examples of (pos, neg) can be found.
The Yahoo word segmenter “斷章取義” was used for Chinese word segmentation and part-of-speech (POS) tagging of the datasets. Then each of the datasets was compared with the other ones to examine the differences between their word distribution.
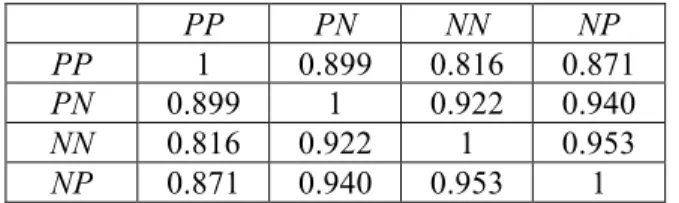
PP PN NN NP
PP 1 0.899 0.816 0.871 PN 0.899 1 0.922 0.940 NN 0.816 0.922 1 0.953 NP 0.871 0.940 0.953 1
Table 3.3 Similarity among emotion transition datasets
The function words with the POS of article, preposition, and conjunction were removed from the datasets. Each dataset is represented by a word vector (w1, w2, …, wn),
where wi is the normalized weight of the word wi. The weight wi in a dataset is the total occurrences of wi divided by total number of words in the dataset. Cosine similarity is employed to measure the similarity of each pair of datasets. Table 3.3 shows the results.
The dataset PP contains no negative emotions and NN contains no positive emotions, so they differ a lot from each other as expected. As can be seen in Table 3.3, PP and NN have the lowest cosine similarity. The pair with the highest cosine similarity is NN and NP, showing that negative writer messages are similar regardless of reader emotions. In other words, the same writer message with negative emotion can cause either positive or negative reader emotions. This may make reader emotions more difficult to predict if the writer message is negative. In contrast, PP and PN have lower cosine similarity. It means that reader emotions are relatively easier to predict if the writer message is positive.
Generally speaking, all the datasets with any negative emotions, including PN, NN and NP, have higher cosine similarity (> 0.9) when compared with each other. The similarity of PP and any other dataset is lower (< 0.9).
The log relative frequency ratio, or logRF, of words in two datasets A and B is defined as follows. It is used to select critical features that capture the emotion transition.
For each wi∈A∪B, compute
logRFAB(wi) = log fA(wi)
| A | fB(wi)
| B |
, where logRFAB(wi) is a log ratio of relative frequencies of word wi in A and B. fA(wi) and fB(wi) are frequencies of wi in A and in B, respectively. |A| and |B| are total words in A and in B, respectively. The log relative frequency ratio is used to estimate the distribution of the words in datasets A and B.
The interpretations of logRFAB(wi) are shown as follows.
(1) If the relative frequency of wi in A is higher than in B, then logRFAB(wi)>0. Those words with a positive ratio form a set A-B.
(2) If the relative frequency of wi in B is higher than in A, then logRFAB(wi)<0. Those words with a negative ratio form a set B-A.
(3) If the relative frequency of wi in A is approximately equal to that in B, then logRFAB(wi)≅0.
A and B can be one of the following combinations.
A=PP, B=PN
It captures the emotion transitions pospos and posneg. Those words in PN-PP may be probable to affect the emotion transitions from positive to negative. Those words in PP-PN may be probable to keep the emotion unchanged, i.e., remain in the positive state.
A=NP, B=NN
It captures emotion transitions negpos and negneg. Those words in NP-NN may have some effects on the emotion transition from negative to positive. Those words in NN-NP may keep the emotion unchanged, i.e., remain in the negative state.
A=PP∪PN, B=NN∪NP
It captures positive and negative emotion representations of writers. A writer emotion dictionary EDW can be constructed based on the log relative frequency ratio of words in the positive dataset PP∪PN and negative dataset NN∪NP.
A=PP∪NP, B=NN∪PN
It captures positive and negative emotion representations of readers. Thus, a reader emotion dictionary EDR can be constructed from the positive dataset PP∪NP and negative dataset NN∪PN.
3.5.2 Analysis of Mined Words
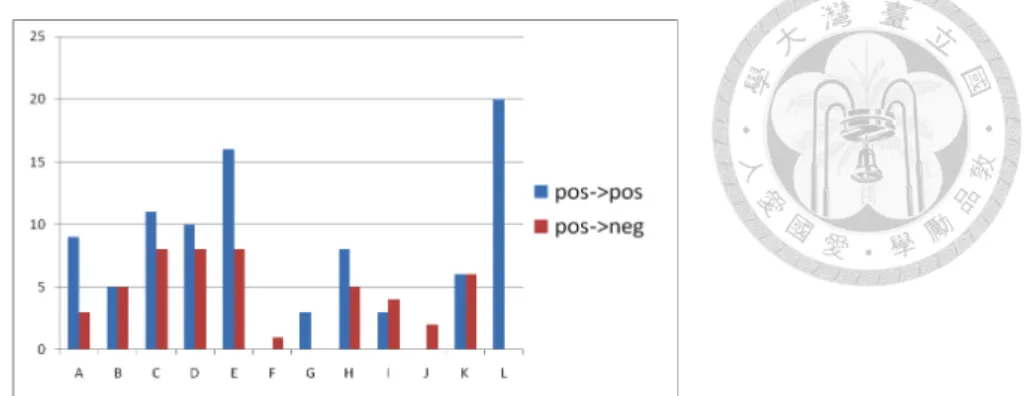
To examine the mined words, the top 200 words with higher log relative frequency ratios in PN-PP, PP-PN, NN-NP, and NP-NN were used as samples. Their semantic categories in the Chinese thesaurus Tóngyìcícílín (同義詞詞林. Mei et al., 1982), which is abbreviated as Cilin, were identified. In Cilin, there are 12 categories labeled by letters: A. human, B. object, C. time and space, D. abstract concept, E. characteristics, F.
movement, G. mental activity, H. activity, I. status, J. relation, K. particle words, and L.
greeting.
The word counts in each category were calculated, and only the words that could be found in Cilin were analyzed. Figure 3.3 shows the distribution of the words in the pospos transition and the posneg transition. Words used in positive writer contents are more likely to get positive response, except for the categories B, F, I, J and K. The most noticeable feature is greeting words (category L) such as掰掰 (goodbye), 早安 (good morning), 晚安 (good night), which never cause the posneg transition. The words causing the posneg transition include some words in the category K such as 難 道 (dubiously), 幸好 (fortunately, which usually follows a negative expression), and 到底 (exactly). These words themselves do not contain negative emotion, but are usually used in expressions related to negative emotions.