國立台灣大學電機資訊學院生醫電子與資訊學研究所 碩士論文
Graduate Institute of Biomedical Electronics and Bioinformatics College of Electrical Engineering and Computer Science
National Taiwan University Master Thesis
VariED: 基於心臟疾病的變異與基因表達的整合型資料庫 VariED: an integrated database of variants and gene expression
profiles for heart diseases
姜莉玫 Li-Mei Chiang
指導教授:莊曜宇 博士 盧子彬 博士 Advisor: Dr. Eric Y. Chuang
Dr. Tzu-Pin Lu
中華民國 107 年 10 月
Oct 2018
致謝
碩士的生活過得真快,真不敢相信自己也寫出一篇論文出來。謝謝莊曜宇 老師提供實驗室大量的資源給我們這些研究生使用,也謝謝盧子彬老師總是願意 在百忙之中,提供我研究路上的建議,每次討論後,都給我很多研究方向與想法 上的改進,也謝謝蔡孟勳及賴亮全老師指出我沒想到過的問題以及指出論文中沒 注意到的細節與粗心。除此之外,也謝謝實驗室每位學長姐、學弟妹、助理們對 我平常的照顧,感謝建樂學長在程式碼方面的各種協助,以及願意在百忙之中撥 空拯救我爛到爆的英文,謝謝承桓學長對伺服器的維護,讓我們能夠安心做分析,
也感謝嘉珊學姐在生物方面觀念解釋的幫忙,感謝佳興學長在統計方面觀念解釋,
還有感謝同屆的同學們,季芸、羿玄、棣台平時相互鼓勵與建議,感謝沂芳,願 意忍受我週五崩潰的吼叫聲以及提供 FB 聊天室給我洗版紓解壓力,也感謝碩一們,
吃飯打球等各種交流,使我能紓解壓力,感謝亦文、仙芳以及 Amrita 在研究內外 的各種交流,使我能提升自我,也感謝 NAL 的同仁們,給我機會增進自己的程式 撰寫與英文能力,也謝謝家人、高中同學、大學同學一路上的支持。
現在,我即將離開研究室,雖然對於未來方向仍在思索中,不過不管未來 的路有多困難,我會帶著實驗室所學的東西在之後的社會上努力堅持下去,再次 感謝所有指導老師們、實驗室同仁和朋友的幫忙。
摘要
心臟疾病近幾年來皆為世界十大死因前幾名,且花費也有逐年增高的趨勢,
為了找到解決的辦法,越來越多研究者參與心臟疾病的研究,然而從活體取得心 臟組織不容易,其他組織部位與心臟的基因表現圖譜可能不一致,因而造成找到 可能會發生致病變體,但變體所在的基因卻不會在心臟表現的情形。為了解決基 因表現圖譜在不同組織之間表達不同的問題,並且幫助研究者分析變體跟族群與 疾病之間的關係,本研究的目的是建立一個心臟全面性的資料庫,因應前面提到 的需求,提供兩種服務,Expression profiles 和 Variants Search,前者用於查詢基因 相關訊息,並且用於確認目標基因是否會在心臟組織表現;而後者用於獲取變體 多方面訊息。
在這項研究中,我們提出一個網頁式介面操作的變體和心臟組織基因表現圖 譜的資料庫,統整了人類、老鼠、斑馬魚的心臟基因表現圖譜資料,以及 1000 Genomes Project 、 National Heart, Lung, and Blood Institute (NHLBI) Exome Sequencing Project (ESP) 、Integrative Japanese Genome Variation Database (IJGVD) 和臺灣人體生物資料庫等發表的各大族群遺傳變體的參考資料,此外我們也收集 了 REVEL、GERP++、CADD 等分數,用來預測可能引起疾病的變體,並且建立 Index 系統,有別於以往變體分析工具,index 系統加入了組織基因表現要素。此 外,為了幫助研究者將變體做臨床上的連結,ClinVar 發表的變體表型等資訊也整 合進 VariED。在結果上,我們運用幾個例子展現了 VariED 的應用,我們成功從 多個基因中找到不會在心臟表現的基因,也以三個布魯格達氏症候群相關變體,
展現 VariED 找到致病的變體的能力;index 系統提供的數值也能用來成功找到致
病的變體,並且與 CADD 分數有中度相關。總言之,VariED 藉由整合各大資料庫 與工具的數據來提供全面性的服務,幫助研究人員減少搜索資料的時間成本,並 促進心臟疾病的研究。
關鍵字:心臟疾病、基因變體、人群等位基因頻率、基因表現圖譜、資料庫、線 上系統
Abstract
Heart disease is the top ten causes of death in the world and the cost of heart disease is also increasing year by year. In order to improve the understanding of heart diseases, more and more research efforts have been devoted to the heart disease researches. However, it is difficult to gather heart tissue directly from human patients, and the gene expression profiles obtained from other tissues may be different from that of the heart. Thus, it is possible to obtain a pathogenic variant which is in a gene but does not express in the heart tissue. To overcome this problem and support researchers to analyze the relationship among variants, populations, and heart diseases, we developed a comprehensive database for heart diseases. As mention above, VariED provides two major functions, Expression Profiles and Variants Search. The former is used to query gene information and confirm whether the target gene expresses in heart tissue; the latter is used to obtain more detailed information of the interested variants.
In this study, we developed a web-based database integrating variants and tissue- based expression profiles in heart from three species, including human, mouse and zebrafish. In addition, the population allele frequency from the 1000 Genomes Project, National Heart, Lung, and Blood Institute (NHLBI) Exome Sequencing Project (ESP), Integrative Japanese Genome Variation Database (IJGVD), and Taiwan Biobank were included. We also collected REVEL, GERP++, and CADD scores that can help to elucidate the functional roles of interested variants for diseases. Subsequently, an index
scoring system was implemented in VariED. The uniqueness for the scoring system is that we consider tissue-based gene expression level as an important factor in the prediction. Lastly, to help researchers identify causative variants in diseases, a public database named as ClinVar which collected the associations between DNA variants and diseases was integrated. In this thesis, we used several examples to show the potential applications of VariED. For examples, we successfully identified a gene which does not express in heart tissue. Three Brugada syndrome-related variants were analyzed to demonstrate the usage of VariED to find pathogenic variants. We believe VariED not only assists researchers to save time for querying data, but also helps users to identify important DNA variants related to diseases.
Keyword: heart disease, genetic variant, population allele frequency, gene expression profiles, database, web-based system
Contents
口試委員會審定書 ...i
致謝 ... ii
摘要 ... iii
Abstract ... v
Contents ... vii
List of Figures ...ix
List of Tables ... x
1 Introduction ... 1
1.1. Motivation ... 1
1.2. Specific aims ... 5
1.3. Heart disease research ... 7
1.4. Next-generation sequencing ... 8
1.5. Variant ... 10
1.6. Gene expression ... 13
2 Materials and Methods ... 15
2.1. Overview of VariED ... 15
2.2. Dataset collection and processing ... 19
2.3. Identify aliases and orthologs ... 23
2.4. Index system ... 24
2.5. Methods ... 26
2.5.1. Function 1 : Expression Profiles ... 26
2.5.2. Function 2 : Variants Search ... 28
3 Results ... 30
3.1. Example 1: Finding out pathogenic variants, which cause Brugada Syndrome 31 3.2. Example 2: Using queried variants search for gene annotation information and find pathogenic variant ... 35
3.3. Example 3: Using heart tissue gene expression profiles information to filter the candidate gene in heart diseases. ... 37
3.4. Performance of index system ... 43
4 Discussion ... 45
4.1. Accuracy ... 45
4.2. Tissue-based gene expression profiles ... 46
4.3. Data collection of gene expression profiles in different species ... 47
4.4. Mapping RNA-Seq reads to the reference genome ... 48
4.5. Characteristics ... 49
4.6. Processing speed ... 51
5 Conclusion ... 53
References ... 54
List of Figures
Figure 1. Overview of VariED.. ... 16
Figure 2. The database schema of gene expression and annotation database. ... 17
Figure 3. The database schema of allele frequency and functional prediction scores database.. ... 18
Figure 4. Relation Diagram of Expression Profiles. ... 27
Figure 5. Workflow of Variants Search. ... 29
Figure 6. The screen shot of the home page of VariED. ... 30
Figure 7. Screen shop of Variants Search... 33
Figure 8. Screenshots of the results from the Variants Search. ... 34
Figure 9. Screenshots of the Expression profiles. ... 40
Figure 10. Screenshots of the result of Expression profiles. ... 42
List of Tables
Table 1. A summary of comparison of functions and queried results offered by existing
databases and tools. ... 4
Table 2. Characteristic of the predictive score from common tools.. ... 12
Table 3. The list of tissues which had integrated in VariED. ... 22
Table 4. The sample size of each population... 23
Table 5. The index system. ... 26
Table 6. Example of variants from genes to be queried using VariED. ... 32
Table 7. An example of 5 variants from each of gene GAPDH and SCN5A. ... 37
Table 8. The result of Variants Search. ... 37
Table 9. The abundance criteria of FPKM value in human... 41
Table 10. Standard deviation and mean of the CADD raw score... 44
Table 11. Standard deviation and mean of the CADD phred-like score. ... 44
1 Introduction
1.1. Motivation
Genetic diseases are caused by one or more abnormalities in the genome. The abnormality may range from just a single nucleotide change to a long fragment sequence
deletion or insertion. The change in the genome may result in single-gene disorders, such as sickle cell anemia and Huntington’s disease, or multifactorial inheritance disorders, like heart disease and cancer [1-3]. With the improvement of sanitary conditions in developed countries, genetic diseases become one of the major cause of death. The statistics report from world health organization (WHO) show that heart disease is the foremost cause of death in the world [4]. In the United States alone, more than 16.3 million adults suffer from heart diseases and an estimation of 935,000 heart attacks occurs each year [5]. Hence, innovative diagnostic strategies are essential to improve prevention and treatment in order to limit the growing incidence of heart diseases. Fundamental sources of heart disease studies exist in forms of heart cells, blood cells or stem cells.
Blood cells are primary source primarily utilized for conducting heart studies as they are easily available as samples from patients. However, blood samples might possess the risk of having gene expression patterns different from that of the heart. Besides, heart cells are difficult to gather from human patients, and stem cells, even though a subject of broad and current interest with respect to heart research, are expensive and challenge some.
Hence, heart cells and stem cells are usually not used for heart studies. Under such limitations of those two types of cells, peripheral blood serves as the most important material for accurate understanding and evaluation of heart diseases. To address the discrepancies between peripheral blood cells and heart cells, an integrated analysis DNA variants and gene expression profiles may facilitate precise identification of gene regulatory networks, precise identification of gene regulatory networks involved in the disease mechanism.
With the advancement in microarray and next generation sequencing (NGS) technologies, availability of huge public resources provides a good chance for researchers to simultaneously analyze data from multiple molecular levels. One of the fantasies has been to understand not only all genes but the respective expression patterns, in time and space. Analyzing changes in gene expression among organs resulting in unique expression profiles are considered key molecular markers for diagnostic and prognostic assessment of functional effects of genetic variants. Construction of a user-friendly database composed of data from different resources may greatly benefit researchers to evaluate the importance of identified DNA variants. Based on this vision, massive tools and databases are available to compare the dynamic gene expression among different organs and predict functional effects of genetic variants. However, few of the existing tools and databases contain gene expression specific to heart diseases and support variant annotations, pathogenic analyses simultaneously (Table 1). To establish comprehensively
analysis system that provides the information of population allele frequency, gene expression level and pathogenic possibility of queried DNA variants can not only improve the efficiency of analyses, but also facilitate dissecting the biological mechanism of specific diseases.
Therefore this study aims at developing such a query based tool with the goal of providing users with a single platform for predicting protein functions in mutations and analyze population allele frequency, gene expression and pathogenic information of queried variants of heart diseases.
Table 1. A summary of comparison of functions and queried results offered by existing databases and tools.
Population allele frequencyTissue-basedgene expressionprofiles Support VCF files search Batchsearch Functional prediction scoresclinical interpretatio1000 GenomesESPIJGVDTWB
EASAMREURSASAFRAAEA1KJPN2KJPNTWREVELGERP++CADD
VariEDOOOOOOOOOOOOOOOOO
ANNOVAROOOOOOOOOOOOInterVarOOOOOOO△1△1OO
ProteinAltas O
HGMD△2△2△2
Uniprot △3O GeneCardO△4
EAS: East Asian; AMR: American; EUR: European; SAS: South Asian; AFR: African; ESP: NHLBI GO Exome Sequencing Project; AA: African American; EA: European American; IJGVD: Integrative JapanGenome Variation Database; 1KJPN: 1,070 Japanese individuals; 2KJPN: 2,049 Japanese individuals; TWB: Taiwan Biobank; TW: Taiwanese; REVEL: Rare Exome Variant Ensemble Learner; GERP: GenomEvolutionary Rate Profiling; CADD: Combined Annotation Dependent Depletion. 1script version only2professional version only3simple declaration only4100 genes per query or pay for getting an annual unlimited license
1.2. Specific aims
Summing up all the problem and requirements above, the goal of this study is to establish a comprehensive database for heart diseases. Not only collecting and arranging the gene expression profiles data of different tissues, but also supporting researchers to analyze the relationship among variants, population and heart diseases. For saving time on querying, we provide users to upload their variants data, such as variant call format (VCF), or typing multiple keywords in our user interface. Using the variants information we collect, including gene expression profiles, population allele frequency and functional prediction scores, the integrated information will let researchers easy analyze their data.
In this thesis study, a web-based database, VariED, have been developed to help researchers automate their variants analyses and give an index to each variant based on the summary report. As previously noted, the problem of using gene expression profiles from blood samples derives from the different expression patterns in different human tissue. For this purpose, we built the Expression Profiles service. This service collected the RNA-seq data from three species including human and popular model species, mouse, and zebrafish. The RNA levels in different tissues, including 32 tissues in human, 8 tissues in mouse and 3 tissues in zebrafish were based on the RNA-seq. Not only collected the RNA-seq of heart tissue in different species, we also integrated the RNA level in brain, lung, liver, etc. The collected of RNA-seq derived gene expression profiles data in
multiple tissues can not only help researchers to confirm the gene expression pattern in heart tissue, but also can be used to find out the effect of the target gene which has lost function. For the other purpose, saving time on querying, we built the Variants Search service. This service integrated the gene expression profiles which has mention above, population allele frequency from 4 databases, pathogenicity prediction scores from 3 tools and clinical interpretation of the variant from 1 database. Not only integrated data from multiple databases, we also simplified the process of variants analysis. By using Variants Search service, users only need to provide the chromosomal coordinate and nucleotides change of variants, then choose the databases they want and they can get an integrated results table at a time. Additionally, all the results can be downloaded as a comma- separated value (csv) file, which is friendly for users to do the follow-up applications.
Most importantly, VariED does not set a queried limit, which means users can directly analyze large amounts of variants which also greatly reduces the cost of time on querying.
Overall, the two services were built to have benefit for heart disease research. Over the past few years, the number of death caused by heart disease is staying high. Although, the advance of technology make it easier for researchers can get a lot of variants information, the progress in heart disease research is still slow. Researchers need an integrated database to help them analyze large amounts of data. Therefore, based on this desire VariED was constructed.
1.3. Heart disease research
Heart disease, the foremost cause of death in the world, refers to various types of conditions than can result in a disorder of the heart function. These types of diseases under the heart disease umbrella include heart rhythm problem, such as arrhythmias that affect the electrical conduction; blood vessel diseases, such as coronary artery disease; blood vessel diseases, such as ischaemic heart disease (IHD), also known as coronary heart disease (CHD), is a group of diseases that includes: stable angina, unstable angina, myocardial infarction, and sudden cardiac death [6], among others. Take IHD for example, according to the statistics from WHO, IHD killed 8.76 million people and became the first leading of death in 2015 [4]. The estimated cost of IHD in 2010 was $272.5 billion and is estimated to reach $818 billion by 2030 [7]. Hence, innovative diagnostic strategies are essential to improve prevention and treatment of IHD to limit its growing incidence.
Fundamental sources of cardiac disease studies exist in forms of heart cells, blood cells or stem cells. Heart cells (Cardiomyocytes, Cardiac pacemaker cells, etc) are potentially impossible to gather from human patients, blood cells which are easily obtained as samples from patients might possess the risk of having gene expression patterns different from that of the heart, and stem cells, a subject of broad and current interest with respect to heart research, is expensive and challenge some. Under such circumstances, for accurate understanding and evaluation of in vivo biological activities, precise identification of gene regulatory networks are of utmost importance. Hence, inference of
such networks is often accomplished through the use of gene expression data. A promising approach for identifying IHD biomarkers is through such studies of gene expression signatures of IHD. Therefore, a comprehensive database combining gene expression information will be helpful for the study of heart disease.
1.4. Next-generation sequencing
Based on the principle of Sanger sequencing, which is considered as the first- generation sequencing, NGS providing much higher read throughput while shorter read length that reduces the cost and time to complete genome-wide sequencing study [8]. A NGS experiment undergoes steps of template preparation, sequencing, imaging and data analysis. During the template preparation, current methods usually randomly breaking genomic DNA into fragments of shorter length, which generally falls within the range of dew tens to few thousands of nucleotides. For further manipulation, adapter and barcode will be added to the DNA fragments. These DNA fragments will be fixed on the sequencing chip and mixed multiple samples in one experiment run. Each template will then be positioned separately on the sequencing chip. During the sequencing, each based is read out at a time by using deoxyribonucleotide triphosphates (dNTPs) with four or two fluorescent chemical labels and reversible terminator. After multiple cycles, sequencing is done. At imaging step, the fluorescent emission of all templates on the chip is captured
for further data analysis. Sequencing and imaging steps make NGS determine the sequencing millions of DNA fragments in parallel and become so-called high throughput technology.
NGS has been playing an important role in current genomic research. Over the decade, NGS has become the way to understand genome [9], such as quantification of transcriptome expression [10], genotype inference and variant calling [11]. Comparing to the Human Genome Project [12], finishing a new organism assembly now requires significantly shorter time and lower budget. The cost of sequencing a human-sized genome is decreased from USD 100 million to USD one thousand [13]. It can be expected that more and more fields will adopt this technology and the application of NGS will also become wider. Therefore, a platform help users analyze a large number of variants from NGS will become a common demand.
1.5. Variant
The definition of a variant is based on the definition of each allele with respect to the reference. There are several types of variant, such as single nucleotide polymorphism (SNP), multiple nucleotide polymorphism (MNP), insertions and deletion (INDEL), etc.
A variation in a single nucleotide and more than 1 % of a population does have this variation, then this variation can be classified as a SNP. If a variation more than one base, for example AA/TT then this variation can be classified as a MNP. INDEL, a mutation named with the blend of insertion, the addition of one or more nucleotide into a DNA sequence, and deletion, the loss of a part of the DNA sequence. If a variation occurs within a gene, it may lead to change the amino acid sequence and associate with certain diseases.
To identify the disease-associated variants, several projects are now underway to build a reference of genetic variations from different populations. Furthermore, it is now widely believed that low-frequency variants may play an important role in disease causation [14]. In addition, low-frequency variants are usually closely related to populations. Due to those projects a lot of variation was found, including synonymous variants, a variation occurs within a gene won’t modify amino acid sequence, and nonsynonymous variants, a nucleotide mutation that alters the amino acid sequence of a protein. However, the majority of nonsynonymous variants discovered by those project or NGS have unknown significance. This may be caused by the infeasibility of
experimental validation of large numbers of rare variants and the requirement of the prohibitively large sample size to do the association studies [15]. Therefore, computational tools that can predict the pathogenicity of rare variants are needed to help researchers find out those variants that may most likely to cause disease. Due to the demand, the development of the computational tools is flourished over the past few decades.
Based on the algorism of tools used, the scores from different tools can be divided into several types, such as conservation score, functional score, etc. Conservation score is a score that is used to measure evolutionary conservation at variants, such as Genomic Evolutionary Rate Profiling (GERP) score [16], PhyloP [17] score, etc. By contrast, the functional score is a score for predicting whether an amino acid substitution affects protein function, such as SIFT [18], PolyPhen-2 [19], etc. Besides, there also have some tools used ensemble method, like random forest, combine either or both conservation score and functional scores as a feature to predict the deleteriousness of nucleotide variants, such as Combined Annotation Dependent Depletion (CADD) [20], Rare Exome Variant Ensemble Learner (REVEL) [15], etc. The summary table of the predictive scores from common tools was shown in Table 2.
Although there are many computational tools have been built, the high reliance on pathogenicity assertions from existing databases cause the inaccurate and incomplete of those predictive scores. Therefore, the demand of an accurately predict tool still remain.
Table 2. Characteristic of the predictive score from common tools. The predicted
score can be divided into conservation score, functional score, etc. If the predictive score was built based on several scores, it will be classified to “Other”.Conservation score Functional score Other
GERP++ O
SiPhy O
phyloP O
phastCons O
SIFT O
PolyPhen-2 O
LRT O
MutationTaster O
MutationAssessor O
REVEL O
CADD O
VEST O
FATHMM O
1.6. Gene expression
Gene expression is the process of synthesizing gene products with the information form a gene. These products are often proteins, but sometime is a functional RNA, such as transfer RNA genes. There are several steps in the gene expression process, including the transcription, RNA splicing, translation, and post-translational modification of gene products.
Transcription is the process that produces the RNA copy of the DNA which follow the complementarity law of the bases. In eukaryotes, transcription of protein-coding genes will create a primary transcript of RNA (pre-mRNA) which has to undergo RNA splicing to become a mature mRNA. For non-coding RNA the mature RNA is the final gene product, but for mRNA, the translation is proceeded to produce a specific amino acid chain based on the mRNA codons. Finally, the post-translational modification of a protein, like protein folding, to regulate the activity and function of the protein.
The process of gene expression mentioned above is used by all known life, such as eukaryotes. At different time, environments, as well as different tissues may have different gene expression. The level of gene expression not only regulates the structure and function of cells but also is a basis for cell differentiation, morphogenesis, etc.
Therefore, measuring the level of gene expression, such as RNA of protein levels, will help researcher to create a global view of the cell function. There are several method can
be used to get gene expression levels, like RNA Sequencing (RNA-Seq). RNA-Seq, a high throughput technology also called whole transcriptome shotgun sequencing [21], can be used to construct a comprehensive picture of the transcriptome [10].
A typical RNA-Seq experiment include library preparation, sequencing, data acquisition and analysis. During the library preparation, total RNA or mRNA is extracted from the cells and reverse transcribe into cDNA. Randomly breaking the cDNA sequences into fragments of shorter length which is based on the platform users used.
Sequencing all the fragments to obtain raw data, also called raw reads. Finally, analyzing the result of short-reads. Expression can be quantified for exons or genes using contigs or reference transcript annotations [22]. Therefore, to build the gene expression profiles of the target cells or tissues, the reads is aligned to reference genome or transcript. When we obtained the read counts, the read counts should be converted into appropriate metrics, like Fragments Per Kilobase of transcript per Million (FPKM) and Reads Per Kilobase per Million mapped reads (RPKM). These results of the observed RNA-Seq can be used for hypothesis testing and other analyses.
2 Materials and Methods
2.1. Overview of VariED
The name of VariED consists of three words, Variants, gene Expression, and Database, with the meaning of diverse. In this study, we name this database with the same word to represent VariED has diverse data and can provide a comprehensive service.
VariED is a database of variants annotation and phenotype, population allele frequency from several project and gene expression profiles data from different tissues.
It is established to provide the information of variants and tissue-based gene expression profiles, in order to let researchers easy analyze their data and save time on querying.
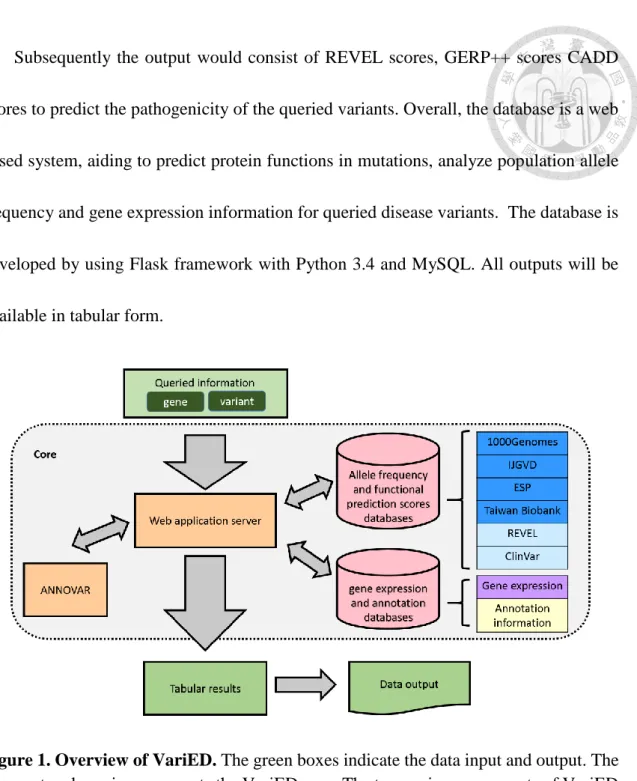
An overview of VariED database system is illustrated in Figure 1. It is a broadly accessible data collection and processing platform, consisting of variant information that is integrated from existing online resources. In brief, VariED is constituted of several components, mined and integrated from multiple public sources, acting as a central hub for organized genome information. The database contains information such as population allele frequency, gene expression profiles from human, mouse, and zebrafish to reflect the relationship between gene expression and genetic variations in a specific organ. The database schema of the two databases, Allele frequency and functional prediction scores database and gene expression and annotation database, was shown in Figure 2 and Figure 3, respectively.
Subsequently the output would consist of REVEL scores, GERP++ scores CADD scores to predict the pathogenicity of the queried variants. Overall, the database is a web based system, aiding to predict protein functions in mutations, analyze population allele frequency and gene expression information for queried disease variants. The database is developed by using Flask framework with Python 3.4 and MySQL. All outputs will be available in tabular form.
Figure 1. Overview of VariED. The green boxes indicate the data input and output. The
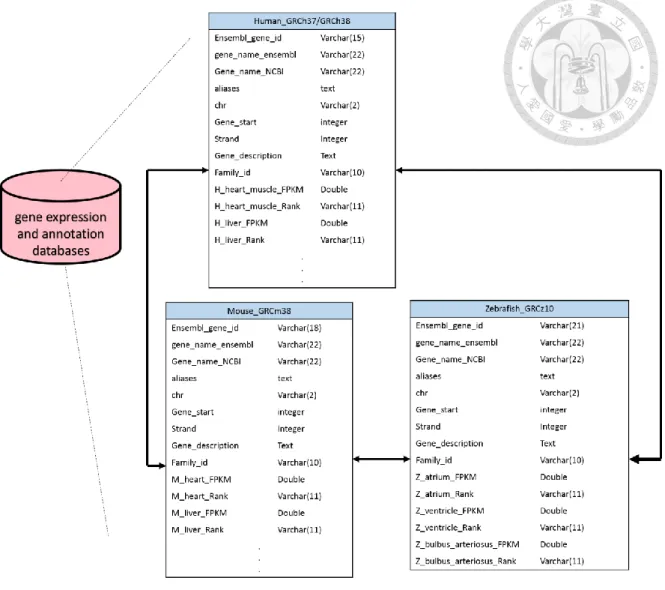
grey rectangle region represents the VariED core. The two major components of VariED (orange boxes) are the web application server and ANNOVAR. The upper cylinder is constituted by 4 allele frequency tables (blue boxes), 1 REVEL score table and 1 ClinVar table (Cyan box), whereas the lower cylinder is constituted by the gene expression profiling table (purple box) and annotation information table (yellow box).Figure 2. The database schema of gene expression and annotation database.
Currently, the gene expression and annotation database was consist of 4 tables, Human_GRCh37, Human_GRCh38, Mouse_GRCm38 and Zebrafish_GRChz10. To reduce the querying time, gene annotation and gene expression were combined into one table. The family_id was used as a key to link these 4 tables.
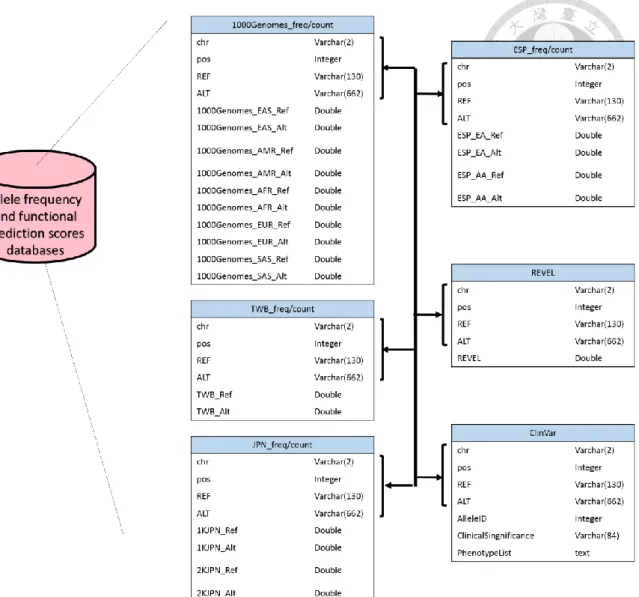
Figure 3. The database schema of allele frequency and functional prediction scores
database. The allele frequency and functional prediction scores database was consist of
10 tables, 1000Genomes_freq, 1000Genomes_count, ESP_freq, ESP_count, JPN_freq, JPN_count. TWB_freq, TWB_count,REVEL and ClinVar . The 10 tables were linked by chr, pos, REF and ALT.2.2. Dataset collection and processing
Presently VariED has information content for three species, namely, Homo sapiens (GRCh37/GRCh38), Mus Musculus (GRCm38) and Danio Rerio (GRCz10). The annotation information of each species were obtained from Ensembl (Release 86). Gene aliases information were obtained from NCBI gene info (October 28, 2016). The gene expression profiles of human tissues are obtained from RNA gene data of The Human Protein Atlas (October 15, 2015) [23]. This data contained the RNA levels in 32 tissues based on RNA-seq. For mouse, the gene expression profiles were obtained from E- GEOD-74747 which contained the RNA levels in 8 tissues from an adult male C57BL/6 mouse (February 17, 2017) [24] as recorded in Expression Atlas [25]. In order to build the gene expression profiles of zebrafish tissues, we retrieved the RNA-Seq data from zebrafish heart with an accession number SRX1153632, SRX1153633, and SRX1153634 [26]. For alignment, all the three RNA-seq data are aligned to GRCz10 version of zebrafish genome using Tophat2 v2.1.1 [27]. After that, we use Cufflinks v2.2.1 [28] to calculate fragments per kilobase of exon per million fragments mapped (FPKM) in RNA- Seq data. In summary, all the value of gene expression profiles from different tissue and different species were saved as a FPKM value with its rank in the database. The tissues which had integrated in the database of VariED was shown in Table 3.
Sources of population allele frequency information are NHLBI GO Exome Sequencing Project (ESP) [29], 1000 Genomes Project Phase 3 [30], Tohoku Medical
Megabank Project (TMM) [31, 32] and Taiwan Biobank. 1000 genomes phase 3 data includes populations such as East Asians (EAS), American (AMR), African (AFR), European (EUR) and South Asian (SAS). Integrative Japanese Genome Variation Database (IJGVD), provides data of genomic variations obtained by whole-genome sequencing of Japanese individuals, who participate in the TMM. This database is a Japanese population reference panel providing variant allele frequency database from 1,070 Japanese individuals (1KJPN) and 2,049 Japanese individuals (2KJPN). NHLBI ESP consists of well-phenotyped populations in the United States, representing two
populations (African American (AA) and European American (EA)) with more than 200,000 individual’s altogether. Taiwan Biobank provides allele frequencies to query variants pertaining to Taiwanese population. The sample size of each population was show in the Table 4.
To predict the pathogenicity of variants, Rare Exome Variant Ensemble Learner (REVEL) scores (June 3, 2016) [15], Combined Annotation Dependent Depletion (CADD) scores (release v1.3) [20] and Genomic Evolutionary Rate Profiling (GERP) scores [16] were collected.
The information of the relationships among human variations and phenotypes was obtained from ClinVar [33, 34]. Additionally, ANNOVAR [35] is utilized to include functional annotation for user queried variants. In gene-based annotation, we use Ensembl genes to identify whether SNPs or CNVs cause protein coding changes and the amino
acids that are affected. In filter-based annotation, the GERP++ annotation database is used to elute the GERP scores.
Table 3. The list of tissues which had integrated in VariED.
Species Tissue Replicates
Homo sapiens Adipose tissue 7
Adrenal gland 6
Appendix 6
Bone marrow 8
Cerebral cortex 3
Colon 8
Duodenum 4
Endometrium 9
Esophagus 6
Fallopian tube 6
Gallbladder 7
Heart muscle 9
Kidney 8
Liver 5
Lung 8
Lymph node 13
Ovary 5
Pancreas 4
Placenta 7
Prostate 7
Rectum 4
Salivary gland 6
Skeletal muscle 6
Skin 6
Small intestine 8
Smooth muscle 3
Spleen 5
Stomach 4
Testis 8
Thyroid gland 9
Tonsil 3
Urinary bladder 6
Mus Musculus Brain 1
Heart 1
Kidney 1
Liver 1
Lung 1
Spleen 1
Testis 1
Thymus 1
Danio Rerio Atrium 1
Bulbus arteriosus 1
Ventricle 1
Table 4. The sample size of each population. Currently, VariED integrated population
allele frequency from four databases.2.3. Identify aliases and orthologs
In Expression Profiles service, ensembl gene id and gene symbol were the available identifier for users to query gene expression profiles and annotation in the database. For ensemble gene id, a unique id, can be used to find the target gene directly.
However, for gene symbol, it’s hard to find the target. One of the challenges associated with querying gene symbols is the inconsistency of gene names that exists between different species. For example, COX, COX8, COX8-2, COX8L could be the aliases of the same gene, COX, for different species. To circumvent this ambiguity, VariED unifies gene symbols from Ensembl gene symbol, NCBI gene symbol, and NCBI aliases, and
Population Source Sample size
EAS 1000 Genomes Project 504
EUR 1000 Genomes Project 503
AFR 1000 Genomes Project 661
AMR 1000 Genomes Project 347
SAS 1000 Genomes Project 489
EA NHLBI ESP 4300
AA NHLBI ESP 2203
Japanese IJGVD 1KJPN 1,070
Japanese IJGVD 2KJPN 2,049
Taiwanese Taiwan Biobank 16,036
EAS: East Asians; EUR: European; AFR: African; AMR: American; SAS: South Asian; EA: European American; AA: African American; ESP: Exome Sequencing Project; 1KJPN: 1,070 Japanese individuals; 2KJPN: 2,049 Japanese individuals.
searches queried variants in the specified order. For such scenarios, VariED uses gene family ID to search for the gene in different species and their corresponding tissues, as specified by the user.
To identify orthologs, protein-coding genes of human, mouse, and zebra fish were downloaded from Ensembl (release 86). The sequence of the longest isoform each selected to represent the gene for each species while the protein isoforms exist. The all- vs-all BLASTP was applied to align all protein sequences of the three species with E- value thresholds smaller than 1e-5. To examine orthologous genes among the interesting species, the OrthoMCL (version 2.0.9) [36] was performed to classify gene families.
Consequently, we obtained a total of 16,239 gene families.
2.4. Index system
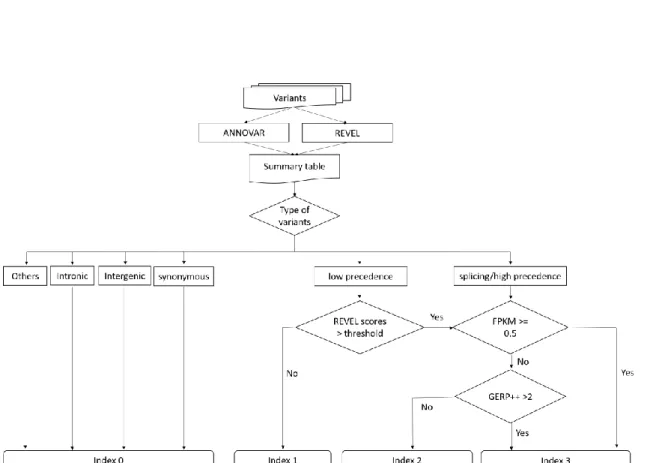
The Variants Search service provides users abundant information, such as tissue- based gene expression profiles, the annotation of user queried variants, population allele frequency, functional prediction scores, and phenotype of the variants. Although the integrated information about variations saves the time on querying, a great amount of information makes it difficult for users to quickly find out pathogenic variants. In order to help users quickly find out the important variants from their queried variants, Variants Search gave each variant an “index”, which could categorize variants to identify likely pathogenic variants with respect to their functional consequence.
There are four index values in index system, index 0, index 1, index 2, and index 3. Each index value was built based on the type of variant, REVEL score, GERP++ score, and gene expression level in heart muscle of human. The detail condition used to classify each index value of the variant was shown in Table 5. For intronic, intergenic and synonymous variants, these variants are often considered silent mutation will be given index 0. Variants Search not only used the annotation information but also used the functional prediction scores, REVEL scores and GERP++ scores as criteria. Currently, two thresholds of REVEL scores can be used as a criteria to build an index of variant, 0.5 and 0.75. According to REVEL manual, 75.4% of disease mutations, 10.9% of neutral variants and 12.4% of all exon sequence variants have a REVEL score above 0.5. By contrast, 52.1% of disease mutations, 3.3% of neutral variants and 4.1% of all exon sequence variants have a REVEL score above 0.75. Using the threshold of REVEL scores users choose, if the REVEL scores of nonsynonymous variants, nonframeshift insertion, nonframeshift deletion or nonframeshift substitution below threshold, they will be given index 1. Similarly, if the REVEL scores of those variants above the threshold, they will be given index 2.
The splicing variants or the frameshift insertion, frameshift deletion, frameshift substitution, stopgain or stoploss variants will also be given index 2. Finally, if the variants had been given index 2 and the gene expression value (FPKM) in heart tissue of the variants was above 0.5 or the GERP++ scores above 2 will be given index 3.
Table 5. The index system. Default threshold is 0.5; For user higher specificity, the
threshold can be set to 0.75; index = 3 , if a variant meets the criteria of index 2 and if for the variant, the expression value (FPKM) is above 0.5 or the GERP++ score of this variant more than 2.1low precedence: nonframeshift insertion, nonframeshift deletion, nonframeshift substitution and nonsynonymous SNV; 2high precedence: frameshift insertion, frameshift deletion, frameshift substitution, stopgain, stoploss
2.5. Methods
2.5.1. Function 1 : Expression Profiles
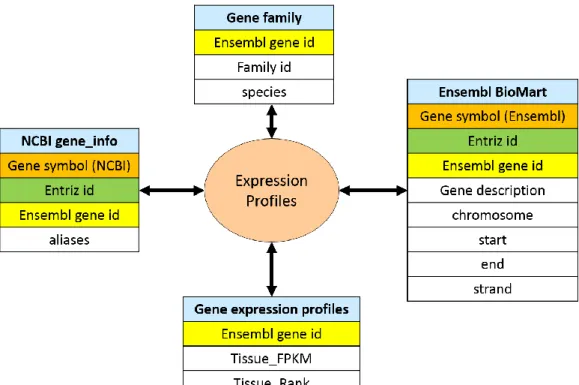
This function is for users to query gene annotation and tissue-based gene expression profiles. For the purpose of checking gene expression in a specific tissue, we built this function to provide an easy-achievable RNA-seq derived gene expression profiles data searching engine. Besides, based on Ensembl coordinate system, the gene annotation was provided. The function interface supported two type input data: gene symbol and Ensembl gene id. The inconsistency of gene names that exists between different species is one of the challenges associated with querying genes. In order to deal with the gene aliases, we download the gene_infor table from NCBI. Then, according the gene symbol, Entriz id and Ensembl gene id combine the gene_info table with Ensembl BioMart table (Figure 4). To circumvent this ambiguity, Expression profiles unifies gene symbols from Ensembl
Index Condition
0 intronic or intergenic or synonymous 1 low precedence1 or Revel score < threshold
2 high precedence2 or splicing or (low precedence & Revel score > threshold) 3 Index 2 and (expression value (FPKM) >= 0.5 or GERP++ score > 2)
in the specified order. For such scenarios,Expression profiles uses gene family ID to search for the gene in different species and their corresponding tissues, as specified by the user.
While conducting functional assay, expression labels from heart might not be available for human, hence, model organisms are used as an alternate source for human expression labels. For medical practioners it is especially challenging to locate such alternate expression labels. For advantage of such users and others, VariED has a readily available integrated cross species mRNA and protein expression labels, derived from the two most important model organisms, zebra fish and mouse, using gene family as the connecting link between genes across different species.
Figure 4. Relation Diagram of Expression Profiles. The four table were integrated by
Gene symbol, Entriz id and Ensembl gene id.2.5.2. Function 2 : Variants Search
Variants Search is for users to query the gene expression profiles, allele frequency or allele count, functional predict scores and clinical interpretation according to their chromosomal coordinates of variants or Variant Call Format (VCF). We extracted the chromosomal coordinate, reference allele and alternative allele information from users’
query. PyVCF, a Python module, was used to extract the necessary information from VCF files. Following the options, users had selected, querying the databases. Furthermore, ANNOVAR was used to annotate the users’ query. The information of variants was integrated and used to build the index for each variants. The results of Variants Search will show in several tabs with several table. We also connected to other databases, like ensembl, NCBI, NHI and ClinVar, by using Uniform Resource Locator (URL).
Additionally, all the results can be download as a csv file.
The workflow of Variants Search was shown in Figure 5. Users’ query would be annotated by ANNOVAR and be mapped to the REVEL table in the database to get the REVEL scores. The type of variants is one of the criteria to build the index of the variants.
Intronic, intergenic and synonymous variants will have index 0. For low precedence variants, such as nonframeshift insertion, nonframeshift deletion, nonframeshift substitution or nonsynonymous variants, which with REVEL scores below the threshold, will have index 1. For those low precedence variants, which with REVEL scores above
deletion, frameshift substitution, stopgain, stoploss variants, if the variants are in a gene with heart expression value (FPKM) above 0.5 or GERP++ above 2, they will have index 3; otherwise, index 2. The other type of variants will have index 0.
Figure 5. Workflow of Variants Search. Depend on the type of variant, REVEL score,
GERP++ score and heart tissue gene expression profiles, index system will give every variant an index. low precedence: nonframeshift insertion, nonframeshift deletion, nonframeshift substitution and nonsynonymous SNV; high precedence: frameshift insertion, frameshift deletion, frameshift substitution, stopgain, stoploss3 Results
VariED is a web-based database system which is implemented by using Flask framework with Python 3.4 and a MySQL database management system with a jQuery grid plugin. Figure 6 showed a screen shot of the home page of VariED. The navigation bar showed the two major services providing by VariED, Expression Profiles and Variants Search. The Expression Profiles service provides gene annotation and tissue- based gene expression profiles from the queried genes. The gene expression profiles of orthologous genes are shown in the specified species. In Variants Search service, providing queried variants with chromosomal coordinates or a VCF file to obtain the functional annotation and endogenous gene expression profiles of the variants, population allele frequency, and functional prediction.
Figure 6. The screen shot of the home page of VariED.
3.1. Example 1: Finding out pathogenic variants, which cause Brugada Syndrome
Brugada syndrome is an inherited heart rhythm disturbance disorder characterized by abnormal electrocardiogram (ECG) findings. People with Brugada syndrome may have an increased risk of sudden cardiac death [37]. In additionally, Brugada syndrome causally related to SCN5A mutations in around 20% of cases [38]. Table 6, listed an example of 3 variants from gene SCN5A and were reported to have related to Brugada syndrome [39-41]. We used these three variants to show the ability of Variants Search in finding target disease-related variants.
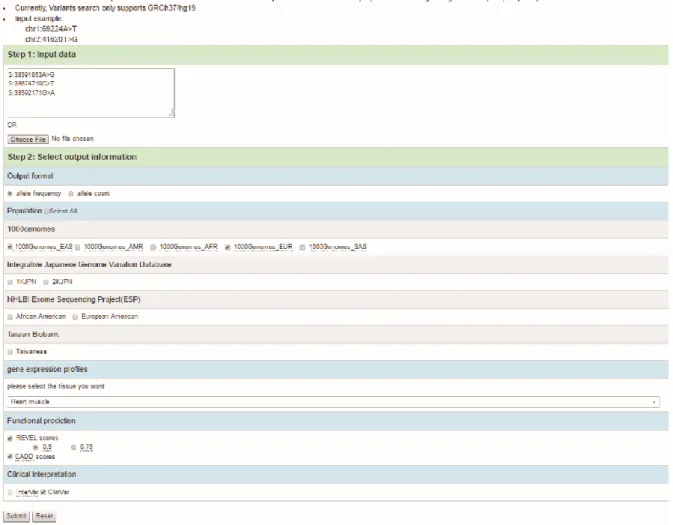
In the Variants Search, users can input such multiple variants from single gene or multiple genes by using chromosomal co-ordinates of variants or by uploading VCF files for obtaining a description of the genes, its’ frequency or count, REVEL scores and the phenotype. The screenshot of Variants Search interface was shown in Figure 7. Following the two steps in the interface, inputted the three variants shown in Table 4 and selected several options for querying databases.
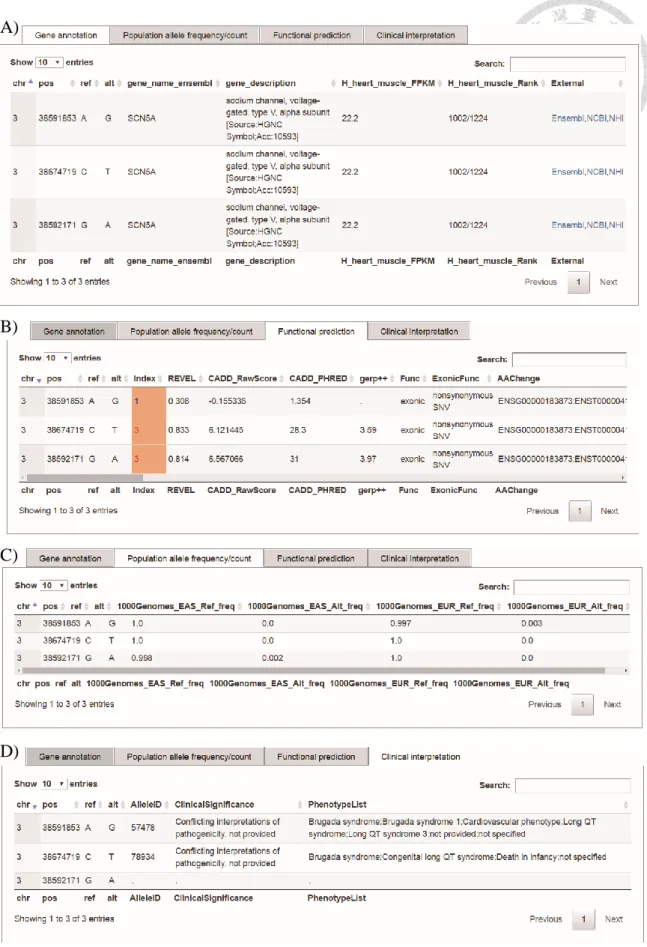
The result of this example was shown in Figure 8. The integrated results will be split into four parts, gene annotation (Figure 8A), population allele frequency/count (Figure 8B), functional prediction (Figure 8C) and clinical interpretation (Figure 8D).
This result reveals that the three variants are in the gene SCN5A which will express in heart muscle. Besides, the population alternate frequency of each variants is lower than
5% which means that all the three variants are rare variants. Additionally, all the variants were nonsynonymous single-nucleotide variant (SNV). 3:38591853A>G is a variant with index 1 and REVEL score (0.308) below 0.5. The others are the variants with index 3 and REVEL scores above 0.5. Furthermore, other prediction tool, CADD, also gave these two variants a positive raw score, 6.12 and 6.56 respectively, which means the variant is more likely to be not observed and therefore more likely to have deleterious effects. The other CADD score, phred-like score of these two variants are 28.3 and 31 respectively.
According to the CADD reported, only top 1% of single nucleotide variants have 20 phred-like score. This also points out that these two variants are more likely to be a pathogenic variant.
In the clinical interpretation (Figure 8D), two of the variants have the reported in ClinVar show that the variants may have relate with brugada syndrome. Results are displayed in tabular format which can be downloaded as a .csv file
Table 6. Example of variants from genes to be queried using VariED.
Variants Gene PubMed ID
3:38591853A>G SCN5A 18456723
3:38674719C>T SCN5A 11901046
3:38592171G>A SCN5A 26173111
Figure 7. Screen shop of Variants Search.
(A)
(B)
(C)
(D)
Figure 8. Screenshots of the results from the Variants Search. In Variant Search
service, providing queried variants with chromosomal coordinates or a VCF file to obtain the (A) functional annotation and endogenous gene expression profile of variants, (B) population allele frequency, (C) functional prediction in protein structures, and (D)3.2. Example 2: Using queried variants search for gene annotation information and find pathogenic variant
NGS is a high-through-put technologic which allows us to detect more than millions of variants at one experiment. However, the large number of variants make it infeasible to do the experimental validation. In order to effectively find out the pathogenic variants, a computational tools that can predict the pathogenicity of variants are in needed.
Whereas there a lot of pathogenic predict scores and each in different scale make it difficult to understand the pathogenicity of the variants. We built the index system. Each index like a bookmark which can classify user queried variants base on the type of variants and predict scores. We collected variants from published reports [40, 42, 43] and ClinVar to implement this example. Table 7, lists an example of 5 variants from each of gene GAPDH and SCN5A, stating their chromosomal coordinates, functional categories, clinical significance and phenotype. These ten variants consisted of 2 intronic, 1 splicing, 5 nonsynonymous and 2 synonymous variants. Three of ten variants have phenotype record in ClinVar. The result of Variants Search was shown in Table 8. There were three variants have Index 3 which also were reported as a disease variant. All these three variants have higher REVEL scores and GERP++ scores. This information also showed that the variant has a higher percentage of trees in the REVEL random forest that classified the the variants as pathogenic. Besides, the higher GERP++ scores also showed
that the variant was evolutionary conservation. Additionally, the three variants were splicing or nonsynonymous SNV which were general considered may affect protein function. These results are consistent with previous literature. Variant chr3:38645420T>C, which was reported to have associated with Brugada syndrome in ClinVar records, was given index 1. This variants were a well know neutral variant [44].
This result also consistent with previous literature. Overall, by using index, users can easily found out those pathogenic variants from the large number of variants.
Table 7. An example of 5 variants from each of gene GAPDH and SCN5A.
Table 8. The result of Variants Search.
3.3. Example 3: Using heart tissue gene expression profiles information to filter the candidate gene in heart diseases.
Chromosomal
Coordinates Gene
Functional Categories
Clinical
Significance Phenotype
chr12:6646557G>A GAPDH Splicing NA Schizophrenia[42]
chr12:6644722A>G GAPDH Intronic NA NA
chr12:6647109T>C GAPDH Exonic (synonymous)
NA NA
chr12:6646937C>T GAPDH Exonic (nonsynonymous)
NA NA
chr12:6646831C>T GAPDH Exonic (nonsynonymous)
NA NA
chr3:38645420T>C SCN5A Exonic (nonsynonymous)
Benign/Likely benign
Brugada syndrome chr3:38674796C>T SCN5A Exonic
(nonsynonymous)
NA Brugada
syndrome[43]
chr3:38622384C>G SCN5A Intronic Benign not specified chr3:38622602C>T SCN5A Exonic
(synonymous)
Benign not specified chr3:38674719C>T SCN5A Exonic
(nonsynonymous)
Conflicting interpretations of pathogenicity
Brugada syndrome[40]
Chromosomal
Coordinates Gene
Heart muscle FPKM
Heart muscle
Rank REVEL Index GERP++ Func ExonicFunc
chr12:6646557G>A GAPDH 1799 30/1224 . 3 4.02 splicing .
chr12:6644722A>G GAPDH 1799 30/1224 . 0 . intronic .
chr12:6647109T>C
GAPDH 1799 30/1224 . 0 . exonic
synonymous SNV chr12:6646937C>T
GAPDH 1799 30/1224 0.09 1 4.98 exonic
nonsynonymous SNV chr12:6646831C>T
GAPDH 1799 30/1224 0.022 1 3.91 exonic
nonsynonymous SNV chr3:38645420T>C
SCN5A 22.2 1002/1224 0.291 1 2.44 exonic
nonsynonymous SNV chr3:38674796C>T
SCN5A 22.2 1002/1224 0.821 3 4.37 exonic
nonsynonymous SNV
chr3:38622384C>G SCN5A 22.2 1002/1224 . 0 . intronic .
chr3:38622602C>T
SCN5A 22.2 1002/1224 . 0 . exonic
synonymous SNV chr3:38674719C>T
SCN5A 22.2 1002/1224 0.833 3 3.59 exonic
nonsynonymous SNV
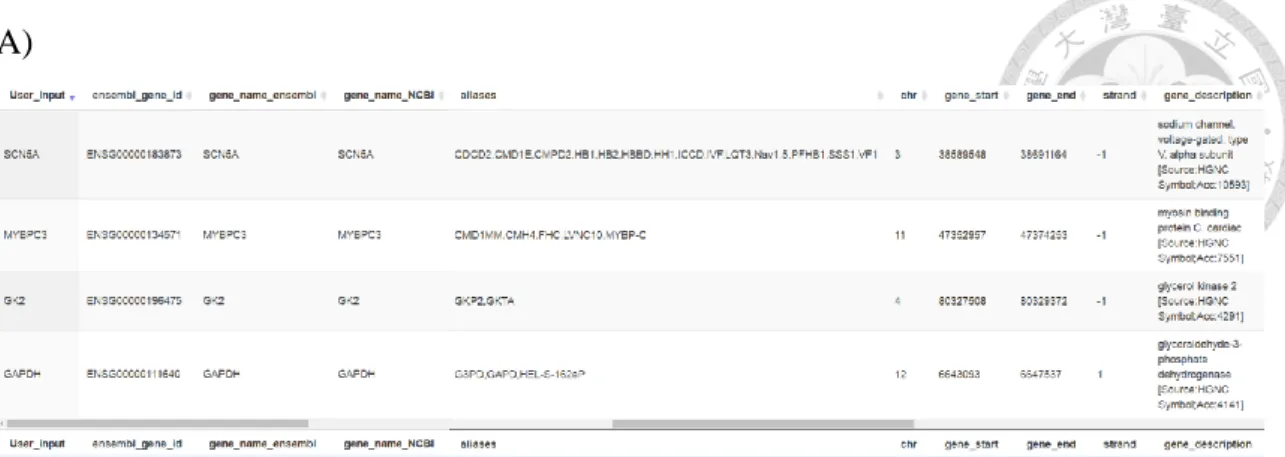
VariED integrates gene expression profile information from heart tissues of three species (human, mouse and zebrafish). With the integrated gene expression information, users can filter candidate gene to confirm those with expression in heart tissue. The screenshots of the Expression profiles was shown in Figure 9 below. Based on the reference genome users select, the gene relationship in difference species was built. Users can submit such a batch gene or multiple tissue query using a list of gene symbol or Ensembl gene ID.
In this example, we used 4 genes to display one of the usages of Expression profiles. Sodium voltage-gated channel alpha subunit 5 (SCN5A) is the gene that encodes the cardiac sodium channel Nav1.5, mainly expressed in the heart. Gene Glyceraldehyde- 3-phosphate dehydrogenase (GAPDH) is a housekeeping gene, a member of the glyceraldehyde-3-phosphate dehydrogenase protein family and is expressed in all tissues.
Myosin binding protein C, cardiac (MYBPC3), a heart enriched gene, functions to regulate phosphorylation of the cardiac isoform in vivo by cAMP-dependent protein kinase (PKA) upon adrenergic stimulation. Glycerol kinase 2 (GK2), a testis enriched gene [23] and a key enzyme in the regulation of glycerol uptake and metabolism [45]. The result of expression profiles displayed annotations of the queried genes and expression values of each selected tissue as shown in Figure 10. Clicking the orthologs button can display expanded information (Figure 10C).
The result of this example reveals that the differences in the gene expression profiles between heart and testis. MYBPC3 has a higher expression level in human heart muscle (543.4 FPKM, top 3%) and mouse heart (259.7 FPKM in average); however, the expression was lower in both human (0.6 FPKM) and mouse testis (0.0 FPKM in average). On the contrary, GK2 has a higher expression level in both human (69.3 FPKM, top 50%) and mouse testis (342.0 FPKM in average);whereas, it lower in the human heart muscle (0.0 FPKM) and mouse heart (0.0 FPKM in average). We can also find that the gene GAPDH both have higher expression level in heart muscle and testis. The FPKM value of SCN5A in heart muscle of human was 22.2 and 0.3 in testis of human. Comparing with the abundance criteria of FPKM value in human from Proteinaltas (Table 9), SCN5A was medium abundance in heart muscle of human, but not detected in testis of human.
GAPDH was high abundance in human heart muscle and testis. MYBPC3 was high
abundance in human heart muscle, but low abundance in human testis. By contrast, GK2 was high abundance in human testis, but not detected in human heart muscle.
Overall, by using the value of FPKM or the rank of FPKM in database, users can easy to find out which gene will express in heart tissue. All results can be sorted and are downloadable as csv or excel files.
Figure 9. Screenshots of the Expression profiles.
Table 9. The abundance criteria of FPKM value in human.
Abundance FPKM tissue
Not detected 0-0.5
Low 0.5-10
Medium 10-50
High 50<
(A)
(B)
(C)
Figure 10. Screenshots of the result of Expression profiles. Results with the version
of annotation (A) for the user selected tissue (B). Clicking the orthologs links to display3.4. Performance of index system
In the Variants Search service, an index system was built based on the type of variant, REVEL score, GERP++ score, and the gene expression profiles of heart muscle in human.
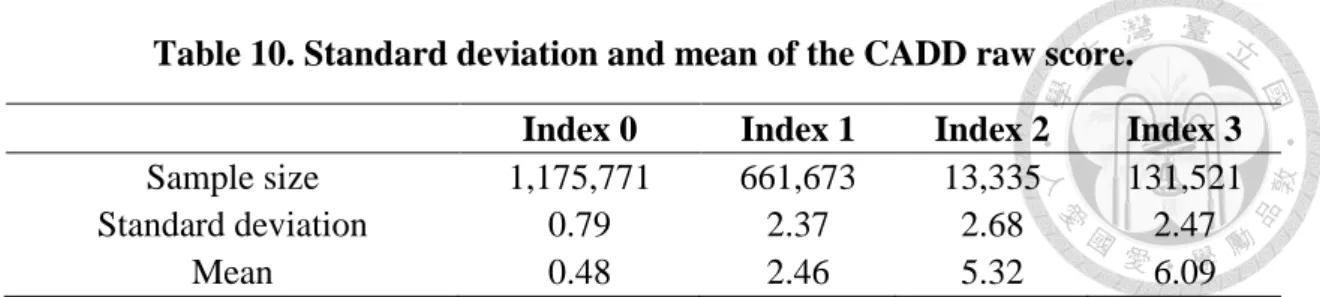
In order to know the performance of index system, we obtained 1,998,038 variants from ESP and gave each of them an index. Then observed the distribution of CADD scores for variants from index 0 to 3. The standard deviation and mean of CADD raw score and CADD phred-like score were shown in Table 10 and Table 11 respectively. From these results, we can find that as the index value increases, the two CADD score also gradually increase. Besides, we used R package, polycor, to find the polyserial correlation between index value and CADD score. The polyserial correlation between Index and CADD raw score and between index and CADD phred-like score was 0.53325 and 0.40674 respectively with sample size 1,982,300. Index and two CADD scores were medium correlation. In other words, index just like a variant analysis tool can also be used to find out pathogenic variants, but it's a little different with those tools. Index system considers tissue-based gene expression profile factor.
Table 10. Standard deviation and mean of the CADD raw score.
Table 11. Standard deviation and mean of the CADD phred-like score.
Index 0 Index 1 Index 2 Index 3
Sample size 1,175,771 661,673 13,335 131,521
Standard deviation 0.79 2.37 2.68 2.47
Mean 0.48 2.46 5.32 6.09
Index 0 Index 1 Index 2 Index 3
Sample size 1,175,771 661,673 13,335 131,521
Standard deviation 5.14 9,81 8.46 6.50
Mean 6.68 16.27 26.05 28.34