The 4rd National Conference on Hydrogen Energy and Fuel Cell December 18-19, 2009, Taipei
A1-1
RESOURCE COMPLEMENTARITIES FOR EMERGING TECHNOLOGY VALUE EXPLOITATION: THE CASE OF FUEL CELL TECHNOLOGY
Seng-Su Tsanga, Tzyy-Jane Layb
a. National Taiwan University of Science and Technology Department of Business Administration
b. Yuan Ze University
Department of International Business Email: tsang@mail.ntust.edu.tw (Seng-Su Tsang)
ABSTRACT
Effective exploitation of technology values is subject to the complementarities of organizational resources. The present study used the emerging Fuel Cell technology as an example to show that firms in the Fuel Cell industry may exploit the value according to their organizational resources with respect to their technology development approaches and patenting strategies.
Of the investigated firms we observed imparities between a firm’s book value and the market value, and concluded with two types of exploitation behavior: One tends to use patents to defend their leadership in the product market (where the value imparity is reduced) as a result their technology is constrained within a firm’s boundaries. The other tends to generate profit by selling or licensing their technologies (where the value imparity is widened). Managerial implications are drawn according to the findings.
Keywords: Patent, Resource Complementarity, Value Exploitation
1. Introduction
For the transaction of IPs (Intellectual Properties) such as patents, on the one hand as “Arrow (1962) pointed out that a potential licensee would naturally wish to verify the quality of the invention before paying for it. However, once the inventor discloses the invention, the potential licensee would have little inventive to pay for it. (Arora and Ceccagnoli, 2006, p. 293).”
On the other hand, licensee may be afraid of being holdup with licensor’s IPs. For instance, when enhanced version comes out licensor may charge a high premium to replace earlier one, particularly when the utilization of licensed IPs require investments on specialized assets. Therefore to strengthen the transaction market, it may require a reduction of the double- side moral hazards. The present study postulated that firms As production factors switch from tangible labor, land and capital inputs to intangible technology and knowledge inputs, the latter have taken a large share of firms’ strategic attention.
To compete in this new battle, firms not only need to focus on the accumulation of strategic assets but also utilize those assets optimally. Amit and Schoemaker [1] show that firms adopt R&D strategies to achieve favorable patent portfolios due to the uniqueness of the resources they own. This patent portfolio helps to reduce the costs and time consumption to achieve valuable innovation. In other words, the cause and effect relationship between a firm’s value and their owned intangible assets (e.g. patents) is almost indisputable. Nevertheless, this understanding is far from appreciation in the evaluation of the contribution of intangible assets to a firm's value. The present study aims to provide a strategic perspective on how firms in the Fuel Cell industry implement patenting strategies in light of their complementary resources.
Fuel Cell technology was widely recognized as one of the top four important technologies (biology, Nano, and information technologies) of the new century. This technology was firstly developed in the US in the 1970s. Japan caught up with the US in the 1980s. In the 1990s, Canada, as well as several European countries, started to participate in developing relevant technologies. The high price of crude oil nowadays and the accordance of the Kyoto Protocol on carbon-dioxide emissions both encourage the development of green energies.
The Fuel Cell’s environmental friendliness has attracted much current research attention. As a result, the beginning of the new century is the right timing to observe its patenting activities.
Our empirical results show that Fuel Cell firms can exploit the value of their R&D activities through two different styles: product orientated or technology oriented. For product orientated firms (let’s call it “defender”), they choose to prevent their rivals from potential market leadership via imitation by limiting knowledge diffusion within the organization. To this end, firms choose to develop technologies that result in patents that would hinder their rivals’ from imitation activities. Also, defender style firms may need a large
fixed investment on tangible assets, such as land and machines, to utilize the developed techniques and produce an end product.
That is to say, this type of Fuel Cell firms would consolidate their technologies into a technical “defender” armed with portfolio patents with characteristics of high number of self- citing citations and low number of other-cited citations.
Another type of firm that is technology orientated (called a “persuader”) seeks to generate profit by persuading manufacturers to adopt their technologies. In this case, it is essential to develop technologies that have been adopted by relevant (downstream) firms. In the long run, knowledge- spillover may be beneficial for a firm by gaining the dominant position in supplying the required technologies. Consequently, these firms may try to profit by distributing developed technologies with a role of technology “persuasion” carrying patenting characteristics of high external citations and low self- citing ones. Due to the two orientations, it can be seen that the gap between market value and book value is wider for persuasion type firms than it is for the defender type.
The remainder of the article will be organized as follows. Section 2 reviews the relevant literature, Section 3 elaborates on the research methods, the results are shown in section 4 and the conclusions presented in the final section.
2. Literature review
This section will discuss literature that focuses on patenting factors that affect firm values. We begin by discussing patent counts and move onto patent citations. Concerning the citations, we go beyond straight citation counts and partition citations into four categories: self-citing, self-cited, other-citing and other-cited. The review ends by presenting the impact of the different citation categories on a firm’s values.
2.1. Patent counts
Research concerning a firm’s R&D activities influencing market value has been abundant in the past two decades, with most researchers motivated by the eminent work of Griliches [2], which adopted Tobin’s Q to measure firms’ market value with respect to patent number and R&D expenditure. This pioneering work focuses research attention on the effectiveness of patents and shows that a firm’s value is the result of its tangible and intangible assets, whilst intangible assets may partially and positively attribute to their past investments in R&D activities and the resulting patents. Pakes [3] analyzes the relationship between patents, R&D expenditure and stock performance, concluding that around 5% of stock value changes may be attributed to a firm’s R&D activities and the utilization of the achieved patents. Connolly and Hirschey [4]
adopt Thomadakis’ [5] approach (Thomadakis calls his approach the “relative excess valuation (EV) defined as
(market value-book value) sales”) to show the positive impact of a patent on firm value.
However, Narin et al. [6] show that the number of patents may reflect a firm’s leadership in technology but not necessary result in a positive financial performance. Cockburn and Griliche [7] revise the measures adopted by Griliches [2]
and include factors regarding innovation to evaluate the relationship between market value and the tangible and intangible assets. Cockburn and Griliche’s work shows that holding constant of the R&D specialty and endogenous variations of firms, the firm’s returns may still vary even when R&D expenditures utilize the same level of spending.
2.2. Patent citations
Ambivalent results concerning the above empirical findings regarding the influence of patents on firm value induce more studies of this topic. Griliches et al. [8] increased the sample size (340 firms) in order to include more independent variables (sales, employee numbers and investment amount) into the model. They found that the growth of the newly added variables and the firm’s R&D spending positively affect the firm’s returns. The addition to these new variables, they also reduced the number of correlations between R&D expenditure and other variables. Most importantly, Griliches et al.[8]
recognized the potentials of patent citation numbers by showing that this number exerts a positive impact on a firm’s financial performance. Meanwhile, Trajtenberg [9] also echoes this finding that a patent’s value positively correlates with the citation number of patents. Besides, Jaffe et al.’s [10] survey shows that cited patents are more valuable than patents without any citation. In addition to value, patent citation considerations have also motivated further research into citation behavior, such as Carpenter and Hart [11], who found that patents listed in RI100 attracted twice the citations of other patents outside the list; Trajtenberg [12] shows that there is a huge imparity between the US and Israel by comparing patent qualities in terms of citations.
To file patents, cited patents should be stated clearly in the application document to avoid infringement later on. This is also a crucial factor when patent referees grant the applicable boundaries of a particular patent. In light of this rigorous process, Hall et al. [13] concur that patent citations contain information regarding technology innovation activities, thus it is an indicative factor for weighting patents to reflect the imparities of quality among patents. In summary, they conclude a positive relationship between a firm’s market value and their patent citation numbers.
Recently, Breitzman et al. [14] conducted a comparison of patent count and patent citation analyses on patents owned by 12 leading pharmaceutical companies in the US and Europe. The results show that patent count fails to explain a firm’s technological leadership; instead, the cross citations that indicate that Merck acquire the edge in pharmaceutical technologies are close to practice. The above findings indicate that the patent citation count is superior to the
patent count for validating a patent’s quality and a firm’s technological competitiveness[15].
2.3. Self-citing and other-cited citations
Concerning patent application, it is mandatory that the applicant clearly illustrates the existing technologies or literature which his/her invention is based on. Once the patent application is granted it is likely to be cited to build new inventions. Thus, the citations of patents can be categorized into patent-citing and patent-cited, before and after the granting of the patent application. Besides, citations can also be categorized as self-citation and other-citation, according to the citation sources. Self-citations arise when citations are due to the inventers themselves, whereas other-citations arise when citations are made by others excluding the inventers. Since other-citations are made by others who cannot be manipulated by the patents’ inventers, they are viewed as an important indication of the power of the patent. That is to say, the more of the other-citations the larger their technological impact.
Nevertheless, the present study argues that both types of citations contain meaningful strategic implications and can deliver managerial impacts in different approaches. Jointly the two categories results in four types of citations: self-citing self- cited, other-citing and other-cited. Consequently, the present article provides strategic perspectives with respect to the four types of citations in the following.
2.4. Hypotheses—resource complementarities and patenting
The objectives of technology innovation are often multi-fold.
For example, it may help to gain protection from imitation in light of laws, acquire necessary complementary resources, enhance capabilities in imitating rivals’ technologies, or pursue the leadership on the technological edges, and so on. To these ends, certain patenting strategies are important and necessary:
for example, one can gain market exclusivity to deter followers (or rivals) by patenting critical technologies; or use patents to gain revenues via licensing as others step into the boundaries set up by other patents; or use patents as R&D performance measures to motivate R&D personnel [16].
To simplify understanding, we will begin with a novice condition where the market is composed of firms equipped either with or without complementary assets, such as marketing resources. For those equipped with complementary assets, they may take invented technologies as input production factors and share the goal of selling their final products -- product oriented firms. On the other hand, those who do not have complementary assets have no choice but to sell or license their invented technologies to generate profit -- technology oriented firms. For product-oriented firms, due to their revenues being gained by selling end products, it is essential for them to deter any harmful imitations by their rivals. Patents are one of the most powerful instruments to achieve this end.
Meanwhile, it is critical for leading firms to innovate as fast as possible to shake out their followers’ by-pass inventions. As a result, those leading firms with powerful patented technologies may take two patenting actions. Firstly, they use patents as one of the weapons to deter followers. When they choose a technology for patenting, its goal is to defend their territory;
therefore, knowledge-spillover benefiting followers due to the declaration of patent applications, is strongly prohibited.
Secondly, to speed up innovation it may be helpful to have knowledge diffused within an organization. Building new technology on those existing and owned technologies may help not only utilize those existing technologies but also strengthen technology leadership. In light of these two patenting actions, the first action is likely to cause a low score for other-cited citations and a high score for self-citing citations due to the second action. This is why we call the firms with these two characteristics “defenders.”
To verify our hypotheses, analysis of variance (ANOVA) was performed with the following independent variables:
For technology oriented firms, they generate revenue by selling or licensing. Therefore, it is critical to have technologies that are widely recognized by industrial users; that is, firms that don’t have critical technologies to compete with the leading players. To this end, technology oriented firms can choose to invent and patent technologies for the reason of solely selling or licensing them. These types of firms act as a persuader for those firms that choose not to develop the technologies by themselves.
From a strategic perspective, firms make choices in line with resources at hand. That is to say, firms may choose to match their patenting strategies with their own resources to optimize investment returns. In the present study, we hypothesize that a product oriented firm would choose to employ the “defender” style patenting strategy to match its resources in manufacturing and marketing whereas the technology oriented one would take the “persuader” style patenting strategy to compromise the lack of resources in manufacturing and marketing in order to achieve competitiveness with strong R&D capabilities.
3. Methods – data and variables
1. . Self-citing When applying for a patent, applicant has to state clearly the existing technologies and the literature the invention is based on. Self-citing depicts those cited patents that are owned by the same patent assignee; for the present case, it is the company that owns the patents.
2. . Other-citing This variable is similar to self-citing but with patents that are not owned by the same assignee.
3. . Self-cited The USPTO database provides information about citations made by other following patents once the patents are granted. A self-cited citation recodes the number of accumulated citations of a firm’s patents, cited in the following patents that are also owned by the same firms.
4. . Other-cited This variable is similar to the self- cited variable which recodes the accumulated cited citations that are made by other patent owners.
The dependent variable for ANOVA modeling is
“Market-to-book value ratio.” Market-to-book value is a ratio widely adopted in financial analyses [17, 18] for explaining business financial behavior. It is also attempted for the valuation of a firm’s intelligent assets [17-21]. Book value is the number calculated with the traditional accounting system;
that is, the balance sheet which recording the tangible assets such as machines and land. Hence, when the tangible assets are deducted from the market value, the rest might most likely reflect the value for the intangible assets. For comparison across firms, the following ratio with normalization is adopted in the present study.
The studied patents are collected from a database provided by the US Patent and Trademark Office. As online searching was made available after 1976, the present study took 1976 as the initial year to conduct the patent search. Up to 2001, there are 2269 patents classified in the H01M 008/00~H01M 008/24 category, which is the category concerning Fuel Cell technologies under the classification of the International Patent Classification (IPC).
Since the market-to-book-ratio is only available for public firms and can be acquired from the Compustat database, the 2269 data set is reduced to 1090 patents owned by 93 companies. Excluding those companies holding patents without any citations, the data set is furthermore reduced to 70 companies for analysis.
Market-to-book ratio=|
book value
book value -
ue market val
|
4. Analysis and results 4.1. Descriptive statistics
Our data range is for the patents between 1976 and 2001 that were granted in the US. According to the IPC definition on Fuel Cell technology, there were 2269 patents during this period. By matching with the Compustat database, of the 2269 patents, 1090 patents belong to 93 public companies in the US.
By excluding companies that do not have any citations, 70 companies were used for further analysis. The mean citations for self-citing is 0.62, 9.88 for other-citing, 0.58 for self-cited and 6.00 for other-cited. The mean value for the market-to- book ratio is 2.04.
4.2. ANOVA: Self-citing vs. other-cited
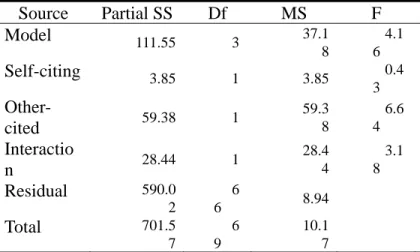
To verify our hypotheses regarding the patenting strategy fit (defender versus persuader) argument, we perform an analysis of variance on self-citing and other-cited factors. The results are shown in Table 1.
Table 1. Analysis of the variance results for the market-to- book-ratio on self-citing and other-cited citations
Source Partial SS Df MS F Prob > F
Model 111.55 3 37.1
8
4.1 6
0.0092**
*
Self-citing 3.85 1 3.85 0.4
3 0.5137
0.0122**
0.0791*
Other-
cited 59.38 1
59.3 8
6.6 4
Interactio
n 28.44 1
28.4 4
3.1 8
Residual 590.0
2
6
6 8.94
Total 701.5
7
6 9
10.1 7
Note. * represents p<0.1,** represents p<0.05, ***
represents p<0.01
The modeling in Table 1 attains significance at a 1%
level(F=4.16, p=0.0092, R2= 0.1590). The “self-citing” main effect is not significant (F=0.43, p=0.5137), however the
“other-cited” main effect is significant at a 5% level (F=6.64, p=0.0122). The interactive effect of the two variables, which is the primary concern of the present study, is significant at a 10%
level (F=3.18,p=0.0791). A t-test on the two cells (persuader vs. defender) of the interaction effect is conducted and the derived t-value is 1.50 (p-value=0.08). The mean value of the market-to-book-ratio for the persuader patenting style is 2.78 (standard deviation of 1.03) and 1.27 (standard deviation of
0.36) for the defender patenting style. Table 2 shows the statistical means for the four situations composed of the two self-citing and other-cited citations at both high and low levels respectively.
Table 2. The statistical means for the market-to-book-ratio with respect to the four situations composed of the two self-citing and other-cited citations
Other-cited
High Low
High 1.67 1.27 (defender)
Self-citing Low 2.78 (persuader) 1.68
4.3. Cases of defender style patenting strategy
Motorola is a well known enterprise in the US that specializes partially in communication products such as mobile handsets.
For Fuel Cell technology, Motorola is one of the leading companies specializing in portable fuel cells for mobile usage.
It particularly focuses on Direct Methanol Fuel Cell’s that can be employed as a power source for mobile phone handsets, PDA and such products. Motorola’s Fuel Cell related patents attain an average self-citing citation rate of 0.64 per patent (higher than the sample mean of 0.62), and an average other- cited citation rate of 2.86 per patent (lower than the sample mean of 6.00). Its market-to-book-ratio is 1.47 (lower than the sample mean of 2.04). It’s a typical defender style firm.
Daimler Chrysler (DC) is a well known German company that gained its brand equity largely in luxury automobiles. It produces more then four million automobiles yearly. Concerning Fuel Cell technology, DC is famous for its Proton-Exchange Membrane technologies. It helps DC to maintain a leading position in powering automobiles with Fuel Cell engines. Back in 1994, DC made the first prototype Fuel Cell car. Today, the technology has been applied to public transportation for a test run. DC is also allied with UPS, providing delivery vehicles for a test run in the city of Hamburg. The Fuel Cell patents owned by DC attain an average self-citing citation rate of 0.75 per patent (> sample mean 0.62) and an average other-cited citation rate of 4.42 (<
sample mean 6.00). Its market-to-book-ratio is 0.38 (< sample mean 2.04). It is another example of a defender style company.
4.4. Persuader style patenting strategy cases
Valence Technology (VT) is a US battery company operating.
The company specializes in lithium-ion polymer that is essential for materials used in rechargeable batteries. VT owns
several important Fuel Cell technology patents. VT is also a research partner in the area of backup powers for military uses for the US government. VT attains an average self-citing citation of 0.5 (< sample mean of 0.62) and other-cited citation of 11.5 (> sample means of 6.00). The average market-to-book ratio is 9.76 (> sample mean 0f 2.04). VT is a typical model of a company using persuader style patenting.
Another case is Imperial Chemical, which attains an average self-citing of 0 (< sample mean of 0.62) and other-cited of 8 (> sample mean of 6.00). Its average market-to-book ratio is 10.66 (> sample mean of 2.04). Texas Instruments also attains an average self-citing of 0 (< sample mean of 0.62) and other-cited of 7 (> sample mean of 6.00). Its average market-to- book ratio is 3.09 (> sample mean of 2.04). This is a typical example of a persuader style patenting company.
5. Conclusion
It is not uncommon for wide imparities between a firm’s book value and market value to exist. This is even more widely observed in the knowledge-based and technology intensive industries. A common explanation about this imparity is that the book value merely reflects the tangible assets owned by a firm, such as plants, equipments whereas, the market value includes not only those tangible assets but also intangible assets such as a firm’s brand, technologies, management capabilities [22-24].
Earlier studies have shown that the accumulation of patents does affect firms’ value. However, when holding constant of patent number, firms’ value still vary at a wide difference. This hints the existence of other affects besides patent counts. Thus, citations per patent are considered as weights for each patent. Nevertheless, patent owners who also play a critical role in exploiting the potentials of patents attract minimal attention. The present study shows that patenting strategies abided by firms’ complementary assets does induce different valuation concerns by both the market and shareholders.
For firms that hold complementary assets, such as marketing capabilities, may take a product orientation approach to generate profits by selling end products directly to buyers.
This approach may direct firms to use R&D resources to strengthen their leadership in the product market by building a technology “defender.” The defender is constructed with a number of patents developed and linked to each other. These patents carry two characteristics in low other-citied and high self-citing citations. For firms who lack complementary assets, they are likely to be limited in their ability to generate profits by selling or licensing technologies. As a result, their R&D resources may be spent on building leadership in technologies, which would attract the attention of firms who are short of competitive technologies to compete in the relevant product market. In other words, they act as technology “persuaders” for downstream firms. A persuader may consider developing technologies rendered in patents with two characters in
citations of high other-cited and low self-citing. The two patenting strategies affect a firm’s market-to-book ratio by stretching to the two extremes. On one hand, the defender patenting style reduces the gap between the market value and the book value; hence, the market-to-book ratio moves toward the minimum due to tangible assets dominating the ratio. On the other hand, the persuader patenting style enlarges the gap;
hence, it makes the ratio move toward the maximum such that the intangible assets become the dominator.
This finding provides the following managerial implications for R&D management. For firms that do not hold complementary assets to sell their end products to buyers it is essential for them to build technologies that attract downstream users. The present study shows that to attract downstream users they need to develop technologies that result in patents with two citations characteristics – low self-citing and high other- cited. Low self-citing indicates that the technology is relatively independent of earlier technologies, which can reduce buyers’
concern about piracy accusations and technology hold-up. High other-cited indicates that the technology may have been widely adopted by the industry, hence easy technology buyers’ concern of upgrading obsolete.
In addition, this study provides an alternative perspective about exploiting the information contained in patent citations (an extension of Lin and Chen [15]‘s framework). By dividing citation information into four dimensions – self-citing, other–citing, self-cited and other- cited, a refined strategic fit could be achieved in light of firms’
R&D approaches and their complementary assets resources.
One issue lacking in this study is how a strategic fit could affect firm performance? This question is difficult to answer for two reasons. Firstly, most Fuel Cell related products are not commercialized yet. The estimation of profits solely on Fuel Cell technology is subject to a large variation. Secondly, the economic contribution attributed to Fuel Cell technology within a firm is unclear. This is especially true for conglomerates, such as Motorola, 3M, and Dupont, who all produce thousands of products.
References
1. 1. Amit, R. and P.J.H. Schoemaker, Strategic assets and organizational rent.
Strategic Management Journal, 1993. 14(1):
p. 33-46.
2. 2. Griliches, Z., Market value, R & D and patents. Economic Letters, 1981. 7: p.
183-187.
3. 3. Pakes, A., On patents, R & D, and the stock market rate of return. Journal of
Political Economy, 1985. 93(2): p. 390--409.
4. 4. Connolly, R.A. and M. Hirschey, Market value and patents: A Bayesian
Approach. Economics Letters, 1988. 27(1): p.
83-87.
5. 5. Thomadakis, S.B., A value-based test of profitability and market structure. Review of Economics & Statistics, 1977. 59(2): p.
179--185.
6. 6. Narin , F., E. Noma, and R. Perry, Patents as indicators of corporate
technological strength. Research Policy, 1987. 16: p. 143-155.
7. 7. Cockburn, I. and Z. Griliches,
Industry effects and appropriability measures in the stock market's valuation of R&D and patents. American Economic Review, 1988.
78(2): p. 419--423.
8. 8. Griliches, Z., B.H. Hall, and A. Pakes, R&D, patents, and market value revisited: Is there a second (technological opportunity) factor? Economics of Innovation and New Technology, 1991. 1(3): p. 183-201.
9. 9. Trajtenberg, M., A penny for your quotes: Patent citations and the value of innovations. RAND Journal of Economics, 1990. 21(1): p. 172-87.
10. 10. Jaffe, A.B., M. Trajtenberg, and M.S.
Fogarty, Knowledge Spillovers and Patent Citations: Evidence from a Survey of
Inventors. American Economic Review, 2000.
90(2): p. 215-18.
11. 11. Carpenter, B. and J.L. Hart, Jump starting the patent search process by using subject-oriented databases. Database Magazine, 1998. 21(6): p. 20--23.
12. 12. Trajtenberg, M., Innovation in Israel 1968-1997: a comparative analysis using patent data. Research Policy, 2001. 30(3): p.
363--389.
13. 13. Hall, B.H., A.B. Jaffe, and M.
Trajtenberg, Market Value and Patent Citations: A First Look. National Bureau of Economic Research Working Paper,
2000(7741).
14. 14. Breitzman, A., P. Thomas, and M.
Cheney, Technological powerhouse or
diluted competence: Techniques for assessing mergers via patent analysis. R & D
Management, 2002. 32(1): p. 1--10.
15. 15. Lin, B.-W. and J.-S. Chen, Corporate technology portfolios and R&D performance measures: a study of technology intensive firms. R & D Management, 2005. 35(2): p.
157.
16. 16. Hall, B.H., A. Jaffe, and M.
Trajtenberg, Market value and patent
citations. Rand Journal of Economics, 2005.
36(1): p. 16.
17. 17. Fama, E. and K. French, Size and Book-to-Market Factors in Earnings and Returns. Journal of Finance, 1995. 50(1): p.
131-155.
18. 18. Fama, E. and K. French, Average returns, B/M, and share Issues. Journal of Finance, 2008. 63(6): p. 2971-2995.
19. 19. Roos, G. and J. Roos, Measuring your company's intellectual performance. Long Range Planning, 1997. 30(3): p. 413-426.
20. 20. Sveiby, K.-E., Intellectual capital thinking ahead. (Cover story). Australian CPA, 1998. 68(5): p. 18--23.
21. 21. Stewart, T.A., Brain power. Fortune, 1997. 135(5): p. 104--108.
22. 22. Booth, M.E. and G. Philip, Technology, competencies, and
competitiveness: The case for reconfigurable and flexible strategies. Journal of Business Research, 1998. 41(1): p. 29--40.
23. 23. Johnson, Making the most of technology., in Foodservice Equipment &
Supplies. 1999, Reed Business Information. p.
148.
24. 24. Hamel, G., The end of progress.
Business Strategy Review, 2000. 11(3): p.
69--78.
25.