CHAPTER FOUR
RESULTS AND DISCUSSION
This chapter presents the results of the analyses of data. These results were obtained from the analyses of the following data including, first, student composition scores in the pretest and the posttest; second, the error rates of students’ pretest and posttest writing; third, the participants’ responses to the attitude questionnaire. The results of the analyses will be reported first and then discussed.
Results
In the following section, the results of the comparisons of students’ pre- and post-test writing scores are first presented, followed by the comparisons of the analyses of students’ error rates in the pre-and post-test writing. Then the results of comparing students’ responses to the attitude questionnaire are reported.
Writing Scores
The students’ overall writing scores in the pretest and posttest were subjected to SPSS for statistical analyses. These scores were the averages of the scores given by two independent graders using the JCEE rubric.
Effects of Direct Error Correction and Code Error Correction on Writing Quality
To answer the first research question—“Is code error correction more effective
than direct error correction in improving student writing quality?”—descriptive
statistics of the writing scores including means and standard deviations are first
displayed in Table 4 for comparison. The pre- and post-test mean scores of the two
treatment types were plotted in a multiple line graph as shown in Figure 2.
Table 4
Means and Standard Deviations of Pre- and Post-test Writing Score
Pretest Score Posttest Score
Mean S.D. N Mean S.D. N
Direct Correction Group 10.09 2.87 45 11.20 2.07 45 Code Correction Group 10.29 2.94 45 12.04 2.24 45
Figure 2
Pre- and Post-test Writing Scores of Two Treatment Groups
1 2
scores
10.00 10.50 11.00 11.50 12.00 12.50
E st im at ed Ma rg in al M ea ns
Treatment
Direct Correction Code Correction
Estimated Marginal Means of MEASURE_1
Note: In the X axial, the value “1” represents the pretest scores while the value “2” refers to the posttest scores.
According to Table 4, for either the pre- or post-test scores, the mean value of the code correction group was greater than that of the direct correction group (10.29 > 10.09; 12.04
> 11.20). As can be clearly observed in Figure 2, the discrepancy between the two groups
in the posttest was greater than that in the pretest. This suggested that students in the code
group made more improvement in writing quality than students in the direct group. To test
for the significant difference between the effects of two error correction methods, a MANOVA was performed and the comparisons of the pre- and post- test scores for both groups are displayed in Table 5.
Table 5
Comparisons between Pre- and Post- test Score in Direct Correction Group and in Code Correction Group
Source of Variation SS F Sig of F
Comparison between the Scores of the Direct Correction Group
28.03 15.26 .000**
Comparison between the Scores of the Code Correction Group
68.87 37.49 .000**
**p < .001.
As shown in Table 5, the F value of 15.26 for the direct correction group and that of 37.49 for the code correction group suggested that there was significant difference in their pre- and post-test scores (p < .001) for both groups. These results indicated that students in both groups made significant improvement in their posttest writing. In other words, both error treatments were effective in improving students’ writing quality.
Then, the comparison was further made between the posttest scores of the two groups and the results were shown in Table 6.
Table 6
Comparison Between Posttest Scores of Direct Correction Group and Code Correction Group
Source of Variation SS F Sig of F
Comparison between the Posttest Scores of the Two Treatment Groups
15.65 3.37 .070
According to Table 6, no significance was found between the mean scores of two groups, 11.20 and 12.04 (F =3.37, p = .07 > .05). This finding suggested that although the mean score of the code correction group was higher than that of the direct correction group (as 12.04 > 11.20, See Table 4 in page 38), the code correction group did not significantly outperformed the direct correction group at the end of the treatment. The two treatment types were thus considered equally effective in improving student’s writing quality.
Interaction between Treatment Types and Writing Proficiency Levels
To address the third research question “How do the effects of the two methods differ on the writing quality of students at different writing proficiency?” the interaction between treatment types and writing proficiency levels were examined by a two-way ANOVA procedure. The results as shown in Figure 3, indicated that there was no significant interaction between the two factors at the .05 level (F =.766, p >0.05).
Figure 3
Posttest Writing Mean Scores of Two Treatment Groups at Two Writing Proficiency Levels
Direct Correction Code Correction
Treatment
8.00 9.00 10.00 11.00 12.00 13.00 14.00
E sti m at ed M ar g in al M ea ns
Level
low high
Estimated Marginal Means of posttest
As can be seen in Figure 3, the two lines representing the lower and higher proficiency students were not completely parallel. This indicated that there was still an interaction effect to certain degree because the discrepancy in the mean scores of the two treatment groups was greater in the higher proficiency group than that in the lower proficiency group. Therefore, to examine the effects of the two correction methods on the writing quality of students at two different levels of writing proficiency, MANOVAs were further conducted.
Before the results of MANOVA test is shown, the results of the descriptive statistics of the more proficient students will be first presented.
Effects of Direct Error Correction and Code Error Correction on Writing Quality at Higher Proficiency Level
The descriptive statistics of the higher-proficiency students’ pre-and post-test writing scores were first displayed in Table 7.
Table 7
Means and Standard Deviations of Pre- and Post-test Writing Scores for Students of Higher Proficiency
Pretest Score Posttest Score
Mean S.D. N Mean S.D. N
Direct Correction Group 12.45 1.88 22 12.47 1.57 22 Code Correction Group 12.41 2.15 23 13.54 1.53 23
As shown in Table 7, the mean scores of the two treatment groups, 12.45 of the
direct correction group and 12.41 of the code correction group, were almost identical
in their pretest writing, while at the post-treatment stage the mean value obtained by
the higher proficiency students in the code group was much greater than that of the
direct correction group (13.54 > 12.47). To test if the difference was significant, a MANOVA was conducted and the comparisons of the pretest and posttest scores for both groups at higher proficiency level are displayed in Table 8.
Table 8
Comparisons of Pre- and Post- test Scores in Direct Correction Group and in Code Correction Group at Higher Proficiency Level
Source of Variation SS F Sig of F
Comparison between the Scores of the Direct Correction Group
.00 .00 .963
Comparison between the Scores of the Code Correction Group
14.75 7.62 .000**
**p < .001.
As can be seen in Table 8, the mean scores on the pretest and posttest for the direct correction group were almost identical (F = .00, p = .963 > .05). The result indicated that the more proficient students in the direct correction group made little or no progress after the treatment. However, more proficient students in the code correction group made significant improvement (F =7.62, **p <.001). These findings thus suggested that code error correction benefited students of higher proficiency but the direct correction failed to be effective for these more proficient students.
The comparisons between the direct group and the code group in their pretest and
posttest scores were further made and the results were displayed in Table 9.
Table 9
Comparison Between Direct Correction Group and Code Correction Group in Their Pre- and Post-test Writing Scores at Higher Proficiency Level
Source of Variation SS F Sig of F
Comparison between the Pre-and Post-test Score of the Direct Correction Group
.02 .00 .951
Comparison between the Pre-and Post-test Score of the Code Correction Group
13.01 5.39 .025*
* p < .05
Table 9 indicates that there was no significant difference between the two treatment groups of more proficient students in their pretest writing scores (F = .00, p = .951 > .05). However, there was significant difference between the posttest scores of the two treatment groups (F = 5.39, p = .025 < .05). These findings suggested that the more proficient students in the code correction group significantly outperformed their counterparts in the direct correction group in their posttest writing (13.54 >
12.47). In other words, the code correction treatment was more effective for students of higher writing proficiency.
Effects of Direct Error Correction and Code Error Correction On Writing Quality at Lower Proficiency Level
The descriptive statistics of the less proficient students’ pre-and post-test
writing scores were displayed in Table 10.
Table 10
Means and Standard Deviations of Pre- and Post-test Writing Scores for Students of Lower Proficiency
Pretest Score Posttest Score
Mean S.D. N Mean S.D. N
Direct Correction Group 7.83 1.50 23 9.99 1.75 23 Code Correction Group 8.07 1.77 22 10.46 1.71 22
As shown in Table 10, the average gain score of the code correction group was greater than that of the direct correction group by only .23 (2.39 - 2.16 =.23). The result implied that the two treatments produced the same effects on students of lower proficiency. To test if significant difference existed between two treatment groups, a MANOVA was conducted and the comparisons of the pre- and post- test scores for both groups at lower proficiency level are presented in Table 11.
Table 11
Comparisons of Pre- and Post- test Scores in Direct Correction Group and in Code Correction Group at Lower Proficiency Level
Source of Variation SS F Sig of F
Comparison between the Scores of the Direct Correction Group
53.91 53.23 .000**
Comparison between the Scores of the Code Correction Group
63.07 62.28 .000**
**p < .001.
The results in Table 11 showed that the less proficient students in either
treatment group made significant improvement from the pretest to the posttest writing
(F = 53.23, p < .001; F = 62.28, p < .001). This indicated that the two correction
methods were both effective in improving the writing quality of lower-proficiency students.
Then, the comparisons were made between the direct c group and the code group in their pretest and posttest scores and the results were displayed in Table 12.
Table 12
Comparison Between Direct Correction Group and Code Correction Group in Their Pre- and Post-test Writing Scores at Lower Proficiency Level
Source of Variation SS F Sig of F
Comparison between the Pretest Scores of the Two Treatment Groups
.64 .24 .626
Comparison between the Posttest Scores of the Two Treatment Groups
2.47 .83 .368
Table 12 revealed that there was no significant difference in the pre-and post-test scores of the two treatment types (F = .24, p = .626 >.05; F = .83, p = .368 > .05 ).
These findings suggested that both treatments were equally effective for students of lower proficiency.
Error Rate
The error rate was the ratio of errors in a single draft to the total number of words written in that particular draft. To examine the effects of code error correction and direct error correction on the writing accuracy of students, the error rates of students’ pretest and posttest writing were subjected to SPSS for analysis. The procedures used included descriptive statistics, MANOVAs and a two-way ANOVA.
Effects of Direct Error Correction and Code Error Correction on Writing Accuracy
To answer the second research question “Is code error correction more effective
than direct error correction in improving student writing accuracy?” descriptive
statistics of the error rates including means and standard deviations of the two treatment groups are first displayed in Table 13 for comparison. Also, the mean error rates of the pretest and posttest writing of both groups were plotted and shown in Figure 4.
Table 13
Means and Standard Deviations of Error Rates in the Pre- and Post-test Writing
Pretest Error Rate (%) Posttest Error Rate (%)
Mean S.D. N Mean S.D. N
Direct Correction Group 10.70 4.15 45 9.47 3.2 45 Code Correction Group 10.55 5.04 45 8.13 3.38 45 Note: The number 10.70 means that in average there were 10.70 errors in every 100 words written.
Figure 4
Pre-and Post-test Error Rates of Two Treatment Groups
1 2
rates
8.00 8.50 9.00 9.50 10.00 10.50 11.00
E st im at ed M arg in al M ea ns
Treatment
Direct Correction Code Correction
Estimated Marginal Means of MEASURE_1
Note: In the X axial, value “1” represents pretest error rate and value “2” is posttest error rate.
According to Table 13, there was little difference between the mean error rates of the two groups in the pretest writing (10.70 % for the direct correction group and 10.55 % for the code correction group), but the difference increased greatly in the posttest writing (9.47 % for the direct correction group and 8.13 % for the code correction group). The increased discrepancy can also be observed from the two descending lines in Figure 4. These results indicated that the error rates of the students in the code correction group decreased more than those of the students in the direct correction group, suggesting the more positive effect of code correction method on students’ written accuracy.
To test for the significant difference between the two treatment groups in term of their writing accuracy, a MANOVA was performed and the comparisons of the pre- and post- test mean error rates for both groups are displayed in Table 14.
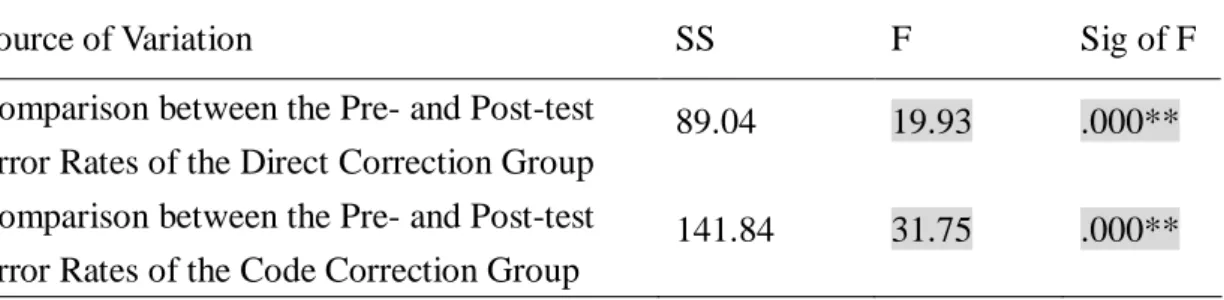
Table 14
Comparisons between the Pre- and Post- test Error Rates in Direct Correction Group and in Code Correction Group
Source of Variation SS F Sig of F
Comparison between the Pre- and Post-test Error Rates of the Direct Correction Group
34.10 8.3 .005**
Comparison between the Pre- and Post-test Error Rates of the Code Correction Group
131.77 32.07 .000**
**p < .001, *p < .05
Based on Table 14, significant difference between the mean error rates of the pretest and posttest writing was found in both treatment groups (F = 8.3, p =.005 <.05;
F = 32.07, p = .000 <.001). As also shown in Figure 4, the error rates dropped from
pretest to posttest writing; therefore, these findings demonstrated that students in both
groups made significant improvement in their written accuracy.
The comparisons were then further made between the direct group and the code group in their pretest and posttest error rates. The results are displayed in Table 15.
Table 15
Comparison between Direct Correction Group and Code Correction Group in Their Pre- and Post-test Error Rates
Source of Variation SS F Sig of F
Comparison between the Pretest Error Rates of the Two Treatment Groups
.50 .02 .879
Comparison between the Posttest Error Rates of the Two Treatment Groups
40.27 3.72 .057
Table 15 shows that, in both the pretest and posttest writing, no significant difference was found between the mean error rates of the two treatment groups (F
= .02, p = .879 > . 05; F = 3.72, p = .057 > .05). These results indicated that students in the code error correction did not made significantly more improvement than their counterparts in the direct correction group in terms of their written accuracy.
Therefore, the conclusion was made that the two correction methods were equally effective in improving students’ written accuracy.
Interaction between Treatment Type and Proficiency Level
To address the fourth research question “How do the effects of the two
correction methods differ on the writing accuracy of students at different writing
proficiency?” the interaction between the treatment types and writing proficiency
levels was examined by a two-way ANOVA procedure. The results, as shown in
Figure 5, indicated that there was no significant interaction between the two factors at
the level of .05 ( F = .87; p = .354 > .05).
Figure 5
Posttest Mean Error Rates of Two Treatment Groups at Two Proficiency Levels
Direct Correction Code Correction
Treatment
6.00 7.00 8.00 9.00 10.00 11.00
E st im at ed Ma rg in al M ea ns
Level
low high
Estimated Marginal Means of Posttest
As shown in Figure 5, the two lines representing the lower and higher proficiency students were not parallel, indicating that there was an interaction to certain degree. To examine the effects of the two correction methods on the writing accuracy of students at two levels of writing proficiency, MANOVAs were further employed.
Before the results of MANOVA tests are shown, the descriptive statistics of the means and standard deviations for the error rates will be first presented.
Effects of Direct Error Correction and Code Error Correction on Writing Accuracy at Higher Proficiency Level
The descriptive statistics of the higher-proficiency students’ pre-and post-test
error rates were first displayed in Table 16.
Table 16
Means and Standard Deviations of Error Rates in the Pre- and Post-test Writing of Higher-proficiency Students
Pretest error rates (%) Posttest error rates (%)
Mean S.D. N Mean S.D. N
Direct Correction Group 7.52 2.76 22 7.91 2.89 22 Code Correction Group 7.41 2.31 23 6.09 1.91 23
According to Table 16, for more proficient students, there was little difference between the mean error rates of the two treatment groups in the pretest writing (7.52
% and 7.41 %). However, in the posttest, the difference obviously increased (7.91 % and 6.09%). The direct correction group increased its mean error rate by .39 % while the code correction group reduced its error rate by 1.32 %. This implied that the written accuracy of students in the direct group deteriorated whereas that of students in the code group improved at the end of the treatment. To test for significant
difference between the two groups, a MANOVA test was conducted and the comparisons of the pretest and posttest error rates for both groups at higher proficiency level are displayed in Table 17.
Table 17
Comparisons between Pre- and Post- test Error Rates in Direct Correction Group and in Code Correction Group at Higher Proficiency Level
Source of Variation SS F Sig of F
Comparison between the Pre- and Post-test Error Rates of the Direct Correction Group
1.68 .86 .360
Comparison between the Pre- and Post-test Error Rates of the Code Correction Group
20.09 10.22 .003**
**p < .01
As Table 17 shows, the deterioration in written accuracy of the direct correction group in their posttest writing was not significant (F = .02, p = .360 > .05). On the other hand, the improvement in written accuracy of the code correction group was significant (F = 6.26, *p = .003 < .01). This result indicated that the direct correction method had very little or no effects on the writing accuracy of higher-proficient students while the code correction treatment had a positive effect on their writing accuracy.
The comparisons between the direct group and the code group in their pretest and posttest error rates were further made and the results were displayed in Table 18.
Table 18
Comparison Between Direct Correction Group and Code Correction Group in Their Pre- and Post-test Error Rates at Higher Proficiency Level
Source of Variation SS F Sig of F
Comparison between the Pretest Error Rates of the Two Treatment Groups
.13 .02 .886
Comparison between the Posttest Error Rates of the Two Treatment Groups
37.33 6.26 *.016
**p < .01
Based on Table 18, there was no significant difference between the two treatment groups of more proficient students in their pretest error rates (F = .02, p
= .886 > .05). However, significant difference existed between the mean error rates of the two treatment groups at the posttest stage (F = 6.26, p = .016 < .05). These results suggested that there was significant difference between the effects of the two
treatments on students of higher proficiency. The code correction method was more
effective in improving the written accuracy of higher-proficiency students.
Effects of Direct Error Correction and Code Error Correction on Writing Quality at Lower Proficiency Level
The descriptive statistics of the lower-proficiency students’ pre-and post-test error rates were displayed in Table 19.
Table 19
Means and Standard Deviations of Error Rates in the Pre- and Post-test Writing of Lower-proficiency Students
Pretest error rates (%) Posttest error rates (%)
Mean S.D. N Mean S.D. N
Reduction of
error rate (%)
Direct Correction Group 13.74 2.71 23 10.96 2.77 23 -2.78 Code Correction Group 13.84 5.05 22 10.25 3.31 22 -3.95
Table 19 indicated that the average reduction of error rate in the code correction group was greater than that of the direct correction group by 1.17 % (3.95 % - 2.78 %).
To test if the difference was significant, a MANOVA test was conducted and the comparisons of the pretest and posttest error rates for both groups at lower proficiency level are displayed in Table 20.
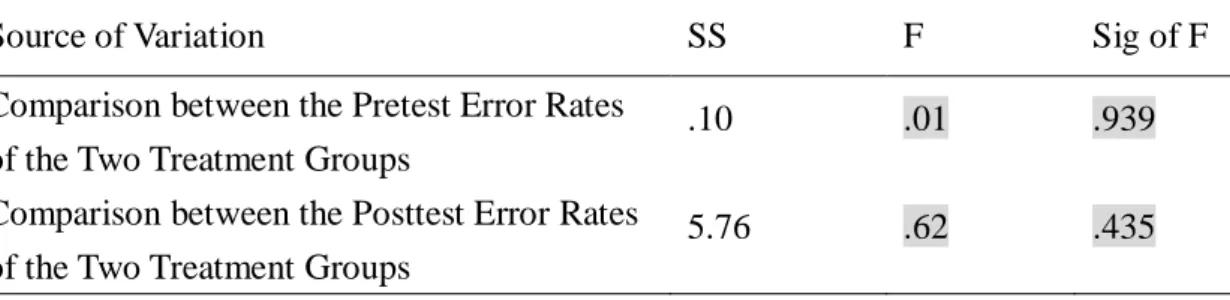
Table 20
Comparisons of Pre- and Post- test Error Rates in Direct Correction Group and in Code Correction Group at Lower Proficiency Level
Source of Variation SS F Sig of F
Comparison between the Pre- and Post-test Error Rates of the Direct Correction Group
89.04 19.93 .000**
Comparison between the Pre- and Post-test Error Rates of the Code Correction Group
141.84 31.75 .000**
**p < .001, *p < .05
According to Table 20, the decrease of error rates in both treatment groups was highly significant (F = 19.93, p < .001). This result indicated that for both correction methods were effective in improving the writing accuracy of the lower proficient students.
Then, the comparisons were made between the direct correction group and the code correction group in their pretest and posttest error rates and the results were displayed in Table 21.
Table21
Comparison Between Direct Correction Group and Code Correction Group in Their Pre- and Post-test Error Rates at Lower Proficiency Level
Source of Variation SS F Sig of F
Comparison between the Pretest Error Rates of the Two Treatment Groups
.10 .01 .939
Comparison between the Posttest Error Rates of the Two Treatment Groups
5.76 .62 .435
Table 21 indicated that no significant difference was found between the written accuracy of two treatment groups either at the pretreatment or the post-treatment stage (F = .01, p = .939 >.05; F = .62, p = .435 > .05). The two treatments were equally successful in helping less proficient students reduce their errors. This finding demonstrated that direct error correction and code error correction were equally effective in improving the written accuracy of lower-proficiency students.
Participants’ Responses to the Attitude Questionnaire
The Attitude Questionnaire administered at the end of the experiment contains
three Liker-scale items, two multiple–choice items and one open-ended question. To
answer the fifth research question “How do code error correction group and direct
error correction groups differ in their attitude toward the implemented correction
systems at the end of the experiment?” the students’ responses to Item 1 to item 5 in the questionnaire were subjected to SPSS for analysis. As for the last open-ended question, students’ responses were analyzed qualitatively for comparison and discussion.
Students’ Perceptions of Their Improvement in Writing Ability, Editing Ability and Writing Autonomy
The first three Liker-scale Items in the attitude questionnaire probed into students’ self-perceptions of their improvement in writing ability, writing accuracy and writing autonomy. Cross-tabulation and chi-square tests were used for statistical analysis of students' responses to these items. For each item, the comparison was first made between two treatment groups regardless of different proficiency levels to see the influence of treatment type on students’ response. After that, tests were further conducted for the comparison between two proficiency groups within each of the two treatment types. Tests were also conducted for the comparison between two treatment groups within each of the two proficiency levels. These comparisons were made to see if the influence of treatment types differed on students of different proficiency levels. The results of each item were reported in Table 22, Table 23 and Table 24.
As shown in Table 22, no significant difference was found between the responses of students from two treatment groups for the first two items (p= .525 > .05; p = .362
> .05). This result suggested that the two treatment groups held similar attitudes toward their improvement in writing ability and editing ability. However, for the third item, significant difference was found between the two treatment groups (*p = .025
< .05). The result suggested that students from the code correction group perceived
significantly more improvement in writing autonomy than students from the direct
correction group did (as 77.8 % > 55.6%).
Table 22
Comparison of Students’ Responses to the Attitude Questionnaire Items 1,2 & 3 between Two Treatment Groups (Tested within All Students)
Direct (%) Code (%) Treatment Groups
Item P N P N
57.8 42.2 51.1 48.9
1 I feel that I have improved a lot in my English writing
ability after the writing practice of this semester.
χ2= .403, p=.525
73.3 26.7 64.4 35.6
2. I feel that I have improved a lot in my ability to self-edit my
compositions after the writing practice of this semester.
χ2= .83, p=.362
55.6 44.4 77.8 22.2
3. After the writing practice of this semester, I feel that I have
improved a lot as an active and autonomous writer.
χ2= .50, *p=.025 Note. P = positive (“strongly agree” and “agree”; N = negative (“disagree” and “strongly agree”)
When the comparison was further made between two treatment groups at two different levels of writing proficiency, different results arose and they were displayed in Table 23.
Table 23
Comparison of Students’ Responses to the Attitude Questionnaire Items 1, 2 & 3 between Two Treatment Groups (Tested between Two Proficiency Levels)
Item 1 Item 2 Item 3
Item
Writing ability Editing ability Writing autonomy
P 65.2 P 69.6 P 65.2
Direct
(%) N 21.7 N 26.1 N 30.4
P 22.7 P 40.9 P 77.3
Tested within lower
proficiency level
Code
(%) N 68.2
χ2
=10.0
*p
= .002 N 50.0
χ2
=3.343 p
= .067 N 22.7
χ2
= .458 p
= .498
P 50.0 P 68.2 P 45.5
Direct
(%) N 50.0 N 27.3 N 50.0
P 69.6 P 78.3 P 78.3
Tested within higher
proficiency level
Code
(%) N 21.7
χ2
=3.154 p
=.076 N 21.7
χ2
= .273 p
= .601 N 21.7
χ2
= 4.454
*p
=.035
Note. P = positive (“strongly agree” and “agree”; N = negative (“disagree” and “strongly
disagree”)
As shown in Table 23, for these three items, three comparisons were made between two treatment groups at lower proficiency level while three other
comparisons were made between two treatment groups at higher proficiency level.
Among these six comparisons, two of them produced significant difference.
The first significant difference was found in the comparison between two treatment groups of lower proficiency students for the first item (*p = .002 < .05).
This result demonstrated that at lower-proficiency level, students from the direct group perceived more improvement in their writing ability than students from the code group (as 65.2% >22.7%). The second significant difference existed in the comparison between two treatment groups of higher proficiency for the third item (*p
=.035 < .05). This finding indicated that for students of higher proficiency, students from the code group perceived more improvement in their writing autonomy than students from the direct group (as 78.3% > 45.5%).
From these findings, it was noted that although two treatment groups of students at different proficiency levels did not differ in their attitudes toward their
improvement in editing ability, they differed in their perceptions of their improvement in writing ability and writing autonomy. In terms of writing ability, the two treatment groups of higher proficiency students did not differ in their perception of
improvement, while the lower-proficiency students from the direct group felt they improved more than those from the code group. This observation also revealed the lower-proficiency students’ belief that direct correction method helped them improve their writing ability more effectively than code correction method did.
However, in terms of their improvement in writing autonomy, the difference in
attitude indicated in Table 19 mainly occurred between the two treatment groups of
higher-proficiency students. This finding indicated that at lower-proficiency level,
students thought both treatments helped them improve in their writing autonomy;
whereas it also revealed that, at the higher-proficiency level, students believed that code correction method helped them improve their writing autonomy more than direct correction method.
To further test the effects of two treatment types on the attitudes of students at different proficiency levels, another six comparisons were made between students of two proficiency levels; three of them were conducted within the direct group while the other three in the code group. The results were displayed in Table 24.
Table 24
Comparison of Students’ Responses to Item 1,2 & 3 of the Attitude Questionnaire between Two Proficiency Groups (Tested between Two Treatment Groups)
Item 1 Item 2 Item 3
Item
Writing ability Editing ability Writing autonomy
P 65.2 P 69.6 P 65.2
Lower
(%) N 21.7 N 26.1 N 30.4
P 50.0 P 68.2 P 45.5
Tested within direct
correction group
Higher
(%) N 50.0
χ2
=2.776 p
= .096 N 27.3
χ2
= .009 p
= .924 N 50.5
χ2
= 1.867 p
= .172
P 22.7 P 40.9 P 77.3
Lower
(%) N 68.2 N 50.0 N 22.7
P 69.6 P 78.3 P 78.3
Tested within code
correction group
Higher
(%) N 21.7
χ2 10.744
**p
= .001 N 21.7
χ2
= 5.065
*p
= .024 N 21.7
χ2
= .006 p
= .936 Note. P = positive (“strongly agree” and “agree”; N = negative (“disagree” and “strongly disagree”)
*p < .05; **p < .001
Among the six comparisons, two of them produced significant difference. The
first significant difference was found in the comparison between two proficiency
levels in the code correction group for the first item (*p = .001 < .01). This result
demonstrated that among students who received code correction, students of higher
proficiency perceived more improvement in their writing ability than students of
lower-proficiency did (as 69.6% >22.7%). The second significant difference existed in the comparison between two proficiency levels in the code correction group for the second item (*p = .024 < .05). This finding indicated that among students who
received code correction, students of higher proficiency perceived more improvement.
These findings indicated that students of higher proficiency level considered code correction helped them improve their writing and editing ability more than students of lower proficiency did (69.6 % > 22.7 %). Therefore, an observation was made that, in improving students’ writing ability and editing ability, code error correction better served students of higher proficiency than students of lower proficiency.
Students’ Perceptions of Correction Responsibility
The fourth item (a multiple-choice item) in the attitude questionnaire asked the students about their views concerning the responsibility of error correction. Students’
responses to Item 4 were subjected to a cross-tabulation and a chi-square test for statistical analyses and the results were listed in Table 25.
Table 25
Comparison of Students’ Responses to the Attitude Questionnaire Item 4 (Tested between Two Treatment Groups within All Students)
Item 4. Who is responsible for error correction?
Teacher Students Both of them Option
Group f % f % f %
χ2 p
Direct group 3 6.7 16 35.6 26 57.8 Code group 4 2.4 21 46.7 22 48.9
.997 .318
Note: f = frequency
From Table 25, although no significant difference was found in the responses of the
students from two treatment groups (p = .318 > .05), the percentage of each option still
shed some light on the students’ opinions about the responsibility of error correction.
First, for either group, a larger percentage of students (57.8% and 48.9 % respectively) regarded that the responsibility of error correction should be taken both by the teacher and the students. This interesting finding revealed that more than half of the students from the direct correction group, who received correct answers from their teacher, considered that the teacher and the students should share the responsibility of correcting errors. The other finding was that in either the direct or code correction groups, very few of the students thought that the teacher should be solely responsible for the correction job (6.7% and 2.4 % respectively). These two findings reflected most students’ beliefs that students should participate in the activity of correcting their errors in their own writing.
Students’ Preference for Error Correction
The fifth item investigated students’ attitude toward the treatment they received by asking their preferred error correction method. Two alternatives were offered for them to choose from: the code error correction and the direct error correction. Students’ responses to Item 5 were subjected to a cross-tabulation procedure and the results were displayed in Table 26, Table 27 and Table 28.
Table 26
Students’ Attitude toward Error Correction
Item 5: After the writing practice conducted in this semester, how do you like your teacher to correct your compositions for the next semester?
Direct Correction Group N = 45
Code Correction Group N = 45
Selection of Direct Correction Selection of Code Correction
frequency % frequency %
Positive Attitude toward the Implemented Treatment
26 57.8 26 57.8
Selection of Code Correction Selection of Direct Correction
frequency % frequency %
Negative Attitude toward the Implemented Treatment
19 42.2 19 42.2
As indicated in Table 26, closer to 60 % (57.8 %) of students in either treatment group expressed their positive attitude toward the treatment they received, while about two-fifths (42.2 %) of the students disliked the way in which the teacher treated their errors. This finding suggested that both treatments were considered equally successful since more than half of the students in both groups liked the way in which the teacher corrected their errors and expected the same practice to be continued.
However, the comparison made between students of two different proficiency levels in either the direct group or the code group resulted in difference in students’
attitudes toward the treatment they received. The results were displayed in Table 27 and Table 28 respectively.
Table 27
Students’ Attitude toward Error Correction (In the Direct Correction Group)
Lower-proficiency Higher-proficiency
frequency % frequency %
Positive Attitude toward the Implemented
Treatment (Selection of direct correction)
15 65.2 11 50.0
Negative Attitude toward the Implemented
Treatment (Selection of code correction)
8 34.8 11 50.0
Table 27 displayed the results of the comparisons between students of different
levels in the direct correction group. It first revealed that 65.2 % of lower-proficiency
students in the direct group preferred their teacher to continue practicing direct
correction method they received for this semester, while the rest 34.5 % disapproved
the implemented correction and preferred their teacher to give them code correction
instead. As for students of higher proficiency, half of them (50 %) indicated their
approval for teacher’s practice of direct error correction while the other half (50 %) disliked direct correction and expected their teacher’s indication of error types rather than their provision of correct answers.
To sum up, the lower-proficiency students held more positive attitudes toward their implemented treatment—direct error correction—than the higher-proficiency students. In other words, less proficient students liked direct error correction better than more proficient students did.
Table 28
Students’ Attitude toward Error Correction (In the Code Correction Group)
Lower-proficiency Higher-proficiency
frequency % frequency %
Positive Attitude toward the Implemented
Treatment (Selection of code correction)
9 40.9 17 73.9
Negative Attitude toward the Implemented