Performance Modeling and Analysis of TCP Connections over Software Defined Networks
Yuan-Cheng Lai1, Ahsan Ali2, Md. Mahadi Hassan2, Md. Shohrab Hossain2 and Ying-Dar Lin3
1Department of Information Management, National Taiwan University of Science and Technology, Taipei, Taiwan
2Department of Computer Science and Engineering, Bangladesh University of Engineering and Technology, Bangladesh
3Department of Computer Science, National Chiao Tung University, Hsinchu, Taiwan
Email: [email protected], {ahsanali.buet, sibathasan}@gmail.com, [email protected], [email protected]
Abstract—Software Defined Networking (SDN) decouples the control plane from the data plane, thereby enhancing flexibility in network management. Earlier works on SDN modeling only focused on packet-level arrivals without considering flow-level arrivals. However, a model without considering flow-level arrivals cannot correctly reflect the probability of sending packets to the controller. In this paper, we propose an analytical model of SDN considering flow-level (TCP connection) arrivals and packet-level arrivals simultaneously. We use an analytical method termed as 4D state model, which uses four-dimensional states. We have derived the state transition rates of the model and also the packet delay and packet loss probability. We have conducted numerical analysis and extensive simulations. Our results show good matches, which verify the suitability and correctness of our analysis. Error ratios of the analytical results for 4D state model and M/M/1 model against simulation results are also given. Results show that for data packet delays, 4D state can achieve error ratios of 1.16∽3.30%, which is much better than 8.57∽35.7% attained by M/M/1 model, which only considers packet-level arrivals.
Index Terms—Software Defined Networking (SDN), Perfor- mance Modeling, Queueing Model, TCP.
I. INTRODUCTION
Software Defined Networking (SDN) is currently seen as a promising approach for future Internet [1]–[4]. SDN is a con- cept of disassociating the control plane (decision maker) from the data plane (packet forwarder) of network devices, facili- tating dynamic programmability to forward packets in highly distributed networks [5], [6]. SDN also enhances flexibility in network routing and provides the ability to change the behavior of a part of the network by isolating it from other parts [7].
In SDN architecture, packet forwarding devices (switches) are controlled by a logically centralized controller. The control plane and the data plane communicate through a south-bound interface, commonly known as OpenFlow protocol [8] that was standardized by the Open Networking Foundation (ONF).
There are several works on the performance issues of SDN.
Jarschel et al. [7] used feedback oriented queueing theory to evaluate the performance of SDN architecture, consider- ing a single switch and a single controller. Azodolmolky et al. [9] used network calculus to develop a mathematical model to evaluate the performance bound of SDN controller and switches in a worst case scenario. Few other works [1], [10], [11] also developed analytical models for SDN considering only packet-level arrivals.
Transmission Control Protocol (TCP) is a very popular protocol in today’s Internet. In TCP, three-way handshaking (through SYN and ACK packets) is carried out to establish a connection, and then only the data packets are transmitted.
Packet arrivals considering the flow (in TCP connection) arrivals is quite different from those cases that do not consider the TCP connection. In the former, no data packets will be sent before the SYN packet has been handled, while in the latter, there are always data packet arrivals. Hence, a model without considering flow-level arrivals will result in larger analytical errors. Therefore, it is essential to consider flow- level arrivals while modeling TCP over SDN. However, none of the previous works [1], [7], [9]–[11] focused on flow- level arrivals while performing SDN modeling. This is the first work that has developed a performance model for TCP connections over SDN, and makes use of flow-level arrivals for TCP connections.
In this work, we have developed a model for TCP con- nections over SDN, considering only one switch and one controller. In the model, we have considered the switch and controller jointly as a system and create a four-dimensional state to evaluate steady-state probability of the system states.
The contributions of this work are: (i) developing a queueing model of TCP connections over SDN; (ii) developing an analytical method, termed the 4D state model, to obtain performance metrics according to the queueing model; (iii) performing extensive simulations to validate our analytical results, and (iv) comparing the analytical results of the 4D state model with the M/M/1 model [7] on various system parameters.
The remainder of this paper is organized as follows. Sec- tion II discuses TCP connection establishment in SDN archi- tecture and related works on SDN modeling. In Section III, we describe our system model and present our analysis. In Section IV, we compare the analytical results of the 4D state model, M/M/1 model [7], and the simulation results. Finally, Section V has the concluding remarks.
II. BACKGROUND ANDRELATED WORKS
In Subsection II-A, we briefly cover SDN architecture and some previous works, and in Subsection II-B we explain the TCP connection establishment process in SDN architec- ture [5], [6].
978-1-5090-5019-2/17/$31.00 ©2017 IEEE
TABLE I
EXISTING WORKS ON SDN MODELING.
Paper Component # Methodology Performance Metrics
[7] Switch 1 M/M/1 Average packet delay
Controller 1 M/M/1/m
[9] Switch N Net. Calculus Buffer size bound, Controller 1 Net. Calculus Packet delay bound [10] Local Controller N M/M/1/m Average packet delay
Root Controller 1 M/M/1
[11] Switch N M/M/1 Avg. path delay,
Controller 1 M/M/1/m Avg. packet delay [1] Switch N 𝑀𝑋/M/1 Avg. packet delay,
Controller 1 M/G/1 Avg. packet sojourn time Our
Model Switch 1 Approx.
MMPP/M/1
Avg. data packet delay, Avg. SYN packet delay,
Controller 1 Approx.
MMPP/M/1 Packet loss probability
A. Background
SDN disassociates the control plane from the data plane and then connects them by an open interface, the OpenFlow protocol. The control plane is implemented in the controller with software. A secure channel is used to communicate be- tween the switch and the controller. The SDN switch contains a flow table for storing flow entries for every packet. When a packet arrives at the SDN switch, the header information of the packet is matched against the header part of the flow table entries. If no match is found with any flow table entries, the packet is forwarded to the controller, which makes a decision to handle packet and updates the statistics of the flow table.
Again, if there is a match in the flow table, SDN switch takes appropriate action from the flow table entry.
There are only a few works on SDN modeling listed in Table. I. Jarschel et al. [7] used feedback orientated queueing theory to show the interaction between the control plane and the data plane. They used Markovian servers for both systems, i.e. an M/M/1 for the switch and an M/M/1/m for the controller. Azodolmolky et al. [9] used network calculus to develop the analytical model of a SDN network. The main difference between [9] and [7] is that queuing theory calculates average behaviors of the system when it is in equilibrium, whereas network calculus deals with worst cases.
Wang et al. [10] implemented the concept of multistage controllers for improving the flexibility of the control plane.
However, this model increases mean delay time as there are multiple controllers. Mahmood et al. [11] aimed at expanding the data plane for more than one node. They proposed an analytical model for performance analysis of SDN, where one controller responds to multiple switches in the data plane.
Jackson network [11] is used to model the data plane to support more than one node, whereas the controller is sepa- rately modeled as a single M/M/1 queue. Mahmood et al. [11]
also derived the closed form expression for the probability density function (PDF) and cumulative density function (CDF) of the time spent by a packet in a SDN network. The
most recent work on SDN, of Xiong et al. [1] modeled the packet forwarding of OpenFlow switches and the packet-in message processing of SDN controller as the queueing systems 𝑀𝑋/M/1 and M/G/1 respectively, where 𝑀𝑋 means each arrival follows a Poisson process, but has a batch of packets.
They designed a queueing model of OpenFlow networks in terms of packet forwarding performance and derived its closed-form expression of average packet sojourn time and the corresponding probability density function. However, none of these works [1], [7], [9]–[11] developed any analytical model for SDN for TCP connections.
B. TCP connections in SDN
In case of a TCP connection, the source first sends a connection request (SYN packet) to the destination through the SDN switch. When a SYN packet arrives at the SDN switch, its header portion is matched against the flow table entries. If there is a flow table entry for a corresponding SYN packet, the switch forwards the packet to its destination. Otherwise, the SDN switch forwards the SYN packet to the controller, which decides the route of the SYN packet, updates the switch flow table and sends it back to the switch. The switch then forwards the SYN packet to its destination. In response to the SYN packet, destination also sends a request plus acknowledgement (SYN+ACK packet) to the source through SDN switch. Again, the SYN+ACK packet is forwarded to the source if it has a flow table entry in the switch; otherwise, it is forwarded to the controller. In response to the SYN+ACK packet, the source finally sends an ACK packet to the destination through the switch, and this time the switch directly forwards the ACK packet to its destination. Thus, a TCP connection is established between the sender host and the destination host. Subsequent data packets of this TCP connection are directly forwarded by the SDN switch to the destination, without the involvement of the controller.
III. SYSTEMARCHITECTURE
In our SDN queuing model, we have considered the switch and the controller jointly and modeled it using continuous time Markov chain. We have used queueing theory to develop a mathematical model of TCP connections over SDN. We first explain this queueing model in Subsection III-A, and in Subsection III-B, we describe the transition of system states, followed by the performance metrics in Subsection III-C.
A. Queueing model of the system
Fig. 1 shows the queueing model of SDN for TCP con- nections. It contains one switch and one controller, each of which has its own queue. The assumptions of the model are:
(i) TCP connection arrival and packet arrival in each TCP connection is a Poison process; (ii) service times in both switch and controller follow exponential distributions; (iii) TCP connection duration follows an exponential distribution;
(iv) switch queue size and controller queue size is finite;
(v) The uni-direction from the source to the destination is considered and (vi) For each TCP connection, no data packets
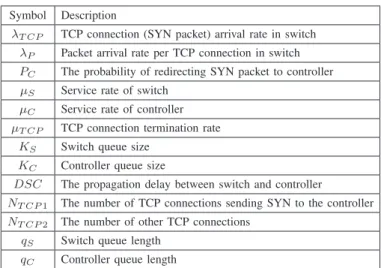
will be sent before the SYN packet has been handled, that is, the table entry for this TCP connection has been set up in the flow table of the switch. The notations used in the queueing model (Fig. 1) are listed in Table II.
Fig. 1. Queuing model of SDN for TCP connections.
TABLE II
NOTATIONS USED IN THE QUEUEING MODEL
Symbol Description
𝜆𝑇 𝐶𝑃 TCP connection (SYN packet) arrival rate in switch 𝜆𝑃 Packet arrival rate per TCP connection in switch 𝑃𝐶 The probability of redirecting SYN packet to controller 𝜇𝑆 Service rate of switch
𝜇𝐶 Service rate of controller 𝜇𝑇 𝐶𝑃 TCP connection termination rate
𝐾𝑆 Switch queue size 𝐾𝐶 Controller queue size
𝐷𝑆𝐶 The propagation delay between switch and controller
𝑁𝑇 𝐶𝑃 1 The number of TCP connections sending SYN to the controller 𝑁𝑇 𝐶𝑃 2 The number of other TCP connections
𝑞𝑆 Switch queue length 𝑞𝐶 Controller queue length
Since TCP connections whose SYN packets being handled by the controller will not send any data packets, we must know its number to determine an accurate packet arrival rate.
Thus, we classify TCP connections into two types: TCP1 and TCP2, where TCP1 is the TCP connections whose SYN packets are handled by the controller, and TCP2 is other TCP connections. In our model, we used a four-dimensional state (𝑁𝑇 𝐶𝑃 1, 𝑁𝑇 𝐶𝑃 2, 𝑞𝑆, 𝑞𝐶), where𝑁𝑇 𝐶𝑃 1, 𝑁𝑇 𝐶𝑃 2, 𝑞𝑆, 𝑞𝐶
represent the number of TCP1 connections, the number of TCP2 connections, the queue length in the switch, and the queue length in the controller, respectively.
B. State transition of system model
Fig. 2 shows seven possible transitions (labeled from 1 through 7) of state (𝑁𝑇 𝐶𝑃 1, 𝑁𝑇 𝐶𝑃 2, 𝑞𝑆, 𝑞𝐶) in our SDN system model for TCP connections. The followings are the explanation of each state transition:
∙ First transition occurs when a SYN packet arrives at the switch which has no flow table entry and it is redirected to the controller. So, 𝑁𝑇 𝐶𝑃 1 and𝑞𝑆 are increased by 1.
The transition rate is the product of𝜆𝑇 𝐶𝑃 and𝑃𝐶.
Fig. 2. State transition diagram of the SDN TCP model.
∙ Second transition occurs when a SYN packet arrives at the switch which has a flow table entry and it is forwarded to the destination. So,𝑁𝑇 𝐶𝑃 2 and𝑞𝑆 are increased by 1.
The transition rate is the product of𝜆𝑇 𝐶𝑃 and(1 − 𝑃𝐶).
∙ Third transition occurs when a TCP connection termi- nates. So, 𝑁𝑇 𝐶𝑃 2 is decreased by 1. The transition rate is𝜇𝑇 𝐶𝑃.
∙ Fourth transition occurs when a data packet of an estab- lished TCP connection arrives at the switch. So, 𝑞𝑆 is increased by 1. The transition rate is the product of 𝜆𝑃 and𝑁𝑇 𝐶𝑃 2.
∙ Fifth transition occurs when switch serves a SYN packet (with flow table entry) or a data packet which is not redirected to the controller. The probability of redirect- ing a SYN packet to controller is (𝑁𝑇 𝐶𝑃 1 − 𝑞𝐶)/𝑞𝑆. Hence, the probability of not redirecting a SYN packet (with flow table entry) or a data packet to controller is (1 − (𝑁𝑇 𝐶𝑃 1 − 𝑞𝐶)/𝑞𝑆). So, the transition rate is (1 − (𝑁𝑇 𝐶𝑃 1− 𝑞𝐶)/𝑞𝑆)𝜇𝑆, and switch queue length𝑞𝑆
is decreased by 1.
∙ Sixth transition occurs when switch serves a SYN packet (with no flow table entry) which is redirected to con- troller. The probability of redirecting a SYN packet to controller is (𝑁𝑇 𝐶𝑃 1− 𝑞𝐶)/𝑞𝑆. As SYN packet is redirected to controller from switch, 𝑞𝑆 is decreased by 1 and 𝑞𝐶 is increased by 1. The transition rate is ((𝑁𝑇 𝐶𝑃 1− 𝑞𝐶)/𝑞𝑆)𝜇𝑆.
∙ Seventh transition occurs when controller serves a SYN packet and forwards it to the switch. So, both 𝑁𝑇 𝐶𝑃 1 and𝑞𝐶 are decreased by 1 and both𝑁𝑇 𝐶𝑃 2 and𝑞𝑆 are increased by 1. The transition rate is𝜇𝐶.
C. Performance metrics
According to [12], the mean queue length of the switch can be determined as
𝑞𝑆 =∑
𝑞𝑆× 𝑃 (𝑁𝑇 𝐶𝑃 1, 𝑁𝑇 𝐶𝑃 2, 𝑞𝑆, 𝑞𝐶), (1) and the mean queue length of the controller can be determined as
𝑞𝐶 =∑
𝑞𝐶× 𝑃 (𝑁𝑇 𝐶𝑃 1, 𝑁𝑇 𝐶𝑃 2, 𝑞𝑆, 𝑞𝐶), (2)
where𝑃 (𝑁𝑇 𝐶𝑃 1, 𝑁𝑇 𝐶𝑃 2, 𝑞𝑆, 𝑞𝐶) is the steady state probabil- ity of state (𝑁𝑇 𝐶𝑃 1, 𝑁𝑇 𝐶𝑃 2, 𝑞𝑆, 𝑞𝐶).
(I) Average data packet delay in the switch,𝐷𝑑𝑎𝑡𝑎: 𝐷𝑑𝑎𝑡𝑎can be calculated as
𝐷𝑑𝑎𝑡𝑎=
(𝑞𝑆+ 1 𝜇𝑆
)
. (3)
(II) Average delay of SYN packet sent to the controller, 𝐷𝑆𝑌 𝑁1:
In our SDN system model, SYN packet is queued twice at the switch and once at the controller. SYN packet delay in the switch is same as Eqn. (3) and SYN packet delay in the controller𝐷𝐶 is(𝑞𝐶+ 1)/𝜇𝐶. So,𝐷𝑆𝑌 𝑁1can be calculated as 𝐷𝐶+ 2 × 𝐷𝑑𝑎𝑡𝑎+ 2 × 𝐷𝑆𝐶. Hence, we get
𝐷𝑆𝑌 𝑁1=
(𝑞𝐶+ 1 𝜇𝐶
) + 2
(𝑞𝑆+ 1 𝜇𝑆
)
+ 2𝐷𝑆𝐶. (4) (III) Packet loss probability in the switch, 𝐿𝑆 :
In our SDN system model, incoming packet drops at the switch when queue is full (i.e.,𝑞𝑆 =𝐾𝑆). So,𝐿𝑆 can be determined as
𝐿𝑆 =∑
𝑃 (𝑁𝑇 𝐶𝑃 1, 𝑁𝑇 𝐶𝑃 2, 𝑞𝑆 = 𝐾𝑆, 𝑞𝐶). (5) In SDN architecture, SYN packet drops at the controller when controller queue is full (i.e., 𝑞𝐶 = 𝐾𝐶). So, SYN packet loss probability in the controller 𝐿𝐶 can be obtained as
𝐿𝐶=∑
𝑃 (𝑁𝑇 𝐶𝑃 1, 𝑁𝑇 𝐶𝑃 2, 𝑞𝑆, 𝑞𝐶 = 𝐾𝐶). (6) (IV) Loss probability of SYN packet sent to the controller,
𝐿𝑆𝑌 𝑁1:
In our SDN system model, SYN packet is queued twice at the switch and once at the controller. So, SYN packet can drop either at the switch or at the controller. So,𝐿𝑆𝑌 𝑁1
can be determined as
𝐿𝑆𝑌 𝑁1= 1 − (1 − 𝐿𝑆)2(1 − 𝐿𝐶). (7) IV. RESULTS
In this section, we present the simulation and analytical results of 4D state and M/M/1 models [7] while varying different system parameters. We discuss the impact of the different parameters on average packet delay and packet loss probability for the two analytical models. We also calculate their error ratios by comparing with the simulation results.
Finally, we summarize major observations.
A. Simulation
In order to validate our analytical method, we developed a JAVA program (to implement packet-based simulation) which supports both flow-level arrivals and packet-level arrivals, following the assumptions of our queueing model detailed in Subsection III-A. The baseline parameter values (used for analysis and simulation) of 𝜆𝑃, 𝜆𝑇 𝐶𝑃, 𝜇𝑆, 𝜇𝐶, 𝜇𝑇 𝐶𝑃 and 𝑃𝐶 are 4000 packets/s, 20 flows/s, 30000 packets/s, 20000 packets/s, 25 flows/s and 0.25 respectively. We considered both switch queue size𝐾𝑆 and controller queue size𝐾𝐶 as 8. We
compared the simulation results by varying different system parameters:𝜆𝑇 𝐶𝑃, 𝑃𝐶, and 𝜆𝑃; and observed the impact of those parameters on performance metrics. While varying a system parameter, we kept other baseline parameters fixed.
Here, we simulated 3000 packets for every set of values and ran the simulation 2000 times.
B. M/M/1 model
M/M/1 model is the most commonly used model on ana- lyzing the SDN performance [7], [10], [11]. Actually, M/M/1 can achieve correctness to a certain extend for SDN which only considers packet-level arrivals [7]. So, we compared the analytical results of M/M/1 model with the simulation results to show the inappropriateness of the M/M/1 model.
The M/M/1 model assumes that the average packet arrival rates at the switch and at the controller follow a Poisson process with mean 𝜆𝑆 and𝜆𝐶, respectively. We use M/M/1 formula to derive the average packet delay in the switch,𝐷𝑆, and in the controller,𝐷𝐶, as
𝐷𝑆 =
( 1
𝜇𝑆− 𝜆𝑆 )
, 𝐷𝐶=
( 1
𝜇𝐶− 𝜆𝐶 )
. (8)
However, in our model, since the number of TCP2 connections is varied,𝜆𝑆and𝜆𝐶are difficult to obtain. To fair comparison, we measure 𝜆𝑆 and𝜆𝐶 from the simulation, and then using Eq, 8 we calculate𝐷𝑆 and𝐷𝐶. Afterwards, we can calculate the𝐷𝑑𝑎𝑡𝑎 and𝐷𝑆𝑌 𝑁1 as
𝐷𝑑𝑎𝑡𝑎= 𝐷𝑆, (9)
𝐷𝑆𝑌 𝑁1= 𝐷𝐶+ 2𝐷𝑆+ 2𝐷𝑆𝐶. (10) Paper [7] assumes an infinite buffer (for switch and controller) and uses the M/M/1 model, and thus does not investigate the issue of packet loss probability. Referring to [13], [14], the buffer is modeled as an infinite queue model and the queue is truncated at some finite integer 𝐾, so that the loss probability is obtained. We obtain the loss probability in the switch,𝐿𝑆, and in the controller,𝐿𝐶, as
𝐿𝑆= (𝜆𝑆
𝜇𝑆
)𝐾𝑆
, 𝐿𝐶 = (𝜆𝐶
𝜇𝐶
)𝐾𝐶
. (11)
Finally, we obtain the loss probability of SYN packets sent to controller in M/M/1 model as
𝐿𝑆𝑌 𝑁1= 1 − (1 − 𝐿𝑆)2(1 − 𝐿𝐶). (12)
C. Impact of𝜆𝑇 𝐶𝑃
Fig. 3 shows the impact of 𝜆𝑇 𝐶𝑃 on average data packet delay, 𝐷𝑑𝑎𝑡𝑎, for 4D state model and M/M/1 model. Fig. 3 shows that the analytical results of 4D state model are very close to the simulation results. Here, 𝐷𝑑𝑎𝑡𝑎 increases with the increase of 𝜆𝑇 𝐶𝑃 in both methods because the number of connections in the switch increases with increasing𝜆𝑇 𝐶𝑃, resulting in an increase in data packet arrival rate. However, the gap between 4D state model and M/M/1 model result of 𝐷𝑑𝑎𝑡𝑎is almost constant. Thus, using M/M/1 will overestimate 𝐷𝑑𝑎𝑡𝑎 and obtain a higher error rate. We also found that the
Fig. 3. Average data packet delay vs.𝜆𝑇 𝐶𝑃 Fig. 4. Data packet drop probability vs.𝜆𝑇 𝐶𝑃 Fig. 5. Average data packet delay vs.𝑃𝐶
Probability of redirecting to controller ( PC)
0.1 0.15 0.2 0.25 0.3 0.35 0.4
Data packet drop probability
#10-3
1 2 3 4 5 6 7
Analytical: M/M/1 Model Simulation: 4D state Model Numerical: 4D state Model
Fig. 6. Data packet drop probability vs.𝑃𝐶 Fig. 7. SYN packet and data packet delay vs.𝜆𝑃 Fig. 8. SYN packet and data packet loss probability vs.𝜆𝑃
error ratios of 4D state model and M/M/1 model against the simulation results on average data packet delay are 1.78% and 28.9%, respectively.
Fig. 4 shows the impact of𝜆𝑇 𝐶𝑃 on data packet loss proba- bility,𝐿𝑆, for 4D state model and M/M/1 model. Fig. 4 shows that the analytical results of 4D state model are very close to the simulation results, which can verify our correctness of 4D state model. Here,𝐿𝑆 increases with the increase of𝜆𝑇 𝐶𝑃 in both methods, because more connections in the switch appear, resulting in the increase in packet arrival rate. Initially data packet loss probability 𝐿𝑆, for M/M/1 model is lower than 4D state model but it becomes higher for M/M/1 model as 𝜆𝑇 𝐶𝑃 crosses 21 flows/sec. We also found that the error ratios of 4D state model and M/M/1 model against the simulation results on data packet loss probability are 3.11% and 13%, respectively.
D. Impact of 𝑃𝐶
Fig. 5 shows the impact of 𝑃𝐶 on average data packet delay, 𝐷𝑑𝑎𝑡𝑎, for 4D state and M/M/1 model. Fig. 5 shows that the analytical results of 4D state are very close to the simulation results, confirming its correctness. It was also found that,𝐷𝑑𝑎𝑡𝑎for M/M/1 model increases with increasing𝑃𝐶. As 𝑃𝐶increases, more data packets are redirected to the controller from the switch, which generates more packets to the switch from the controller, resulting in larger𝐷𝑑𝑎𝑡𝑎. But in our model, with increasing 𝑃𝐶, more SYN packets are redirected to the controller which does not affect𝐷𝑑𝑎𝑡𝑎. We also found that the
error ratios of 4D state model and M/M/1 model against the simulation results on average data packet delay are 1.26% and 8.5%, respectively.
Fig. 6 shows the impact of 𝑃𝐶 on data packet loss prob- ability, 𝐿𝑆, for 4D state model and M/M/1 model. Fig. 6 shows that the analytical results of 4D state model are very close to the simulation results, which verifies the correctness of 4D state model. Here, 𝐿𝑆 increases with the increase of 𝑃𝐶 for the M/M/1 model because more packets are sent to the controller, resulting in an increase in data packet arrivals from the controller to the switch, which increases packet loss probability. Initially, data packet loss probability𝐿𝑆, for M/M/1 model is lower than 4D state model but it becomes higher for M/M/1 model as 𝑃𝐶 crosses 0.3. We also found that the error ratios of 4D state model and M/M/1 model on data packet loss probability are 3.33% and 40%, respectively.
E. Comparison of SYN packets with data packets
Fig. 7 shows the average delay of SYN packets sent to the controller, 𝐷𝑆𝑌 𝑁1, and data packets, 𝐷𝑑𝑎𝑡𝑎, in 4D state model and M/M/1 model by varying𝜆𝑃. Fig. 7 shows that the analytical results of 4D state model and the simulation results are very close. It was found that𝐷𝑆𝑌 𝑁1 and𝐷𝑑𝑎𝑡𝑎 increase with increasing𝜆𝑃 because of more packet arrivals. However, they increase rapidly for M/M/1 model but slowly for the 4D state model. As a SYN packet visits the controller once and the switch twice, its delay is higher than the average delay of data packets. That means the time required to create a TCP
connection is much longer than the transmission time of data packets. Fig. 8 shows the loss probability of SYN packets, 𝐿𝑆𝑌 𝑁1, and data packets, 𝐿𝑆 in 4D state model and M/M/1 model by varying𝜆𝑃. Fig. 8 shows that the analytical results of 4D state model and the simulation results are very close. It was found that𝐿𝑆𝑌 𝑁1and𝐿𝑆increase as𝜆𝑃 is increased because of more packet arrivals. However, they increase rapidly for M/M/1 model but slowly for 4D state model. As a SYN packet can drop either at the switch or at the controller, 𝐿𝑆𝑌 𝑁1 is higher than the drop probability of data packets, 𝐿𝑆.
Finally, the error ratios of the analytical results of 4D state model and M/M/1 model on average data packet delay are 2.41% and 12.61%, respectively and on packet loss probability are 5% and 54%, respectively. On the other hand, the error ratios of 4D state model and M/M/1 model on SYN packet delay are 3.17% and 45.5%, respectively and on SYN packet loss probability are 10.1% and 60%, respectively. We can see the error ratios of 4D state model are significantly lower than that of M/M/1 model. Also the error ratios for SYN packets are larger than that for data packets. A SYN packet is queued twice at the switch and once at the controller. Therefore, the errors caused by the calculation for each queue is accumulated to a larger error ratio. On the other hand, a data packet is queued at the switch once, so its error caused by the calculation is only for the switch queue, resulting in a lower error ratio.
F. Summary of results
The following are the major observations from the results.
∙ 4D state model obtains significantly lower error ratios than M/M/1 model on delay and loss probability.
∙ The error ratios of SYN packets on delay and loss probability are larger than those of data packets.
∙ The error ratio of packet loss probability is larger than that of packet delay.
∙ When the network becomes more congested (larger𝜆𝑇 𝐶𝑃
or larger 𝑃𝐶), the error ratios become larger.
V. CONCLUSION AND FUTURE WORKS
In this paper, we have presented an analytical model for the performance analysis of TCP connections over SDN architecture considering one switch and one controller. We considered the control plane and the data plane jointly and created four-dimensional states, and calculated their steady- state probabilities, validated by extensive simulation. We have compared the analytical results of 4D state model with the simulation results on 𝐷𝑑𝑎𝑡𝑎 and 𝐿𝑆. Result shows that 4D state model can make a correct analysis and obtain low error ratios, ranging between 1.16% and 3.30% on average packet delay, and between 0.8% and 8.45% on packet loss probability.
However, using an M/M/1 model will generate high error ratios, ranging between 8.5% and 35.7% on average packet delay, and between 9.83% and 54% on packet loss probability.
This is because a 4D state model considers both flow-level arrivals and packet-level arrivals while M/M/1 model considers only packet-level arrivals.
We also observed the delay of SYN packets sent to the controller is significantly larger than the delay of data packets.
Further, the loss probability of SYN packets is larger than that of data packets. However, 4D state model can still generate correct analytical results for SYN packets. The error ratios of SYN packets are 3.17% on delay and 10.1% on loss probability. From the results, our analytical method (4D state model) can achieve excellent accuracy on packet delay and packet loss probability under the SDN environment that has the flow-level (TCP connection) arrivals and packet-level arrivals.
On the other hand, M/M/1 model generates high error ratios, meaning that, it is not applicable to the SDN environment.
REFERENCES
[1] B. Xiong, K. Yang, J. Zhao, W. Li, and K. Li, “Performance evaluation of openflow-based software-defined networks based on queueing model,”
Computer Networks, vol. 102, pp. 172–185, June 2016.
[2] S. Rowshanrad, S. Namvarasl, V. Abdi, M. Hajizadeh, and M. Keshtgary,
“A survey on SDN, the future of networking,” Advanced Computer Science & Technology, vol. 3, no. 2, pp. 232–248, 2014.
[3] A. Hakiri, A. Gokhale, P. Berthou, D. C. Schmidt, and T. Gayraud,
“Software-defined networking: Challenges and research opportunities for future internet,” Computer Networks, vol. 75, no. PA, pp. 453–471, December 2014.
[4] J. Pan, S. Paul, and R. Jain, “A survey of the research on future internet architectures,” IEEE Communications Magazine, vol. 49, no. 7, pp. 26–
36, 2011.
[5] ONF, “Software-Defined Networking: The new norm for networks,” April 2012. [Online]. Avail- able: https://www.opennetworking.org/images/stories/downloads/sdn- resources/white-papers/wp-sdn-newnorm.pdf
[6] ——, “SDN architecture overview,” December 2013. [Online]. Avail- able: https://www.opennetworking.org/images/stories/downloads/sdn- resources/technical-reports/SDN-architecture-overview-1.0.pdf [7] M. Jarschel, S. Oechsner, D. Schlosser, R. Pries, S. Goll, and P. Tran-Gia,
“Modeling and performance evaluation of an OpenFlow architecture,”
in International teletraffic congress, 2011, pp. 1–7.
[8] N. McKeown, T. Anderson, H. Balakrishnan, G. Parulkar, L. Peterson, J. Rexford, S. Shenker, and J. Turner, “Openflow: Enabling innovation in campus networks,” ACM SIGCOMM Computer Communication Review, vol. 38, no. 2, pp. 69–74, 2008.
[9] S. Azodolmolky, R. Nejabati, M. Pazouki, P. Wieder, R. Yahyapour, and D. Simeonidou, “An analytical model for software defined networking:
A network calculus-based approach,” in IEEE Global Communications Conference (GLOBECOM), Atlanta, GA, USA, Dec 9-13, 2013, pp.
1397–1402.
[10] G. Wang, J. Li, and X. Chang, “Modeling and performance analysis of the multiple controllers’ approach in software defined networking,” in 23rd International Symposium on Quality of Service. Portland, OR, USA: IEEE, June 15-16, 2015, pp. 73–74.
[11] K. Mahmood, A. Chilwan, O. Østerbø, and M. Jarschel, “Modelling of OpenFlow-based software-defined networks: the multiple node case,”
IET Networks, vol. 4, no. 5, pp. 278–284, 2015.
[12] B. Ciciani, A. Santoro, and P. Romano, “Approximate analytical models for networked servers subject to MMPP arrival processes,” in IEEE International Symposium on Network Computing and Applications, July 12-14, 2007, pp. 25–32.
[13] R. J. Simcore and T.-B. Pei, “Perspectives on atm switch architecture and the influence of traffic pattern assumptions on swtich design,”
SIGCOMM Computer Communications Review, vol. 25, no. 2, pp. 93–
105, 1995.
[14] S. C. Liew, “Performance of various input-buffered and output-buffered atm switch design principles under bursty traffic: Simulation study,”
IEEE Transactions on Communications, vol. 42, no. 234, pp. 1371–
1379, 1994.