An Analysis on Change of Land Price nearby the MRT Stations
in Taipei City
Abstract
The relationship between land price and transportation is interactive. Many important traffic infrastructures, such as MRT in the CBD, will promote land price. In the research we study the MRT system in Taipei by analyzing data of land price which is offered by Taipei city government. The data includes the period before and after MRT construction. According to the “bid rent theory” advocated by Alonso( 1964), we collect 230,070 price data from 1984, 1989, 1994, 1999 and 2004.
We classify 47 stations into five types: residential-pattern, commercial-pattern, mixed-pattern, core-pattern, and others. We calculate average land price for each station within the range of 250m. As a result, we set up four types of land price curves based on curve-estimation of Regression. We also test the results by t-test to see whether curves fit negative exponent function or not.
In this research we conclude four results: (1) MRT change the type of land price curve into negative exponent function. (2) For MRT, core-pattern land price curve decrease faster than that of residential-pattern. (3) MRT affects the land price before the system built. (4) The range of the most affected land price is within 200m.
Introduction
Modern MRT system stems from the traditional railroad system which George Stephenson invented in 1830. In 1863, the first train left from MRT station in London opened a new age in MRT history. Because of its huge load of tourists, MRT speeds up the interaction between land and traffic and changes the space structure. In Taiwan, it has been nine years since the Muzha line opened on March 28th, 1996 in Taipei. However, the discussion reference of this important traffic construction is limite. Right now the
Kaohsiung MRT is under construction, and the Taichung MRT is in planning stage. These will also change the original space structures of the two cities. Therefore, the discussions of effects between Taipei MRT system and land price can be the references for extension lines of Taipei MRT and construction of MRT in other two cities.
In this research, the land price variation illustrates the changes of space structure. The illustration is based on analysis of subordinate data, which includes timing (changes of five timings), space (distance from station center), price (announced land current value), and types (land usage types/station classifications), and observation of development
relationship for area around MRT stations.
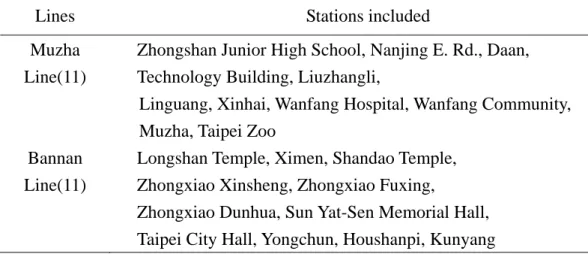
The objections of this research are areas around Taipei MRT stations. Every station is viewed as the core in Alson theory. We draw the average land price curves of the areas around the station before and after the station opened. We also classify the MRT stations, and analyze the differences of both average land price curves and effects before and after stations built. The analyzed spaces include areas for 250 km radius which are around 47 Taipei MRT stations. In this research the original five lines of Taipei MRT are simplified into four lines including Muzha Line, Bannan Line, Danshui Line, and Xindian Line. Please see table 1-1 and figure 1-1 below.
Table 1-1 MRT Lines classifications in this research
Lines Stations included
Muzha Line(11)
Zhongshan Junior High School, Nanjing E. Rd., Daan, Technology Building, Liuzhangli,
Linguang, Xinhai, Wanfang Hospital, Wanfang Community, Muzha, Taipei Zoo
Bannan Line(11)
Longshan Temple, Ximen, Shandao Temple, Zhongxiao Xinsheng, Zhongxiao Fuxing,
Danshui Line(17)
Taipei Main Station, Zhongshan, Shuanglian, Minquan W. Rd. , Yuanshan, Jiantan, Shilin, Zhishan, Mingde, Shipai, Qilian, Qiyan, Beitou, Xinbeitou, Fuxinggang, Zhongyi, Guandu Xindian
Line(8)
NTU Hospital, Xiaonanmen, Chiang Kai-Shek Memorial Hall, Guting, Taipower Building, Gongguan, Wanlong, Jingmei
Note: Taipei Main Station and Zhongxiao Fuxing are transfer stations. In this research the Taipei Main Station is classified in Danshui Line, and Zhongxiao Fuxing station is classified in Bannan Line.
Xiaonanmen station is classified in Xindian Line.
Analyses of Documentations on MRT Researches
The development of Mass Rapid Transit (MRT) has a history over 140 years in other countries. An article titled “Land use impacts of rapid transit: A review of the empirical literature”(Vessali, 1996), which can be found on UC Berkely periodical issue 11, 1996, analyzes and bind together all the researches on the impact of MRT from the past, including 37 influential papers since 1970 to 1995. In this documentation, the research has reached 10 conclusions on the impact of MRT as follows:
1. The impact on the model of development is modest.
2. The impact on the housing estate value of residential area is greater. 3. MRT has a critical impact on the estate market of commercial area. 4. The impact of Light Rail Transit (LRT) is minor.
5. The impact is greater to suburb area rather than city centre. 6. MRT has a critical impact on high income area.
7. The cause of the impact may be due to the skeptical estate investment activities. 8. The impact might cause change within a region.
9. The usage of land surrounding the stations would finally decline to commercial purposes.
10. MRT has a critical impact on the ratio of residential and commercial area.
This research shows that the development around MRT stations would cause significant impact on either density of development or land value, however, the range of impact is limited. Referring to some papers from the research, the impact range of a MRT station is approximately 1/3 mile (approx. 536m)(Sandag, 1984). The impact range of BART (Bay Area Rapid Transi) system is 1500 foot (approx. 457m)(Dyett & Castle, 1978). According to a large amount of papers in this research, the government’s policies toward land use, for example, the restriction on sectional land use, would have larger impact on city’s spatial structure than MRT system itself (Cervero, 1994).
Moreover, numerous of documentations also have brought the problem of skeptical buyers in the land market to light. Through their observation, many scholars have noticed that these skeptics would step into the market during “the traffic dark age” (the land value would soar to 30% within the range of 1000 foot, approx. 305m.). This is because that upon the operation of MRT, it would not bring a huge change to the land market around the stations (Falcke, 1978; Ayer & Hocking). Among the relevant research papers on land value in this country, we can also find some conclusions on the skeptical land market. Jiang Ru-yu’s (2001) once analyzed what impact would the operation of Ban-chiao line bring to the land value along the line. The research found out that after the realignment of MRT, the land value along the MRT track line of both sides was raised by 32.02%. During the construction of MRT, the land value dropped by 1.25%. Using the regression analysis to analyze on the land value and to predict the trend of the whole estate market, upon the operation of MRT, the land value would firstly reflect in its increase and has a minor increase of 2.41% in average.
MRT has the most significant impact on vacant land and developable land (Cervero R & J. Landis, 1997). The investment on MRT system can promote the surrounding housing estate value. The most important reason behind it is that the MRT promotes a better accessibility. These benefits include the mobility of traveling among different areas, the accessibility for pedestrians and the convenience for the commuters. After raising the housing estate value, the commerce activities would enter into the area.(Diaz, R.B., 1999) The MRT system in L.A. consists of red, blue, green and gold these four lines and a commute line. According to the research on L.A.’s MRT, the residential land value along these lines is not as high as the commercial land. This might be due to that most of the stations are located at the re-developed area (R. Cerverro & M. Duncan, 2002). In other words, the location of the stations would determine how the land would be developed in advance. The change of accessibility is an important factor of impact. Among the
value. Wu ji-hwa(1977) studied on what possible impact would the operation of Danshui line bring to the city development and land development of the surrounding area in Taipei- Danshui Corridor. The research found out that the accessibility is a very important factor for land development and land value change. The construction of MRT would lead to an increase of population and employment in Taipei-Danshui Corridor area, meanwhile, the distribution of the two would become more concentrated. The distribution of population would move toward Taipei city centre and both sides of the Corridor, and the population density curve and land value curve would be raised but more stable.
The land development surrounding MRT stations has always been an issue in relevant researches. MRT can not only increase the estate value of residential area surrounding the stations (Gatzlaff & Smith, 1993), it can also attract more prosperous commercial activities and promote the population density. The government uses the development around the stations as an index to evaluate its MRT traffic policy (Crampton, 2003), hoping to see a positive improvement MRT could bring. This is not only because MRT would create more employment opportunities (Cerverro, 1994), but also means that there would be more people using MRT. However, the researches on MRT in Taiwan so far cannot reach an agreement on this issue. Tsai yueh-ling(2003) analyzed the MRT stations in Taipei urban area and found out that the newly opened shops around the back-station area are mostlysellingdaily essentials. In addition, the difference among the various impacts which all types of stations caused is not obvious. Feng zheng-ming(1978) found out that the development of MRT would enlarge Taipei urban area, and cause the re-distribution of population, and the separation of residential and commercial areas.
The categories of MRT stations were determined by the land use model surrounding a station and the particular function of it. A research on MARTA system in Atlanta City (Bollinger, 1997) categorized the stations into five types: high-intensity urban mode, mixed-use regional mode, commuter station, community centre and neighborhood station. According to the conclusion of “Taipei Comprehensive Development Plan-Planning for the Impact of Mass Rapid Transit System on Taipei Spatial Structure” (Feng zheng-ming, 2001), Feng categorized the MRT stations in Taipei into 5 types, according to their particular functions: city-center mode, commercial mode, mixed mode, and residential mode. THI Consultant Ltd.(2002) categorize the future MRT stations in Kao-hsiung into 4 modes: city-core, comprehensive, regional and special function mode.
modes(urban, marginal and suburb mode), the distance to the station (within 100m, 100-300m, 300-500m), the use of building(residential, business office, commercial and mixed purposes), floor area, age of the house.
To sum up what we found in all the documentations, we reached some important conclusion as follows: 1. The accessibility is the main reason for the increase of the land value surrounding MRT, and distance is the main concern to assess accessibility. 2. The impact of MRT on the increase of land value can be sure, but another important issue is to find out it whether happens before or after the operation of MRT. 3. MRT has little effect on the city space structure, but it does have an impact on the area around MRT stations. As for the size of the impact range, there is still no conclusion among the documentations.
Research Design
1. Approach of the research analysis
In Vessali’s(1996) researches, he used “Before & After approach “ in 11 of his 37 researches. The purpose of “Before and After approach “is comparing the differences or variations between beginning and later periods after effects happen. The assumptions for this approach is that the effects before and after this period are the same, and the situations for the research areas are static (Wu cji-hwa, 1977). However, this approach is not enough for observing the changes of space structure around the MRT station, because the changes of structure might be based on other effects. Therefore, the “With and Without Approach”, which means the observation of space structure with or without the MRT system (Feng zheng-ming, 1978), should be also used.
In order to decide whether the bid rent behavior exists around the MRT stations, the approach in this research is based on the land price curve which shows the land price variation around the station. However, the past researches often viewed the city center, business center, important market, or traffic transfer center (eg. train station) as the single core of the researched city, and also found that MRT promotes land price. In this research, however, every station on MRT line is one of the research cores, and could be the center of commercial bid-rent model.
2. Research presupposition and restriction
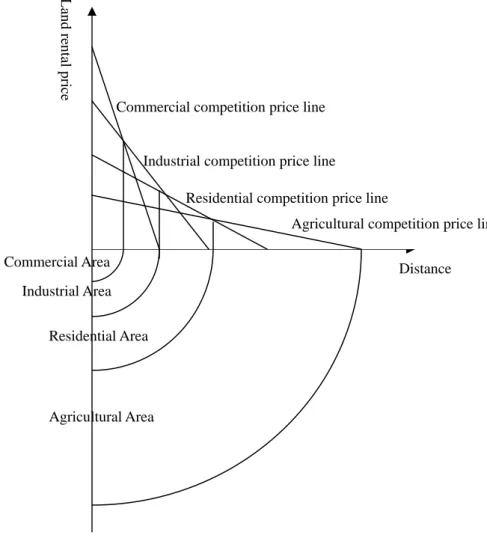
This research is based on the “The Bid-Rent Model for a Firm” by Alonso. This theory was based on von Thünen’s agricultural theory, and applied to the usage of urban commercial land. According to Alonso’s land-rental theory (1964), the land usage cost will be lower when the transportation cost is higher, if the ability of paying the rental is the same. Therefore, different land usage models provide different ability of paying the rental in single core model, and contribute to different land price curve. Because business can afford higher rental, commercial area is near the core of the city, and followed by industrial area, residential area, and agricultural area. Please see figure 3-1.
Figure 3-1: Bid rent of urban land usage Source: Space Economics, Tsong-Shen Yu, 1989
3. Research assumption
In this research we assume that “the land price curves of the area around MRT stations are negative index. The curve equation is:
Distance
Agricultural Area Residential Area Industrial Area Commercial Area
Commercial competition price line
Industrial competition price line
Residential competition price line
Agricultural competition price line
Land re
ntal
pri
( )
Br CelnP r = E q u a t i o n 1 r means the distance from the center
C means the intercept (central land price) B means the index
Therefore, the H0:B is assumed as positive, and H1:B is assumed as not positive.
4. Methods of data processing I. Station classification
According to classification method in Taipei's Comprehensive Development Plan (Cheng-Ming Feng and Tai-Shen Huang, 2001) in 2002, the stations are classified into five styles, which include City center, Commercial, Residential, and Mixed. However, it included only 33 of total 47 stations in this classification. In this research we therefore classify the rest stations according to the method mentioned above. Moreover, other functions are not conformable to Alonso’s theory and not included in our analysis. The lands for industrial, agriculture, or reservation usage are also not included in analysis. The classifications in this research are listed in the follow table:
Table 5-1-2 Function classifications of MRT stations Station
classification
Stations
City center(2) Taipei Main Station (Dan.), Ximen(Ban.)
Commercial(12) Zhongxiao Fuxing(Ban.), Zhongxiao Dunhua(Ban.), Shilin(Dan.), Zhongshan(Dan.), Minquan W. Rd.(Dan.), Shipai,(Dan.),
Jiantan(Dan.),
Chiang Kai-Shek Memorial Hall(Xin.), Gongguan(Xin.), Guting(Xin.),
NTU Hospital(Xin.), Longshan Temple(Ban.) Mixed (16) Liuzhangli(Mu.), Technology Building,(Mu.),
Wanfang Hospital(Mu.),
Zhongxiao Xinsheng (Ban.), Sun Yat-Sen Memorial Hall (Ban.), Shandao Temple(Ban.), Beitou(Dan.), Mingde(Dan.),
Yuanshan(Dan.) ,
Shuanglian(Dan.), Taipower Building(Xin.), Jingmei(Xin.),
Daan(Mu.), Zhongshan Junior High School(Mu.), Yongchun(Ban.), Nanjing E. Rd.(Mu.), Taipei City Hall(Ban.)
Residential (12) Muzha(Mu.), Wanfang Community(Mu.), Kunyang(Ban.),
Linguang(Mu.),Qiyan(Dan.), Zhishan(Dan.), Qilian(Dan.)
Note: - Source: Modified from Taipei's Comprehensive Development Plan, Cheng-Ming Feng and Tai-Shen Huang(2001).
- The stations marked in italics are new-added stations in this research.
II. Data collection process
The data sources come mainly from Taipei e-Map by Department of Urban Development and from announced land current value inquiry internet system by
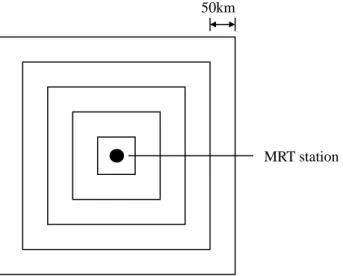
Department of Land, Taipei City Government. We inquired each data through internet, and divided the total period of data, which is from 1984 to 2004, into 5 minor periods, five years for a minor period. The five units are defined as 1984, 1989, 1994, 1999, and 2004. The collected data included all the data for registered land within 250 km around 47 open MRT stations, 46,074 records (include area, section, and number) for every five years and 230,370 recorders for total 20 years. Because of the restriction of the two internet systems above, the square area which the MRT station is in the center is divided into five equal sections, 50 km a unit distance. In addition, the distance which selected by Taipei e-Map includes all the data within the selected area; therefore, when analyzing a specific section, the data which do not included in the selected section is excluded. For example, when analyzing data ranges from 200km to 250km, the data within 200km is excluded; when analyzing data ranges from 150km to 200km, the data within 150km is excluded. As a result, we can get five groups of data for equal distance, as figure 3-2 shows below. Besides, the data of land usage distribution and its area within 250km around MRT stations is also need to be collected. The updated year of data collected is 2004, and the source is from Department of Urban Development, Taipei City Government.
50km
MRT station
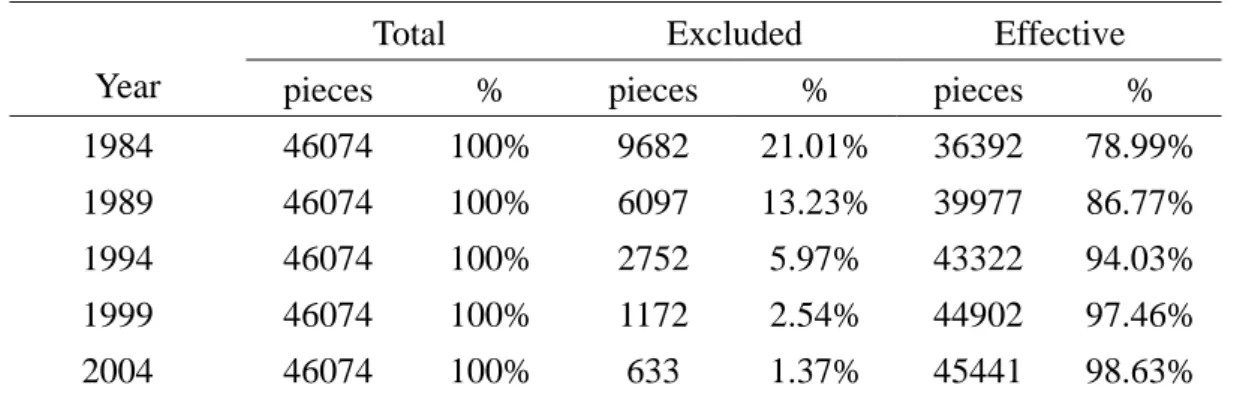
Because each data covers period for twenty years, some observed data changes from division or combination of registered land. The announced value of some lands in a specific year might not exist. Therefore, these data will be excluded in this research. Please see table 3-1. The excluded observed values in 1984, 1989, 1994, and 1999 are due to the non-exist announced land current values result from division or combination of registered land. The excluded observed values in 2004 are due to the announced value for 0 dollar when inquiring. Moreover, announced land current values are based on division estimate value. Therefore, every data of registered land is supposed to represent the excluded value.
Table 3-1 Statistics of observed values
Total Excluded Effective
Year pieces % pieces % pieces %
1984 46074 100% 9682 21.01% 36392 78.99% 1989 46074 100% 6097 13.23% 39977 86.77% 1994 46074 100% 2752 5.97% 43322 94.03% 1999 46074 100% 1172 2.54% 44902 97.46%
2004 46074 100% 633 1.37% 45441 98.63%
Note: The excluded observed values in 1984, 1989, 1994, and 1999 are due to the non-exist announced land current values result from division or combination of registered land. The excluded observed values in 2004 are due to the announced value for 0 dollar when inquiring.
Result and Discussion of Our Theory
1. The Land Value Curve of Residential Stations
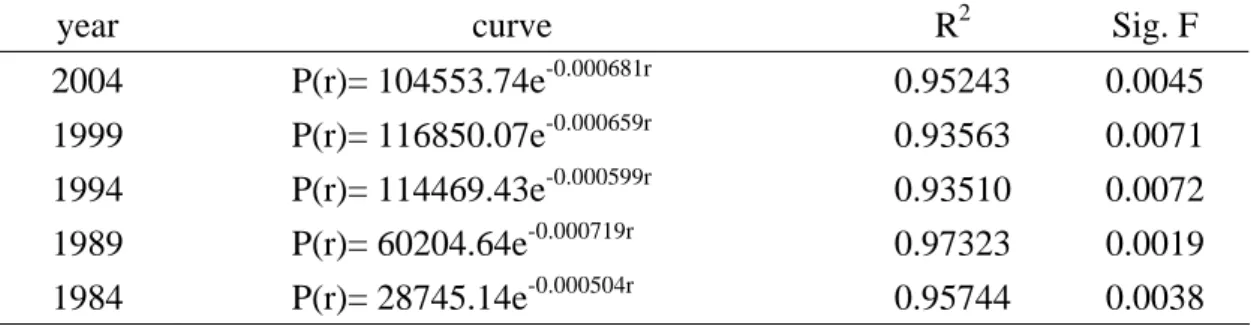
In our reserch, we adopt the method using the curve to estimate and find out that all the data of these five time-points match our assumption on the negative curve slope and with statistical significance too. The negative index was the highest in 1989, see table 4-1. Furthermore, although the curve of 1984 matches the negative slope, the decrease breadth is not wide. The value of the inner circle is slightly higher than the outer one. This might be due to the fact that most of the MRT stations are located at some main road junctions, therefore, they are easier to access than the inner streets.
the anticipation. This phenomenon matches the relevant reserches’ results in other countries. Therefore, the impact of residential stations is comprehensive and mild, only the inner circle area is more sensitive to the land value. The value difference between the very out and central circle is within20,000 NTD.
Table4-1 The formulation of the land value surrounding residential stations
year curve R2 Sig. F
2004 P(r)= 104553.74e-0.000681r 0.95243 0.0045
1999 P(r)= 116850.07e-0.000659r 0.93563 0.0071
1994 P(r)= 114469.43e-0.000599r 0.93510 0.0072
1989 P(r)= 60204.64e-0.000719r 0.97323 0.0019
1984 P(r)= 28745.14e-0.000504r 0.95744 0.0038
Source: our original document
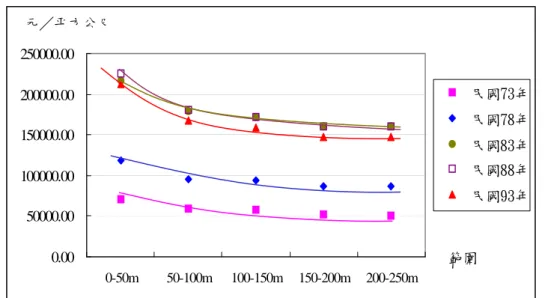
0.00 20000.00 40000.00 60000.00 80000.00 100000.00 120000.00 140000.00 0-50m 50-100m 100-150m 150-200m 200-250m 範圍 元/平方公尺 民 國 73年 民 國 78年 民 國 83年 民 國 88年 民 國 93年
Figure 4-1 The average land value curve of surrounding area of residential stations.
2. The Land Value Curve of Mixed Stations
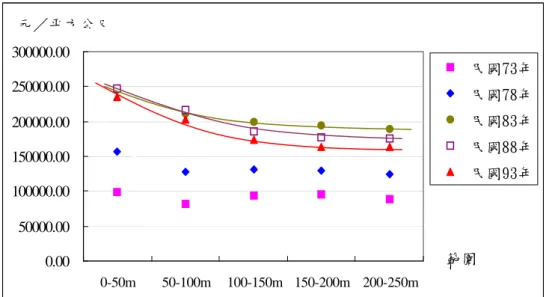
Land use of this type’s surrounding area is a mixture of commercial and residential purposes. Through our reserch, we identified that the curve also match our negative slope assumption and is with statistical significance. See table 4-2. The common quality shared with the residential station is that the average land value soared during 1989 to 1994. However, the difference is that the average land value is higher than the residential type, and the index is more significant too. Take the data of 2004 to examine on the value, the difference between the inner circle and the outer one is 64803.16 NTD, which the amount is bigger than residential type.
1999, 2004 are similar. The only difference is that the index had increased each year, especially in 2004. On contrary, the index from 1984 to 1989 was in decrease, however, it started to increase gradually since 1994. This shows that the value increase of surrounding area of mixed stations firstly started from the outer circle than to inner one.
Table 4-2 The formulation of the land value surrounding mixed stations
year curves R2 Sig. F
2004 P(r)= 204557.60e-0.001705r 0.81095 0.0371
1999 P(r)= 217663.84e-0.001596r 0.80918 0.0376
1994 P(r)= 210636.35e-0.001415r 0.82109 0.0340
1989 P(r)= 114177.09e-0.001418r 0.79854 0.0410
1984 P(r)= 70576.98e-0.001627r 0.88810 0.0165
Source: our original document
0.00 50000.00 100000.00 150000.00 200000.00 250000.00 0-50m 50-100m 100-150m 150-200m 200-250m 範圍 元/平方公尺 民國73年 民國78年 民國83年 民國88年 民國93年
Figure 4-2 The average land value curve of surrounding area of mixed stations
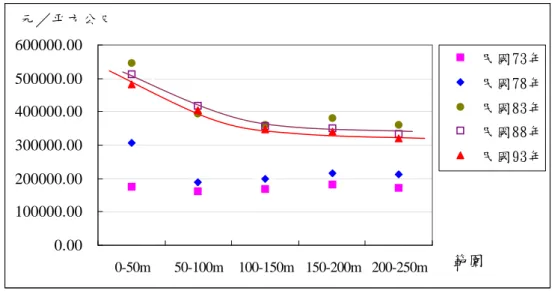
3. The land value curve of commercial area
value which starts from the station as its core. As for the reason for the increase of the index, it might be due to that between 1999 and 2004, the increase breadth of the land value within the range of 200 meter was relatively higher. This range is smaller than the one was used in the reserches in other countries. The other phenomenon which is different from other types is that the central land value of commercial type station presented a feature of balancing decrease since 1994 to 2004.
Table 4-3 The formulation of the land value surrounding commercial stations
year curves R2 Sig. F
2004 P(r)= 234649.92e-0.001888r 0.88252 0.0177
1999 P(r)= 246946.46e-0.001737r 0.88404 0.0174
1994 P(r)= 240282.71e-0.001191r 0.84771 0.0265
1989 - 0.62233 0.1127
1984 - 0.01183 0.8618
Source: original document
Note: the “-“ shown in the above table means the t factor didn’t reach the statistical significance. 0.00 50000.00 100000.00 150000.00 200000.00 250000.00 300000.00 0-50m 50-100m 100-150m 150-200m 200-250m 範圍 元/平方公尺 民國73年 民國78年 民國83年 民國88年 民國93年
Figure 4-3 The average land value curve of surrounding area of commercial sta
. The land value curve of city center area
category of city center type, Taipei Main
Stati , it
s tions
4
There are two MRT stations fall in the
value from 1989 to 1994 increase dramatically, but the index still did not match the negative index model. It is not until 1999 the index matched the negative index mod the index is higher than the commercial type. The price difference between inner and outer circle even reached 163,724.19 NTD.
el and
Table 4-4 The formulation of the land value surrounding city center stations
Sig. F year curves R2 2004 P(r)= 480400.15e-0.001995r 0.90482 0.0128 1999 P(r)= 505374.63e-0.002075r 0.87415 0.0197 1994 - 0.62642 0.1107 1989 - 0.24035 0.4018 1984 - 0.05679 0.6995
Source: our original document
e table means the t factor didn’t reach the statistical
. Comprehensive analysis
4-5 to observe the curve index of 2004 of all types of stations, Note: the “-“ shown in the abov
significance. 0.00 100000.00 200000.00 300000.00 400000.00 500000.00 600000.00 0-50m 50-100m 100-150m 150-200m 200-250m 範圍 元/平方公尺 民國73年 民國78年 民國83年 民國88年 民國93年
Figure 4-4 The average land value curve of surrounding area of city-center stations
5
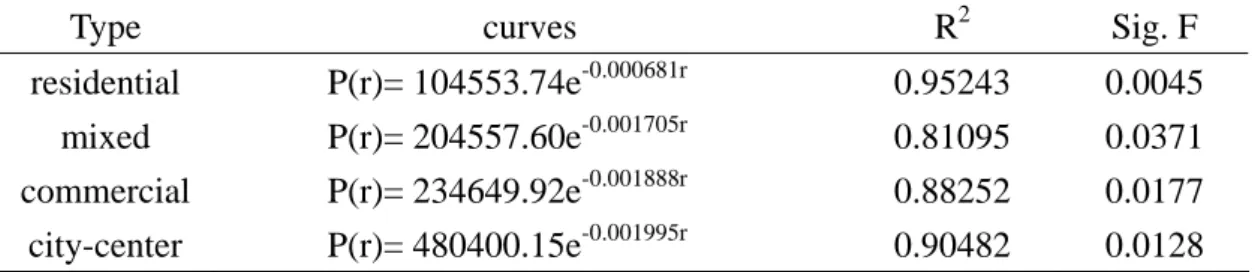
Using table 4-5 and figure
the negative model before (commercial and city center type) had started to adjust to the outward degression negative index model.
Table 4-5 The formulation of the land value around all types of stations in 2004
. F
Type curves R2 Sig
residential P(r)= 104553.74e-0.000681r 0.95243 0.0045
mixed P(r)= 204557.60e-0.001705r 0.81095 0.0371
commercial P(r)= 234649.92e-0.001888r 0.88252 0.0177 city-center P(r)= 480400.15e-0.001995r 0.90482 0.0128
S iginal do
igure 4-5 The average land value curve around all types of stations in 2004 ource: our or cument
F 0.00 100000.00 200000.00 300000.00 400000.00 500000.00 600000.00 0-50m 50-100m 100-150m 150-200m 200-250m 範圍 元/平方公尺 住宅型 住商型 城市中心型 商業型
Result and Conclusion
1. The land value curve s competitive bidding curve
ch is collected from 1984 to 2004, which started at the time d
al urrounding MRT station areas is a
in a negative index model. The data used in this resear
2. The impact range of MRT station is 200 meters.
e land value of city center type is a lot
little.
. The realignment of MRT promotes theincrease of land value. The land value T..
on
. Different types of stations cause different impact.
ation would have different features.
adth, the
nd In terms of the land value surrounding the stations, th
higher than all the other types. The prices of commercial and residential types are close, but still have minor difference. The land value of surrounding area of Residential type is
relatively much lower. From the previous analysis, we found out that the land values difference of inner and outer circle between the residential and mixed type stations is The reason might be due to the limited impact range of MRT stations, as said in the documents. The impact range for Taipei MRT system might be within 200 meters.
3
curves gradually adjusted to fit in the negative index model after the operation of MR The increase breadth of land value of all-type station reached the biggest during 1989 to 2004. The value curve of 1994 has shown that the increase breadth of land value of the areas closer to the stations is wider than the outer circle area. This shows that the impact had already been there before the operation of MRT. Meanwhile, the anticipation caused the land value to soar- this agrees to the other research documentations in other countries. Some types of the station did not show the negative index feature before nor after the realignment of MRT. However, the curves changed after the operation of MRT to the negative index model. This means that the MRT system would cause different impact land value during different period.
4
The competitive bidding curves of different types of st
In terms of the average land value, it is the highest in city center, then commercial, mixed and finally the residential type. The different between commercial and mixed type is little. As for the degression of land value, it is the most obvious in city center type, then
commercial, mixed type. The mildest is the residential type. As for the increase bre
References
于宗先,1989,「空間經濟學」,台北市:聯經。 王運銘,1976,台北市捷運系統對土地使用之影響研究,交大運研,碩士論文。 江如鈺,2001,捷運板橋線通車對板橋市沿線地價影響之研究,台北縣板橋地政事務 所。 吳濟華,1977,台北─淡水走廊捷運鐵路之影響研究,中興都市計畫研研究所碩士論 文。 馮正民,1978,捷運系統對台北都會區發展之影響研究,交通大學運輸研究所碩士論 文。 馮正民,許侶馨,1989,"屬性價格函數在捷運北淡沿線地價分析之應用",都巿與計 劃,第 16 卷,PP.113-130。 馮正民,曾平毅,王冠斐,1994,"捷運系統對車站地區房價之影響",都市與計劃, 第 21 卷第 1 期,PP.25-45。 馮正民、黃台生,2001,台北市綜合發展計畫─捷運網絡發展對台北市都市空間結構 影響之規劃,台北市都市發展局委託,交通大學運輸研究所。 馮正民,楊靜音,1989,”台北都會區大眾捷運系統紅線對沿線地區發展之影響研究”, 運輸計劃季刊,第 18 卷第 3 期,PP.349-367。 楊王豪,1988,大眾捷運系統對土地使用之衝擊研究,中興大學都市計畫研究所碩士 論文。 葉昭憲,2001,都市土地利用變遷模式建構之研究─以台中市重劃區為例,國科會計 畫。 蔡岳霖,2003,捷運系統營運前後車站周邊地區商業發展之變化,交通大學運輸研究 所碩士論文。Alonso W. (1964). “Location and Land Use”(4th ed.). Massachusetts: Harvard University press.
Axhausen, K. W., & Schmid, W. A. (2003). “Infrastructure, accessibility and spatial development”. The Future of Urbanised Landscape NSL/ETHZ.
Bollinger, C. R., & Ihlanfeldt, K. R. (1997). “The Impact of Rapid Rail Transit on Economic Development: The Case of Atlanta’s MARTA”. Journal of Urban Economics 42, pp. 179-204.
Carter, B. (2001). “Fort Worth Transit Alternatives Analysis-Transit Supportive Land Use Policies”, Texas: The Fort Worth Transportation Authority.
Cervero, R. (1994). “Rail transit and joint development: Land market impacts in Washington, DC and Atlanta”. Journal of the American Planning Association, V60n1 (Winter, 1994), pp. 83-94.
Cervero, R., & Duncan, M. (2001). “Transit's value-added: effects of light and commuter rail services on commercial land values”. University of California.
Cervero, R., & Duncan, M. (2002), “Land Value Impacts of Rail Transit Services in Los Angeles County”. National Association of Realtors & Urban Land Institute.
Cervero, R., & Landis, J. (1997). “Twenty years of the Bay Area Rapid Transit System: Land use and development impacts”. Transportation Research Part A, Volume 31, No. 4, pp. 309-333.
Crampton, G. (2003). “Economic development impacts of urban rail transport”. European Regional Science Association, ERSA conference pp. 295.
Diaz, R. B. (1999). “Impacts of Rail Transit on Property Values”. APTA 1999 Rapid Transit Conference Proceedings Paper.
Gatzlaff, D. H., & Smith, M. T. (1993). “The Impact of the Miami Metrorail on the Value of Residences Near Station Locations”. Land Economics, Vol. 69, No. 1, pp. 54- 66. Gibbons, S., & Machin, S. (2003). “Rail Access and House Prices, An Evaluation of the
Wider Benefits of Cross-Rail”. Report for the Department of Transport.
Gibbons, S., & Machin, S. (2004). “Valuing Rail Access Using Transport Innovations”. Centre for Economic Performance Discussion Paper No. CEPDP0611.
Haider, M., & Miller, E. J. (2000). “Effects of Transportation Infrastructure and Locational Elements on Residential Real Estate Values. Application of Spatial Autoregressive Techniques”. Transportation Research Record, 1722, pp. 1-8.
Harvey, B., & Asabere, P. K. (1985). “Factors Influencing the Value of Urban Land: Evidence from Halifax-Dartmouth, Canada”. Areuea Journal, vol.13:4, pp. 361-377. Helling, A. A., & Sawicki, D. S. (2003). “Race and Residential Accessibility to Shopping
and Services”. Housing Policy Debate, vol. 14, no. 1:69-101.
Jud, G. D. (1980). “The Effects of Zoning on Single-Family Residential Property Values: Charlotte, North Carolina”. Land Economics, 56, pp. 142-154.
Kawamura, K. (2004). “Transportation Needs, Location Choice, and Perceived Accessibility for Business Establishments”. Chicago: University of Illinois.
Study of Alameda County Homes”. TERM PAPER for Civil Engineering 254, Transportation Economics at the University of California at Berkeley.
Levinson, D. M.(1998). “Accessibility and the Journey to Work”. Journal of Transport Geography, 6:1, pp. 11-21.
McCann, P. (2001). “Urban and regional economics”. New York : Oxford University Press. Office of the Deputy Prime Minister (2002). “Land Value and Public Transport”. RICS
Policy Unit.
Opaluch, J. J., & Grigalunas, T., & Diamantides, J., & Mazzotta, M., & Johnston R. (1999). “Recreational and Resource Economic Values for the Peconic Estuary System”. Report prepared for the Peconic Estuary Program. Suffolk County Department of Health Services. NY: Economic Analysis.
Tse, Chung Yi & Chan, Alex WH. (2001). “Estimating the commuting cost and commuting time property price gradients”. Hong Kong Institute of Economics and Business Strategy Working Papers.
Vessali, K. V. (1996). “Land use impacts of rapid transit: A review of the empirical literature”. Berkeley Planning Journal, 11:71-105.