行政院國家科學委員會專題研究計畫 成果報告
永續性資訊溝通對公眾教育與行為模式之影響–台南市短
距交通個案分析
計畫類別: 個別型計畫 計畫編號: NSC94-2211-E-006-028- 執行期間: 94 年 08 月 01 日至 95 年 07 月 31 日 執行單位: 國立成功大學環境工程學系(所) 計畫主持人: 福島康裕 計畫參與人員: 李秉璋 報告類型: 精簡報告 處理方式: 本計畫涉及專利或其他智慧財產權,1 年後可公開查詢中 華 民 國 95 年 10 月 31 日
Communication of sustainability information for public
education and behavior change
- A case study on short distance commuting in Tainan City
Yasuhiro Fukushima
Department of Environmental Engineering,
National Cheng Kung University
Contents
Chapter 1 Executive SummaryChapter 2 Communication strategies and compilation of information
Chapter 3 Application of computer assisted personal interview
1. Executive Summary
Development of more efficient and cleaner technology and upgrading of regulations including emission standards are approaches focusing on supply-side that are often emphasized in achieving sustainable society. Considering that industrial activities are driven by final demand of citizens, demand-side management is also indispensable. Regulations and voluntary actions through public education are the double wheels of such demand-side management. In some leading countries, more information is appropriately interpreted and disclosed to promote voluntary shifts in daily life style, viewing at citizens as a more active actor in the challenge towards sustainability issues. However in Taiwan, in spite of increasing knowledge in environmental sciences, only few of their interpretation is delivered to the citizens. Therefore, citizens have no effective material for making more sustainable, beneficial choices in their daily consumption activities.
The contribution of this project could be separated into two major parts. First, a communication strategy for such a voluntary shift in consumption activities and a framework for compilation of information used in the communication is proposed. The strategy consists of three main approaches: 1) to present environmental information together with other relevant information for decision making, 2) to provide information that is customized to a target group, and 3) to present personalized information through interactive communication. The proposed strategy and framework is demonstrated with a case study on the motorcycle commuting of Taiwanese university students. The methods demonstrated in this paper would be helpful in construction of communication strategies for other targeted groups and for other consumption activities.
An effective tool that communicates how citizen’s choice on a consumption activity could make differences in various sustainability aspects is needed. A consumer activity however, is often varied in details and if so, the information delivered by such tool need to fit to the individual citizens. As the second contribution of this project, effectiveness of application of computer-assisted personal interview (CAPI) as a communication tool is examined. This tool aims at delivering information to catalyze voluntary action shift of a target consumer group, for a particular consumption activity. It receives input from the citizen, and provides information that is personalized to the individual citizens. In our case study, personalized sustainability information, namely monetary expense, CO2 emission, health damage, accident risk, and convenience of different commuting modes is communicated to students in National Cheng Kung University (NCKU) using our CAPI. A survey conducted in
this study showed that 52.4% of the motorcycle commuting students increased their level of willingness to adopt more sustainable commuting mode, and 27.6 % of motorcycle commuting students agree to alternate to adopt sustainable commuting mode or use sustainable commuting mode more frequently after they received comprehensive set of information provided in the survey. It’s expected to reduce 4.656×10² tons of CO2 emission, 1.14×10⁶ NTD on external health damage cost, and 9.44 years of DALYs loss due to traffic accident if applied to all the 17,600 students in NCKU.
Keywords: Communication, Voluntary shift, Sustainable consumption,
CAPI, transportation, motorcycle
Presentations:
1. B.Lee, Y. Fukushima, “Reinforcing environmental information
communication by providing safety and monetary aspects - Case study
on commuting mode alternatives of college students”, Proceedings of
Chinese Institute of Environmental Engineers, 2005
2. Y. Fukushima, B. Lee, “Communication of potential environmental
impacts and risks of motorcycle use”, Proceedings of The First Annual
meeting of the Institute of LCA Japan, 2005
Publications:
1. Y. Fukushima, B. Lee, “Communication strategies and compilation of
information for making voluntary shifts towards sustainable
consumption”, under review
2. B. Lee, Y. Fukushima, “Application of interactive computer-assisted
personal interview for promoting voluntary shifts towards sustainable
consumption”, in preparation
2. Communication strategies and compilation of information
2.1 Introduction
Recent discussions on sustainable development indicate that both production and consumption need to change their current courses to lead global society to a sustainable future (Hertwitch, 2005a, 2005b). With regard to production systems, business incentives often work efficiently to change producers’ behavior towards a more sustainable course. Political measures such as carbon tax, would also influence the way industry uses fuel and energy, and recycling and fuel efficiency regulations will change the priorities in the way products are designed. However, changing the course of citizens’ consumption behavior seems a more challenging task. Regulations have limited capability to prescribe our consumption behavior in modern society. Incentives have a wider range of application, but still are limited. Incentives could be implemented only if it is obviously beneficial to the entire society, and only to the extent that it does not violate fairness in the market and among taxpayers. In order to massively change the course of consumption towards a more sustainable direction, voluntary learning and a voluntary shift in consumption patterns should be encouraged, in addition to improvements in the production system.
Though there are a large number of environmental studies, lots of data on emissions and hazards, and collections of articles introducing sustainable living schemes, only a limited amount of such information has been delivered to consumers to encourage them to reconsider their current unsustainable consumption behaviors. At least three reasons for this can be identified. First, such information is scattered widely and in different forms, and is not accessible in systematic and appropriate ways. Secondly, the key driving force to people reconsidering unsustainable habits is not well understood, so the useful data is not organized in effective forms. Finally, consumption patterns are varied for different groups of consumers, and useful information for one group of consumers might not be so useful for others. Conversely, knowledge that is useful for every type of consumer tends to be less relevant to individuals’ specific daily consumption patterns.
For example, information relevant to the opportunities of improvements in sustainability aspects of daily transportation could be found as follows.
Motorized private transportation, such as motorcycles in Taiwan, is convenient, especially in the places where public transportation is less developed. Taiwan is known as the highest motorcycle-density region in the world, and the per square kilometer motorcycle density was 366.64 in 2005 (MOTC, 2005). The Institute of
Transportation at Ministry of Transportation and Communications (MOTC) of Taiwan (2002) predicts that without an effective motorcycle restriction policy, the motorcycle growth rate would remain at +3.8% till the year 2012. The environmental consequences of consumers’ commuting choices include energy and resource depletion, global warming, air pollution, and noise pollution. In addition to the environmental aspects, convenience, traffic congestion, safety levels, damage due to traffic accidents, and economic factors are specifically relevant to people’s choices. According to Environmental Protection Administration of Taiwan (TEPA) (2000), about 20% of major air pollutants, namely NMHC, TOC, and CO in Tainan city are emitted from motorcycles. Statistics from the World Health Organization (2002) show that road traffic injuries rank as the leading cause of “Burden of Disease from Injuries” among the 15-29 age group in high-income countries of the Western Pacific region. Another statistics from the Department of Health of Taiwan (2004) also shows that deaths due to accident ranks as the leading cause of death among the age group of 15-24 years, and traffic accidents account for 81% of deaths due to accidents. Institute of Transportation at MOTC of Taiwan (2004) has drawn several important conclusions on safety, such as that bicycle riders suffer much a higher fatal accidents rate per distance traveled. However, this is based on average Taiwanese users, so if we specify different groups, the statistics would look very different. Usually, the alternatives to motorcycles include public transportation, private car, bicycle and others (in-line skate, walking….etc.). The most preferred alternative to motorcycles for the general public in Taiwan is private cars (Yang C.M., 2003), which is actually worse in terms of fuel consumption and thus global warming. On the economic side, the Institute of Transportation at MOTC of Taiwan (2000) conducted a census of road vehicle operating costs, including maintenance and repair costs, in which the annual total expense in using a motorcycle was estimated by both survey and accounting. For example, the average engine repair cost for a motorcycle used in Taiwan is 239 NTD/year, and the average engine oil refill cost is 1847 NTD/year.
Those figures reveal the relationship between motorcycle usage and the inferior air quality of Taiwan, and show that traffic accidents are the major threat to young people’s lives. However, mere accumulation of such information without effective communication does not cause a shift in people’s reliance on motorcycles.
In general, economic aspects are considered important for consumers, however, it must be noted that already existing taxation policies and the recent rise in fuel prices seems to have caused no reduction in motorcycle commuting. Self-accounting of motorcycle expenses is not widely practiced among citizens, even if the economic assessment of motorcycle use is not complex. People are just not accustomed to assess
economic (or any other) burdens so often by themselves. Rather, the perceptions constructed in Taiwanese society might have more effect on their choice of transportation. For example, typical Taiwanese people’s perceptions on motorcycles include the following:
1) “The heavier the safer”: This traditional viewpoint is widely ingrained in Taiwanese’s public’s mind. Thus a bicycle is perceived as inferior to a motorcycle without objective evaluation.
2) “Universal habit”: Owning a motorcycle is considered a matter of course for Taiwanese people, and once they own a motorcycle, it makes them feel that they should get the benefit of their initial investment by using it more.
3) “The fastest for short distance travel”: It is considered that traveling by motorcycle is much faster than by bicycle.
Those perceptions are actually questionable, and need more distinct evaluation. Motorcycles drive closer to cars in Taiwan, and their faster speed could result in more serious accidents. The conclusion from Institute of Transportation at MOTC of Taiwan (2004) mentioned above seems to support perception one, however, such an averaged and per-distance comparison could be misleading because motorcycles will have a longer travel distance than bicycles. By owning a motorcycle, users might travel longer, so if the per-distance risk is the same, it implies more absolute risk per time compared with bicycles. In addition, the Taiwanese average does not necessarily apply to a specific person, because motorcycle use is diverse. Regarding the second perception, using a motorcycle more might not be the most economic choice, because it will require more fuel, maintenance, and repairs. “Getting the benefit of the initial investment by it using more” may not apply to a product like motorcycles. Finally, the difference in commuting time might be less than it is considered. Most of the rides in urban Taiwan are fairly short, and if downtown parking is difficult and traffic jams limit speed, often giving bicycles an advantage.
Those possibly misguided perceptions have to be overcome in order to actually shift behavior. Currently, the scattered information available is not effective in overcoming those barriers.
The objective of this paper is to present a methodology to identify, choose, compile and deliver information that is relevant to the consumption choices of a selected targeted group, to provide a case study to demonstrate the methodology, and to discuss essential issues in the methodology. Students at National Cheng Kung University are selected as a target groups in the case study. Taiwanese students are
known as heavy users of motorcycles and the areas around universities are full of motorcycles. There are no regulations to encourage students to use motorcycles less for commuting to school or going for lunch, which are usually very short distances and could be easily replaced by other forms of transportation. The basic strategies that build up the methodology are 1) to communicate all relevant aspects at the same time and in a comparable manner, 2) to provide information that is customized to a target group, and 3) to present personalized information through interactive communication for key varying parameters.
Communication of environmental information is not a new topic. For example, eco-labeling makes it possible for consumers to consciously choose among similar products. Furthermore, providing an accounting tool called an environmental balance sheet (EBS) has been practiced in Japan since the 1980s (Morioka, 1985). Fukushima and his colleagues (Fukushima et al., 2005) discussed the information flows for a progressive use of customized environmental balance sheets. In their study, the effectiveness of customization of information to be delivered to the users of EBS is emphasized. Its information flow includes collection of the balance sheet filled in by consumers, and adapted information is delivered in the next version of the balance sheet. However, the customization method and choice of contents was not systematically discussed in their study. A comprehensive framework focusing on efficient communication to a targeted group of consumer, focusing on a single consumption activity has not been previously proposed.
2.2 Methodology
Figure 1 presents the simple overview of the communication strategy and methodology proposed in this study. It consists of four major steps.
First, the target of communication is chosen either by identifying consumption activities that could be causing issues, or by identifying issues related to consumption patterns. Once both the issue and the consumption activity of focus are identified, a target of communication could be chosen. The target will be a group of consumers, characterized for example by working status (student, housewife, etc.), by user of relevant product or service (car drivers, TV watchers, meat eaters, etc.), or by roles in the society (teacher, parent, child), that are most influential to the issue. To define the appropriate target consumer group, sometimes a survey on the composition of the consumer would be needed. By setting the focus of the target of communication on a smaller audience, more customized and thus more relevant information could be delivered to the target group. The more focused a group is defined, the more difficult to obtain the information from published statistics, because usually those statistics are
done for groups of greater granularity (e.g. at the national, county, or city level) with less variation in the type. In such cases, data could be obtained from the management body of that group (e.g. school administration for students) or through a relatively smaller scale survey (because the population of the survey would be smaller).
Next, the type of information to be communicated should be decided. In this step, all the information categories that could be relevant to the consumers’ when they consider their usual course of activities (e.g. cost, convenience, time, amenity, environmental impact, safety, etc.) should be identified. In addition, the existing and potential options should be enumerated. Reinforcement of limited knowledge of how consumers make decisions and what the options for groups of consumers are could be obtained by survey or interviews. However, it must be noted that sometimes consumers are not aware of what type of information could be influential to their reconsideration of consumption habits; therefore, merely relying on survey or
Choose target of communication
- Identify consumption activities that could be causing issues
- Identify issues related to consumption patterns - Choose target consumer group
Decide what kind of information should be communicated
- Identify relevant categories - Identify relevant options
Prepare the information to be communicated
- Identify which parameters are still varying among the members of the target consumer group
- Collect values that are common among the members of the target consumer group
- Add the identified parameters in characterization models
- Quantify different potential consequences by choices of options
- Identify qualitative differences
Communicate the compiled information
- Ask for input of varying information
- Calculate varying items among consumers
- Let the target consumer group reconsider consumption patterns by delivering compiled information
interviews with consumers might not be sufficient. The options chosen here would be subject to the comparison in the following step, and the consumers will reconsider what choices they would take according to the options raised in this step.
In the following step, the data customized for the target consumer group will be prepared. The differences among the options customized for the consumer groups are obtained. In addition, models to derive personalized values on some of the consequences that are important and varying among different consumers are developed. There are both quantitative and qualitative data that are referred to by consumers when making consumption pattern choices. To prepare quantitative data, we need different kinds of characterization models in addition to the intensity of activity. Survey or interviews to measure the consequences could compensate for the missing information for characterization. Existing characterization models are usually not exclusively developed for the target consumers. Therefore, customization of models is often required. Furthermore, some parameters could vary among the individuals in the target consumer group. If those parameters make important differences in the characterization of consequences, those data should be retrieved from each individual consumer, to calculate and communicate personalized information. In principle, such parameters should be limited, because most of the parameters in the characterization models should already have less variability by choosing a group of consumers with similar attributes as the target of communication. To realize such an interactive characterization and communication, characterization models should include the varying parameters, and such models should be used for communication. This is possible by providing the model as a simple list or factor. If the calculation is more complex for the consumers, interactive tools such as computer-assisted personal interview (CAPI) would be necessary.
Once customized and personalized information is ready, it will be delivered to the consumers through appropriate media. Consumers will be asked to input personalized information to create personalized results, and those results will be communicated and induce reconsideration of consumption choices. Preparation of guiding measures for the varying activities would be effective in aiding consumers to input their information compensating their recognition limits. The media could take the form of articles, environmental balance sheets (EBS), CAPI tool, or dynamic web pages.
Articles in the news, newspapers, magazines, reports and flyers are the most conventional communication media, and thus most widely acceptable, although only offering non-interactive communication. Personalization of data will be relatively difficult through those media.
EBS has an advantage in allowing consumers to derive information by themselves, which will deepen their understanding of the relationships between their choices and consequences. The shortcomings are that 1) it requires users to calculate the results by themselves, which is sometimes too difficult or tiresome for them, and that 2) the level of dynamic adaptation of contents is relatively limited because of the printed paper format. Those shortcomings could be dealt with by preparing the EBS as software instead of printed papers.
CAPI is a method of interview whose objective often includes retrieval of data from respondents in addition to the information delivery. For more convenience, a notebook computer could be used as the presentation tool in CAPI. Unlike traditional questionnaire, CAPI could be used for measuring effects of communication on consumers by asking additional questions after communicating relevant information and considering the results of personalized analysis. The communication potential is thus very high with CAPI. The questions and information to be delivered could be highly interactive and dynamic, and it could use different means of display such as pictures, sound, and movies for communication.
A Dynamic Internet page generates contents reflecting user actions on a web page, and could be used for the communication discussed in this paper. The difference between the CAPI tool and a dynamic web page is that CAPI is face to face system, while the web page could be used by anonymous consumers. Internet sites could also retrieve user responses that to see the effectiveness of communication in changing behavior after delivering the information; however, it would be difficult to avoid bad information contaminating the retrieved dataset, because of anonymous nature of the system.
2.3 Case Study
In this section, a case study on transportation options for students in National Cheng Kung University (NCKU) in Taiwan demonstrates the application of the proposed methodology.
2.3.1 Step 1: Choose target of communication
Identification of the target of communication could start either by finding an activity of interest, or by choosing issues of interest. In this case study, from the especially high motorcycle density around the university area, students were identified as the target consumer group, and commuting to school was chosen as the consumption activity of interest. One could start from concern about students’ injury by accidents and choose the same activity and consumer group. It was quite clear that the majority of motorcycle users around the university were students at NCKU.
2.3.2 Step 2: Decide what kind of information could be communicated
From several interviews to students, safety, economic and environmental (health, CO2 emission) issues, and convenience (speed) were identified as the most important factors in the students’ reconsideration of their commuting method. Convenience (time) was an important factor for most of the students interviewed, while some mentioned that bicycles are more dangerous and worse for their health, because they will be exposed to more exhaust gas due to the longer commuting time. Students who choose not to use a motorcycle raised economic and environmental concerns (health, CO2 emission, resource consumption) as reasons.
Because no statistical data on the how students commute was available, a preliminary survey was conducted to identify commuting behavior and the traffic accident record of NCKU students. The survey was performed from April to June, 2005, at the library and computer center of NCKU, with the face-to-face interview approach. Those locations were chosen because we could expect more uniform student distribution, without lacking any specific population (i.e. grade, sex, department, address, and commuting modes). Students at the two locations were randomly asked to fill in a short questionnaire. 276 effective answers were collected and questions were asked on each respondents’ main commuting mode and accident record in the recent year in Tainan downtown area (type of ride, type of injury, injury duration, whether they informed the school guard office or not, and repair cost for each accident).
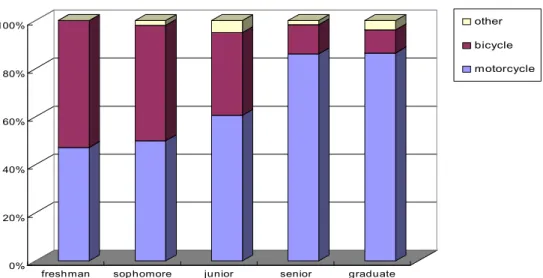
As shown in Fig.2, 66.3% of surveyed students use motorcycles and 31.2% use bicycles as their main commuting mode. The motorcycle commuting rate increases as students stay longer in the university. 2.5% of respondents neither commute by motorcycle nor bicycle (5 cases by walking and 2 cases by car). From this figure, we could identify three major options for students: motorcycle, bicycle, and walking.
It should be noted that the options that are not taken at present should not be overlooked. In the area around NCKU campus, buses and taxis could be considered as possible options, but they were ruled out as effective options from following reasons. Buses are not feasible for students, considering that busses in Tainan city they do not follow a schedule, that is the location of buses is not given by a dynamic bus information (or e-bus) system using Internet and telephone, while time management for students is crucial. Meanwhile, taxis are too expensive for students’ daily use.
In some cases, emerging options should be considered, such as electrical motorcycles and subway. However, no such options are predicted to be available in the near future.
2.3.3 Step 3: Prepare the information to be communicated
In the previous step, safety, environment (health), economy, and time were identified as the communicated categories. All of those aspects could be quantified using different characterization methods with appropriate localization, customization and personalization, as shown below.
0% 20% 40% 60% 80% 100%
freshman sophomore junior senior graduate
other bicycle motorcycle
Figure 2 Commuting patterns of NCKU students by student status Average motorcycle commuting rate is 66.3%, with 95% confidence level,
2.3.3.1 Safety
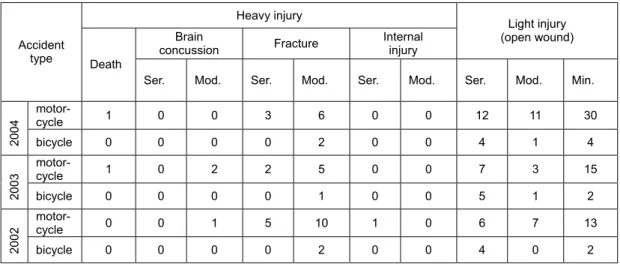
Differences in safety between different commuting modes are quantified by performing a survey on downtown traffic accidents of student and then by combining it with traffic accident data from the NCKU school guard office. NCKU school guard office records traffic accidents that involve NCKU students on annual basis, as shown in Table 1. The reason why additional survey had to be conducted was due to the nature of these statistics, in that only serious accidents would be reported. Adopting those injury data could result in biased figures, because of lots of unreported moderate and minor accidents. Actually, we found out that only 4 out of 62 cases of downtown traffic accidents in our survey were registered on the accident record with the school administration. Meanwhile, students who died from traffic accidents during our survey period would obviously not be able to take part in the survey. Therefore, simply using survey data would merely replace one bias with another bias. This study took a hybrid approach to solve this dilemma: using 1) guard office data for fatal cases and 2) survey data for non-fatal cases.
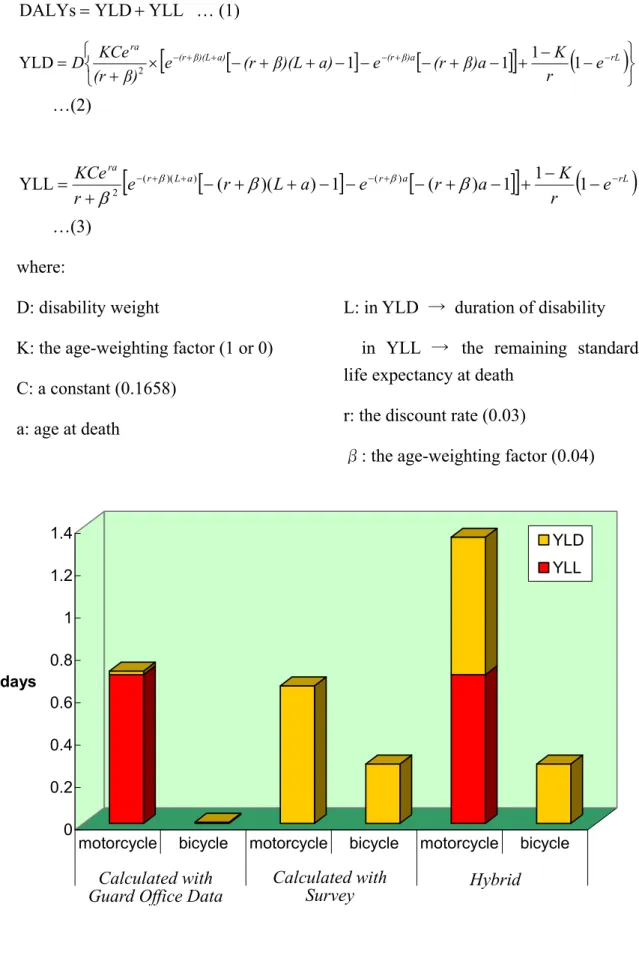
The data was characterized into disability-adjusted life years (DALYs), by combining the collected data with disability weight and duration of injuries from accidents, to represent the life damages of daily commuting. DALYs is a comprehensive indicator which can present the various risks of different commuting options (Murray at al., 1996). As shown in equation 1, DALYs is calculated as a sum of Years Lived with Disability (YLD) and Years of Life Lost (YLL), calculated with equations 2 and 3 respectively.
Table 1 NCKU students’ traffic accident records (2002-2004) from school guard office
Ser. : Serious, Mod: Moderate, Min: Minor Heavy injury Brain concussion Fracture Internal injury Light injury (open wound) Accident type Death
Ser. Mod. Ser. Mod. Ser. Mod. Ser. Mod. Min. motor- cycle 1 0 0 3 6 0 0 12 11 30 2004 bicycle 0 0 0 0 2 0 0 4 1 4 motor- cycle 1 0 2 2 5 0 0 7 3 15 2003 bicycle 0 0 0 0 1 0 0 5 1 2 motor- cycle 0 0 1 5 10 1 0 6 7 13 2002 bicycle 0 0 0 0 2 0 0 4 0 2
YLL YLD DALYs= + … (1)
[
]
[
]
[
]
(
)
⎭ ⎬ ⎫ ⎩ ⎨ ⎧ − − + − + − − − + + − × + = ra −(r+β)(L+a) −(r+β)a e−rL r K β)a (r e a) β)(L (r e β) (r KCe D 1 1 1 1 YLD 2 …(2)[
]
[
]
[
r L a r a]
(
rL)
ra e r K a r e a L r e r KCe − + + − + + − − − + − + − + − − − + = ( )( ) 1 ( ) 1 1 1 YLL ( )( ) ( ) 2 β β β β β …(3) where: D: disability weightK: the age-weighting factor (1 or 0) C: a constant (0.1658)
a: age at death
L: in YLD → duration of disability in YLL → the remaining standard life expectancy at death
r: the discount rate (0.03)
β: the age-weighting factor (0.04)
Figure 3 DALYs associated with commuting options of NCKU students calculated with different methodologies 0 0.2 0.4 0.6 0.8 1 1.2 1.4 days
motorcycle bicycle motorcycle bicycle motorcycle bicycle YLD YLL
Calculated with
Figure 3 shows the DALYs associated with motorcycle and bicycle commuting on a per person and annual basis in this case study. The left most figure represents the DALYs value calculated based only on the school guard office record, whereas the center figure represents the value based on our survey. As we see, the YLD and YLL values are significantly underestimated in the left and center figures, respectively. The YLD value from the registered accident record is 39 times smaller than the YLD value from the direct survey in motorcycle cases (0.649 versus 0.019) and 48 times smaller in bicycle cases (0.2800 versus 0.0058). This figure clearly shows the legitimacy of the hybrid use of survey with guard office statistics in estimating the actual damage from injury in traffic accidents. The rest of the discussions use the right most (hybrid) result. Motorcycle-commuting students suffer 2.32 times (0.65 day over 0.28 day) more per-person YLD than bicycle-commuting students per one year of commuting. Furthermore, the DALYs loss for motorcycle-commuting students is 4.82 times (1.35 day over 0.28 day) as much as for bicycle commuting students.
Table 2 tells us the differences in accident occurrence rates and seriousness of accidents. YLD per single accident in our survey shows the tendency that accident happened on motorcycle commuter is severer than that of bicycle commuter. Accident experience rate is the rate of students who were involved in a downtown traffic accident in the recent year. Serious accident rate is calculated by dividing the number of cases with disability duration longer than 2 weeks by the total number respondents. In both accident occurrence and serious accident rates, motorcycle commuters suffer higher damages. This result for students in Tainan differs from the research on Toronto city (Aultman-Hall et al., 1999), which reported that absolute event rate per bicycle kilometer were found to be between 26 to 68 times higher than rate for automobile travel.
DALYs values are constructed based on uncertain variables. For example, Arnesen et al. (2004) pointed out uncertain variables, such as discount rate, have high sensitivity for DALYs. In this case study, a sensitivity analysis to look at the fluctuation of value of DALYs was performed to check if our study introduced significantly sensitive parameters or not. The sensitivities of discount rate, injury duration, standard life expectancy, disability weight, and number of deaths per year are presented in a tornado graph in Fig. 4. A 30% variation range was set for injury duration obtained from survey, disability weights given by GBD, and death number of deaths per year obtained from the guard office. A 10% variation was set on Taiwanese standard life expectancy, because less fluctuation is expected for this variable. The discount rate ranges from 0 (no discounting) to 0.03 (standard discount rate taken from GBD). Figure 4 indicates that the discount rate is still the most sensitive
parameter of all the variables under our variation setting. This finding corresponds well with the results of Arnesen et al. (2004), and indicates that we did not introduce any parameter more sensitive than those inherent to DALYs.
The DALYs model was used without any modification, but the data was taken from different sources to mitigate the limitations of data availability. Localization of values has been made, by using local data for standard life expectancy. No customization for students of NCKU was done. No personalization parameter was involved in the calculation of DALYs for safety aspects.
Table 2 Rates and seriousness of accidents for bicycles and motorcycles
YLD for single accidents Accident experience rate Serious accident rate
Motorcycle 2.48 days 26% 4%
Bicycle 1.72 days 16% 3%
-30 -20 -10 0 10 20 30 40 50 60 standard life expectancy
injury duration disability weight number of deaths per year discount rate
% Change in DALYs
2.3.3.2 Time (representing convenience)
Commuting time could be a crucial factor when choosing commuting mode. It should be noted that the difference in traveling time between commuting media could be actually less significant than the theoretical difference in speed. For example in our case study, the NCKU campus is located in a downtown area next to the Tainan railway station, thus traffic signs and rush hour traffic make the maximum traveling speed of nearby roads slower. Therefore, in this case study, calculation of commuting time requirements for each respective option were based on local travel speed data from real on-road travel speed tests around NCKU conducted in this study. The calculated data was verified by the official travel speed survey from Tainan city government (Taiwanese Construction and Planning Administration, 2001) as a reference. In this way, comparison on an assumed commuting scenario could be provided according to an individual’s current daily commuting time usage.
A study by Taiwanese Construction and Planning Administration (2001) measured the average travel speed in 8 main arteries of Tainan. Travel speeds, as shown in Table 3, were derived by dividing the distance of measured route by actual travel time, including traffic light stops, regulations, and jams. However, the speed was measured for cars, not for motorcycles and bicycles. Moreover, some of the major arteries taken by students are not measured in their report. In this case study, three typical on-road transportation scenarios were set up to obtain the travel speed by motorcycle and bicycle around NCKU. The length of each route is around 2 kilometers. The same method as Table 3 was used to obtain the average speed of bicycles and motorcycles.
Table 3 Car travel speed (km/hour) in Tainan City on 8 main arteries
Morning rush hour Afternoon rush hour Road south Æ north north Æ south south Æ north north Æ south average
Zhonghua W. Rd. 21.1 24.9 13.5 14.9 18.6 Zhonghua E. Rd. 23.7 23 22.6 22. 8 23.0 Dongmen Rd. 21.4 16.4 19.8 18.9 19.1 Guomin Rd. 20.3 22 23.7 28.1 23.5 Gongyuan Rd. 20 19.2 16.4 17.9 18.4 Jinhua Rd. 22 20.2 19 18.6 20.0 Beimen Rd. 20 23.1 17 19.3 19.9 Jiankang Rd. 18.9 19.1 20.6 21.3 20.0 Overall average 20.3
Table 4 shows the travel speed ratio between bicycle and motorcycle in the three tested routes of our case study. The average travel speed of motorcycles is 19.1 km/h, which is consistent with the data from Table 3. Bicycle travel speed is 12.9 km/h. Motorcycle travel speed is thus 1.48 times faster than bicycle.
Table 4 Motorcycle and bicycle travel speed (km/hour) on 3 NCKU students commuting routes
Bicycle-commuting students have advantages in time consumption because bicycles are allowed inside NCKU campus while motorcycles are not. Therefore, bicycle commuting students spend less time walking from their parking space to their classroom. In this case study, 2 minutes “walk through” time is assumed for walking and bicycle commuters based on experience. Walk through time for motorcycles will be obtained depending on the location of their parking and their destination in the campus, so it will be personalized for each student.
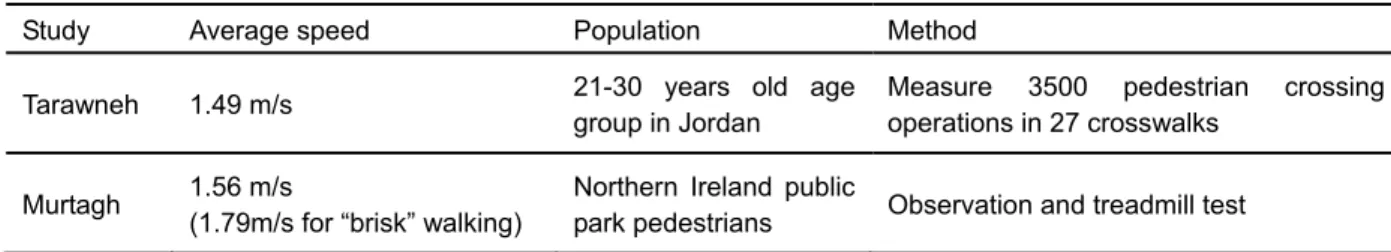
Average effective walking speed for NCKU students commuting is set at 1.25 m/s assuming the walking speed as 1.5 m/s, with 1 minute traffic light stop required every 5 minutes walk. This walking speed is assumed based upon preceding studies (Murtagh. et al., 2002) (Tarawneh, 2001) as shown in Table 5.
Table 5 Average walking speed in preceding studies
Study Average speed Population Method Tarawneh 1.49 m/s 21-30 years old age
group in Jordan
Measure 3500 pedestrian crossing operations in 27 crosswalks
Murtagh 1.56 m/s
(1.79m/s for “brisk” walking)
Northern Ireland public
park pedestrians Observation and treadmill test
Motorcycle Bicycle
Morning rush hour Afternoon rush hour Morning rush hour Afternoon rush hour
Route 1 21.4 28.7 13.7 15.2 Route 2 18.7 13.7 14.0 10.5 Route 3 18.6 13.7 12.1 11.8 19.6 18.7 13.3 12.5 Average 19.1 12.9
To summarize the above discussions, we could provide individual students with customized and personalized information on time requirements for different commuting options using equation 4, based on the fact that the distance between school and home does not depend on commuting methods.
(Ti - ti )* si = const …(4) where:
i = {motorcycle, bicycle, walk}
Ti : Overall travel time using commuting method i
ti : Walk through time using commuting method i
si : Speed using commuting method i
twalk = tbicycle = 2 min swalk = 4.5 km/hour sbicycle = 12.89 km/hour smotorcycle = 19.14 km/hour
For example, if a student who travels to school using a motorcycle changes to bicycle commuting, we could use the following equation 5 to estimate the expected commuting time by bicycle, from the current overall commuting time by motorcycle, and their walk through time.
Tbicycle = (Tmotorcycle - tmotorcycle) × smotorcycle / sbicycle + tbicycle = (Tmotorcycle - tmotorcycle) × 19.14 / 12.89 + 2 …(5)
The characterization model for time consumption is developed according to the commuting situation in NCKU, while the same model could be applied to many other cases considering varying parking time offset.
2.3.3.3 Economic cost
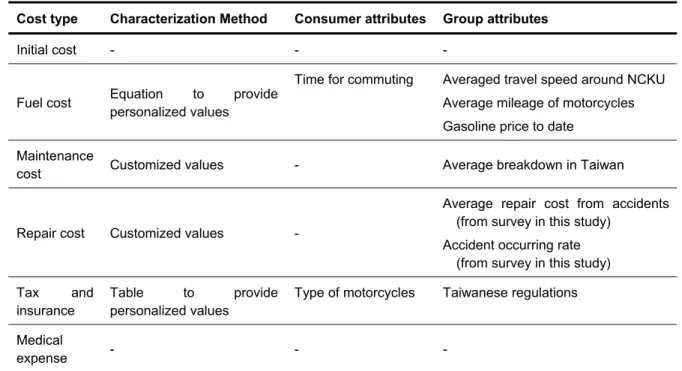
Economic cost could be divided into initial, fuel, maintenance, repair costs, and tax as depicted in Table 6. In this case study, we focus on fuel, maintenance, repair cost, and tax, considering the current high motorcycle owning rates for students. Fuel cost on different commuting modes is discussed in detail. We quote government reports and develop a typical use scenario to estimate the rest of the costs of bicycles and motorcycles. Fuel expense and tax are subject to personalized quantification to fit the individual’s commuting habits.
Mileage data for motorcycles is important from an economic as well as environmental perspective. Table 7 shows the mileage data for all kinds of motorcycle available on the Taiwanese market (Bureau of Energy at MOEA, 2004). This data was obtained by applying different prescribed driving patterns to simulate more realistic conditions. However, the data was taken from brand new vehicles, so it is considered
Cost type Characterization Method Consumer attributes Group attributes
Initial cost - - -
Fuel cost Equation to provide personalized values
Time for commuting Averaged travel speed around NCKU Average mileage of motorcycles Gasoline price to date
Maintenance
cost Customized values - Average breakdown in Taiwan
Repair cost Customized values -
Average repair cost from accidents (from survey in this study)
Accident occurring rate (from survey in this study) Tax and
insurance
Table to provide personalized values
Type of motorcycles Taiwanese regulations Medical expense - - - Engine displacement 50 cc 80 cc 100 cc 125 cc 150 cc Mileage (km/L-gasoline) 42.4 39.5 39.1 38.4 38.3 Average (km/L-gasoline) 39.5
Table 5 Economic cost in this case study
to be valid only for relatively new motorcycles. To cope with this limitation, the data shown in Table 8, taken from dynamometric tests from another study (Wang, 2002) was taken. The study identified regional driving patterns in 4 major cities in Taiwan, and used dynamometer test on different kinds of motorcycles on the road to obtain air pollutant emission factors and mileage data on the driving patterns in respective cities. Although it does not have data for different engine displacements, we considered that the data from the latter study would more accurately represent the actual mileage of students’ motorcycles.
To calculate fuel expense, the gasoline price should be obtained in addition to the mileage data. Due to the steep rise of oil price in recent months, the price to date was used instead of an annual average.
From mileage, gasoline price, and typical travel speed around the university area described in the previous section, annual fuel expense of commuting (C) could be calculated with equation 6.
gasoline motorcycle motorcycle motorcycle t s M P T C =( − )/60⋅ / ⋅2⋅365⋅ …(6) where,
C: Annual individual fuel expense of commuting (NTD) M: Average mileage of motorcycle (34.09 km/L) P: Price of gasoline (28.01 NTD/L)
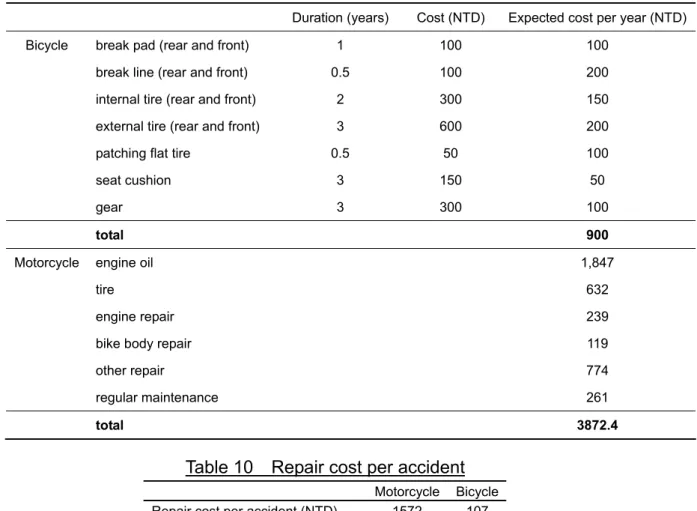
The “Vehicle Operation Cost Survey”10 conducted by Institute of Transportation at MOTC (2000) estimated the various expenses associated with motorcycle ownership, via 1) account tracing on selected respondents (effective sample less than 10), and 2) direct survey using questionnaire (224 effective samples). In this case study, data from the latter method was used. On the other hand, statistical research on local bicycle maintenance costs is not available in Taiwan. To deal with the lack of information, we consulted with local bicycle shop, and obtained experience-based data on bicycle maintenance to estimate the annual maintenance cost. The bicycle maintenance scenario assumed here is under the premise of maintaining bicycle in good condition, which should be considered as the maximum cost for bicycle maintenance in NCKU, although poorly maintained bicycles are more often seen on campus. The maintenance cost is compiled in Table 9.
Cost is correlated also with safety in this case study, because accidents will require repairs to motorcycles and bicycles. In this case study, average repair costs per accident is collected in the pre-survey, as shown in Table 10. Repair cost for motorcycles are obviously greater than that of bicycles for one accident. In addition, higher YLD per accident is expected to result in higher medical treatment cost, but this difference was not assessed. All the motorcycles on the road in Taiwan are registered with the MOTC of Taiwan, and users should pay fuel and license taxes and essential insurance. The rates vary according to engine displacement of motorcycle, as shown in Table 11 (Directorate general of Highways at MOTC, 2006) (Financial Supervisory Commission, 2006).
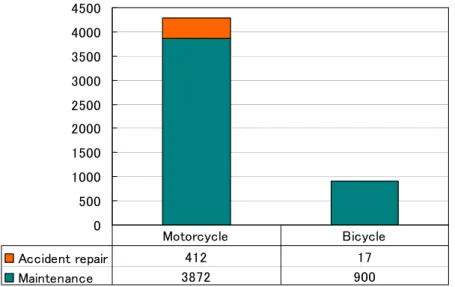
Figure 5 shows the differences in annual repair and maintenance costs, integrating information from Tables 8 and 9, incorporating the accident occurring rates obtained from our survey. Amount of fuel, tax, and insurance costs that are personalized to each consumer will be added to this figure when costs would be communicated. The cost calculation model is developed according to Taiwanese local situations, such as gasoline price, tax, maintenance cost, and travel speed. Furthermore, cost will be calculated according to the travel time (or distance) of individual students so personalized information will be delivered.
0 500 1000 1500 2000 2500 3000 3500 4000 4500 Accident repair 412 17 Maintenance 3872 900 Motorcycle Bicycle
Table 6 Motorcycle mileage in 4 major cities in Taiwan from dynamometric test
City Taipei Taichung Kaoshiung Pingtung
Mileage
(km/L-gasoline) 30.54 31.53 34.02 40.25
Average
(km/L-gasoline) 34.09
Duration (years) Cost (NTD) Expected cost per year (NTD) Bicycle break pad (rear and front) 1 100 100
break line (rear and front) 0.5 100 200 internal tire (rear and front) 2 300 150 external tire (rear and front) 3 600 200
patching flat tire 0.5 50 100
seat cushion 3 150 50
gear 3 300 100
total 900
Motorcycle engine oil 1,847
tire 632
engine repair 239
bike body repair 119
other repair 774
regular maintenance 261
total 3872.4
Table 10 Repair cost per accident
Motorcycle Bicycle
Repair cost per accident (NTD) 1572 107
Table 8 Annual taxes and insurance for motorcycles
Data taken from Directorate General of Highways, MOTC(2006) and Financial Supervisory Commission (2006) of Taiwan
Engine displacement (cc) Fuel Tax License Tax Essential Insurance Total
50 300 0 560 860
51-125 450 0 767 1217
126-150 600 0 767 1367
150- 600 1650 767 3017
2.3.3.4 Environment and health
To present quantitative figures for differences in environment and health impacts, various emissions associated with the activities in chosen options should be characterized. In addition, choice of impact categories should be made, and questions on what indicator should represent the chosen impact category and how to integrate multiple indicators if needed should be answered.
In Taiwan, all the motorcycles on the road should conform to the exhaust gas emission standard, and the government implements nonscheduled random on-road spot checks to ensure specific pollutants (CO and Hydrocarbons) in exhaust gas not exceeding the regulated concentration. Exhaust gas emission standards (TEPA, 2001), shown in Table 12, could be used if there is no other data representing actual emission conditions. In this case study, data from dynamometric tests is used as emission factors. One of the dynamometric test (Wang, 2002) which was referred to in the mileage calculation was used to derive CO2, CO, NOx, and Hydrocarbon emissions. To compensate for the lack of PM10 emission data in this test, results from another dynamometric test (Yang, H.H., 2004) were used. The tests in the second study were carried out in the cold state, which introduced inevitable inconsistency with the emission factors for the rest of the pollutants. The combined emission factors are shown in Table 13
Once quantified, those emissions should be interpreted with more relevant values to the consumer choices of transportation options. In this case study, human health damage and contribution to global warming were chosen as such relevant categories for students in NCKU. In this study, the Life cycle Impact assessment Method based on Endpoint modeling (LIME) from JEMAI (2002, 2006) was used to characterize pollutants into health damage in monetary terms, and an equivalent activity approach was chosen to present the amount of CO2 associated with transportation options, choosing air conditioning as the equivalent activity.
The application of LIME for this study introduces errors from the mismatch of assumptions. Meteorological and geographical conditions, background concentration of pollutants, and values are different in Japan (the target of the LIME method) and in Tainan, located in southern Taiwan. However, among other damage oriented endpoint models such as Eco-Indicator 99, LIME could be better applied to Taiwan, because population density is close to Japan’s. Other local alternatives such as Taiwanese Green GDP (Taiwan Provincial Government, 2006) and Taiwanese traffic ecological footprint (Hsu, 2003) were considered, but both methodologies have flaws in
characterizing the pollutions we focused on. Taiwanese green GDP calculates the abatement cost using best available control technology based on emission standards and regulations, therefore, this approach is not appropriate in characterizing pollutions that could be lower than the emission standards but still have potential impacts. Taiwanese ecological footprint accounts for land needed for direct and indirect requirements, but it is simply not capable of considering air pollution. It only accounts for the energy used in operating motorcycles (gasoline) and bicycles (food for man power) and does not cover pollution issues.
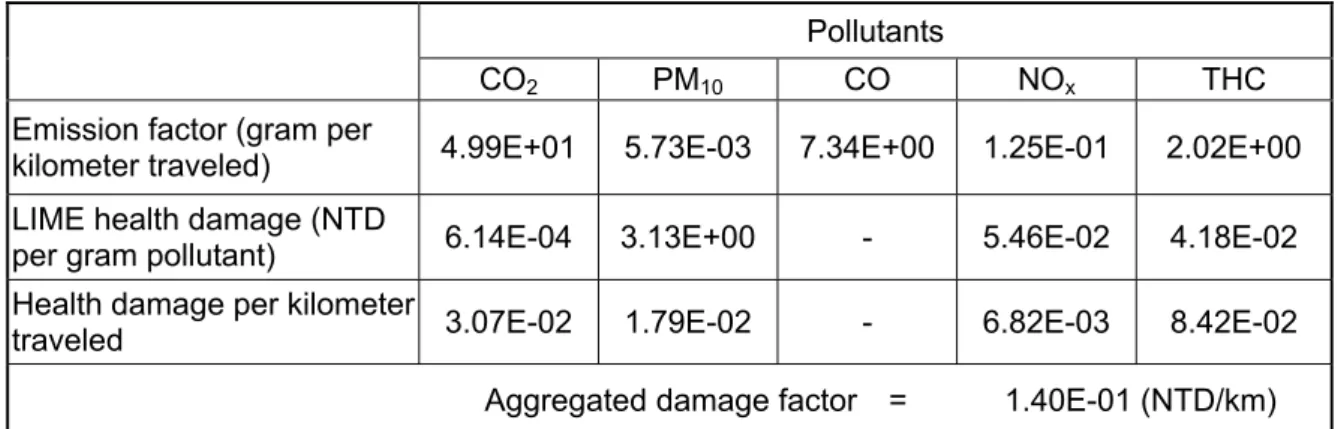
In this case study version 3 integration of the LIME database was used to represent the health damage from air pollution caused by motorcycle use. This method provides DALYs converted into monetary units using conjoint analysis. Table 14 shows the integrated health damage of each motorcycle-oriented pollutant in monetary terms. The aggregate damage factor calculated by LIME is 0.14 NTD per kilometer of travel by motorcycle, which is 3.63 times over the aggregated damage factor calculated by the Taiwanese Green GDP system. The fact that CO2 is a gas with no odor and color means one can’t easily perceive how much CO2 is emitted from the tailpipe of motorcycles. This nature of CO2 results in the insufficient awareness of motorcycle users, despite recent rise of public interest in global warming and climate change issue. In this case study, we provide equivalent time of air conditioning operation in Taiwan as a quantitative and easily perceivable indicator. CO2 emission per minute of travel by motorcycle was calculated according to equation 7.
G = (Tmotorcycle - tmotorcycle) / 60 * smotorcycle × E …(7) where,
G: CO2 emission from riding motorcycle (gram)
E: CO2 emission per kilometer traveled by motorcycle (gram, 57.18 in this study) Assuming the power demand of a typical air conditioner for single room is 1 kW, and 1 kWh of electric power contributes 660 gram of CO2 emission (Environmental Protection Administration, 2006) with the present electric power supply structure in Taiwan, we could provide equivalent air conditioning time for students’ motorcycle commuting time.
Version 3 integration of the LIME model was used without any modification. The emission factor of pollutants is based on Taiwanese local measurement data. Amount of pollution will be calculated and presented according to the personal commuting time (travel time and the walk through time) input, and the emission factor. Therefore, emissions will be personalized to the individual students.
Table 11 Aggregate damage factor (external health damage cost) based on LIME (presented in monetary term*) *original data is presented in Japanese Yen, the currency is 1 NTD = 3.61 Japanese Yen at April 19, 2006
Table 9 Exhaust gas emission standard (basis for on-road spot check)
Table 10 Major emission factors from dynamometer test
CO2 PM10* CO NOx HC
Emission factor
(gram per kilometer traveled) 4.99E+01 5.73E-03 7.34E+00 1.25E-01 2.02E+00
Qualified Standard Yellow Tag Qualification Blue Tag Qualification For motorcycle qualified in the third period or
early emission standard
3.5%<CO≦4.5% & 7,000ppm<HC≦9000ppm
CO≦3.5% & HC≦7,000ppm For motorcycle qualified in the fourth period
emission standard 2.5%<CO≦3.5% & 1,500ppm<HC≦2,000ppm CO≦2.5% & HC≦1,500ppm Pollutants CO2 PM10 CO NOx THC
Emission factor (gram per
kilometer traveled) 4.99E+01 5.73E-03 7.34E+00 1.25E-01 2.02E+00
LIME health damage (NTD
per gram pollutant) 6.14E-04 3.13E+00 - 5.46E-02 4.18E-02
Health damage per kilometer
traveled 3.07E-02 1.79E-02 - 6.82E-03 8.42E-02
2.3.4 Step 4: Communicate the compiled information
Once the information is compiled, an appropriate media and communication method for communication should be chosen. Our target group in this case study was general students in NCKU, and the objective of the communication was to let general students reconsider their commuting method. If we use a web page, flyers, or articles, it might limit the audience to those students who are relatively interested in receiving that message, because those media are used in a passive communication. To eliminate this bias, we chose a face-to-face interview method using the CAPI system developed in this study.
Suppose a student currently spends 7 minutes commuting by motorcycle to NCKU, including 2 minutes of walk through time. For this student, the relevant information to be communicated is presented as in Table 15.
In addition to the comparison across different commuting options, general information relevant to transportation issue was also communicated.
175 effective responses with 90.3% response rate were achieved by personal interview during May to June 2005. The effect of communication of customized and personalized information in our case study is shown in Figure 6. The percentage of motorcycle commuting students who “totally agree” or “agree” to consider adopting sustainable commuting mode increased by 28% as shown in Figure 6-a. It is observed that the information has selectively influenced motorcycle commuting students toward a more sustainable commuting mode.
Table 12 Information for a student commuting 7 minutes with motorcycle
Time Cost
Commuting time consumption increases from 7 minutes to 7.4 minutes.
Every year…
Owning and using a motorcycle will cost 6018 NTD per year.
Owning motorcycle but using a bicycle for school will cost 5649 NTD per year. If you own bicycle only, it will cost 917 NTD per year.
Environment Safety Every year…
177 NTD of external cost due to health damage will be saved.
CO2 emission could be reduced by as
much as 101 hours of air conditioning for a room.
Every year…
A Motorcycle commuter loses 1.35 days of disability-adjusted lifetime. This will be decreased by 1.07 days, down to 0.28 days, by changing to a bicycle.
Figure 6 Shift of attitudes by the communication of information in the case study 2% 5% 43% 39% 38% 31% 16% 23% 2% 2% 0% 20% 40% 60% 80% 100% after receiving customized information before receiving customized information
totally disagree disagree not sure / no comment agree totally agree 0% 5% 54% 31% 26% 20% 13% 39% 2% 10% 0% 20% 40% 60% 80% 100% after receiving customized information before receiving customized information
totally agree agree not sure / no comment disagree totally disagree
6-b Answers from bicycle commuting students for
“Will you consider changing your commuting tool to motorcycle before graduating from NCKU?” 6-a Answers from motorcycle commuting students for
“Will you consider changing your commuting tool to bicycle, walking, or other method using public transportation before graduating from NCKU?”
2.4 Discussion
The essence of the methodology presented in this paper could be two-fold. First, different types of information should be delivered at the same time, to allow more effective reconsideration of consumption habits through analyses such as cost-benefit analysis and feasibility analysis. Second, customization and personalization of information will increase its relevance and help the audience to more clearly recognize the reality, consequences, and responsibilities.
2.4.1 Psychological parameters for choosing types of information and indicators
As to the first point, the different roles of information could be discussed. When people make decisions on their actions, there are several different types of implicit and explicit motivations. The information delivered through the proposed method and strategy will influence those motivations and let subjects make choices in a more sustainable manner. Hirose28 has discussed six different psychological parameters in people’s environmental actions: 1) cognition of responsibility to the issues, 2) cognition of seriousness of the issues, 3) cognition of effectiveness of countermeasures, 4) evaluation of feasibility, 5) evaluation of personal cost and benefit, and 6) evaluation of conformity to social norms. On deciding what kind of information should be communicated in step 2, those six parameters could be used to check if there is any critical information that is lacking. For designing a survey to identify which aspects in sustainability should be communicated, the questions could be constructed using those psychological parameters. Furthermore, the choice of quantitative indicators could be done keeping in mind how they are recognized or evaluated through the six parameters.
In our case study, facts such as Taiwanese motorcycle density being top among the world, and traffic accident rates estimated as higher for motorcycle commuting students, are given to let students recognize the seriousness of the issue. Quantified information was provided to allow cost-benefit analysis and feasibility analysis. Information on the environment and health was delivered using both the public health damage in monetary terms, and time equivalent to operating air conditioning in terms of CO2 emission. The former will help in recognizing health damage in the context of responsibility to the issues and conformity to the social norms, while the latter more contributes in recognition of effectiveness of countermeasures. As a result, all six parameters were successfully covered.
For the health damage, DALYs could be chosen instead of monetarized value to allow easier comparison with the safety aspect. However, we considered that aggregation of results is not as important in this case study, because the amount of information is not too much. In addition, people might put different weights on safety risk and health damage, and using the same unit will result in implicitly forcing a certain weight on the two aspects. Therefore, in our case study, we avoid using DALYs for health damage, and used monetary expression, although the monetary term is actually calculated using contingency values of DALYs calculated by the LIME system. In addition, note that DALYs calculated for safety and health damage has a fundamental gap, because while Taiwanese life expectancy value was used in safety DALYs calculation, Japanese life expectancy value was used for health damage calculation. This is because the LIME system uses Japanese life expectancy, and no correction method is provided for life expectancy in the system (or any other similar endpoint damage characterization system). The monetary terms are used for cost, but by explicitly mentioning that the health damage result is an external cost, the difference in meaning could be exhibited clearly. Moreover, while calculating DALYs loss from traffic accidents for the target group, the injury duration was specifically according to individual accident cases gathered by survey of the target group, the injury duration of DALYs calculation in LIME system is based on aggregated statistical data. The calculation method we take is better for customization but, inevitably, not totally accordant with DALYs values derived from the approach taken by LIME system.
An important assumption in this study is that the direction we would want consumers to shift in is clear and is toward a more sustainable direction. Having this assumption, simply choosing more influential and easily understood indicators is recommended. For example, time equivalent to operation of air conditioning is easier understood than GWP (or CO2 equivalent), and highly relevant to Taiwanese people, because Taiwan is located in a tropical region and relies heavily on air conditioning (namely cooling and dehumidifying). Air conditioner use has more of high demand elasticity, that is, people have more flexibility in deciding whether to use it or not. In drier and cooler Northern countries or countries that are strongly bound to quantitative GHG emission target, such as Japan, different equivalents for indicators should be adopted. In particular, in UNFCCC Annex I countries such as Japan, efforts to meet the Kyoto targets might be more relevant or at least worth mentioning. The choice of economic terms instead of DALYs for health damage from air pollution by motorcycle use was made according to the above principle. DALYs value looked too insignificant even in daily instead of yearly terms. On the other hand, monetary terms provided more accountable values for the same damage.
2.4.2 Localization, customization and personalization
Data and models used in the case study are classified into different levels of localization and customization as shown in Table 16. From the nature of our case study that the consumption activity of focus is geographically concentrated by specifying the consumer group, a customized data set is also always localized. Meanwhile, data and models that are not customized are prepared with various levels of localization. In general cases, correlation between geographical distribution and type of consumer groups is diverse. Table 16 describes different levels of localization and customization, including a “mismatch” category. Clarifying data and models using tables similar to Table 16 would be useful, and make it possible to enhance the reusability of prepared information set for other cases.
In our case study, characterization models used for calculating health damage by exhaust gases and contingency factors are in the “mismatch” category, in terms of localization. From this table, we could find out that from the calculation of DALYs it is relatively difficult to make a reasonable customization or localization. The contingency factor used for calculating monetary value from DALYs associated with the health damage has a clear mismatch with the target of our case study, but it was not modified. There could be at least the following three methods to make modifications to the contingency factor. The first method is to make corrections according to the average income level difference between Japan and Taiwan (GDP (PPP) per capita: Japan – 30,615 USD; Taiwan 27,572 USD) (IMF, 2006). This method is straightforward and makes the error smaller, although it will still remain due to the difference in recognition of life year values. The second method is to conduct a survey to derive a correction factor for the contingency coefficient. This kind of work will be useful and even crucial, so it is highly recommended to conduct research in this direction for different areas and populations. The third method is to obtain a personalized contingency coefficient at the time of communication. With interactive communication media such as CAPI, it is possible to ask several questions to the individual, and obtain a contingency coefficient between the monetary terms and DALYs. However, this could make the communication more time-consuming and possibly make the audience be distracted from the main messages.
Research has indicated that engine type would be the dominant factor of pollution from a motorcycle. Lin (2006) pointed out that 2-stroke motorcycles emitted approximately 10 times greater HC than 4-stroke motorcycles. In Taiwan, the number of 2-stroke motorcycle has been dropping in recent years. Due to the stricter pollution regulation applied by TEPA, it is expected that the number of 2-stroke motorcycle will keep on decreasing and thus simultaneously reduce the amount of pollutants such as
CO and HC that are emitted. On the other hand, catalytic converters can not fully function and eliminate the pollution of exhaust gas before reaching optimal conversion temperature (Di Monte et al., 1998). Studies from Lenaers (1996) and TEPA (1997) revealed that short distance riding of motorcycles usually results in higher emission of pollutants, and it should be remembered that the daily commuting of students would mostly be over short distances. We would recommend keep track of the information on the proportion of motorcycle engine types to adjust the emission factor, and then adopting the adjusted emission factor which better fits the commuting style of the target group to achieve better customization.
- 32 -
Table 13 Classification
of levels of customization and loc
alization Localized to NCK U area Localized to Taiwa n Global Mismat ch Cu stomized for NCK U stud en ts All: Co m pared co mm utin g optio ns Ti m e: Av erag e tran sportatio n sp eed of th e c om m ut ing o pt io ns Ti m e: A ver ag e w al k-thro ugh sp eed fo r t he com m ut ing opt io ns
Safety, Cost: Accid
en t rates fo r com m uti ng o pt ions Cost: Repair co st afte r accide nts Not cu stomi zed CO 2 : CO 2 e m issi on by po we r con sum pt ion Health : Emissio n factor of po llu tan ts fro m m oto rcycle Co st, CO 2 : Average m ileage (km /l) of m oto rcycles
Safety: Life expectancy
for
DALYs
calculation Cost: Bicycle maintenance Co
st: Fu el fo r m oto rcycle Co st: Main ten an ce for m oto rcycle Co st: Tax fo r m oto rcycle Safety: Disab ility weig ht in DALYs
calculation Safety: Discou
nt rate in DALYs calculation Safety: Ag e wei gh ting factor (co nfi rm with Ped ro) fo r DAL Ys calculation Health : Ch aracterizatio n m od els of exha ust gases ( in LIM E sy st em ) Heal th : C ont inge ncy fact or s t o co nv ert DALYs in to m on etary term Mismat ch
2.4.3 Consideration of related consumption activities
Consumption is a system of activities that influence each other, for example by sharing resources such as time and budget. When some message is conveyed to shift a consumption behavior, attention should be paid to major side-effects to avoid adverse consequences. In our case, if a student changes their commuting tool from motorcycle to bicycle for commuting to school from their home, we could expect that they will not use a motorcycle to go out for lunch. On the other hand, it is probable that students would turn on air conditioning of classrooms more often due to the increased exercise from riding a bicycle that will make them warmer. A method to allow systematic consideration of those effects is needed.
Annual maintenance cost presented here is not only for daily commuting usage, but also for the rest of the ordinary usage. If a motorcycle is only used for daily commuting, the maintenance cost would probably be reduced, which is usually not the case if a motorcycle-owning student stops using it to come to school. The problem could be avoided if an operation cost survey based on the distance traveled on the mileage meter is conducted. However, it should be noted that a choice in commuting methods could affect life style and behavior. If a motorcycle is used instead of a bicycle, it could result in an extended field of activities, such as increased preference to go shopping or to restaurants located further away. This kind if effect increases the travel distance and maintenance cost. For this reason, general average maintenance cost was used instead of a mileage based maintenance cost.
2.4.4 Introduction of life cycle perspectives
For consumption activities in which the use of the product itself entails high environmental loads, such as transportation by motorcycle or car, considering life-cycle wide intervention on the sustainability aspects has relatively less importance. However, many other consumption activities are related to products or service that can have more interventions in production or post-consumption treatment. Therefore, in general, communication of information prepared based on life cycle perspectives will be needed. The case study in this paper does not cover most of the life cycle wide impacts of commuting choices.
Extending the scope of this study to different life-cycle stages will complicate localization and customization of information, and more research is needed to work out communication strategies for such an extended scope. To this end, future work should be directed into communication of lifestyle choices that has variety in location and uses more specific characteristics for some group of consumers.
2.5 Conclusions
In this paper, a communication strategy for sustainable consumption, and a methodological framework to identify, choose, compile, and deliver the relevant information to the consumer is presented. A case study on university students’ commuting patterns in NCKU, Taiwan, is shown to demonstrate and discuss the proposed strategy and the methodological framework. The discussion elucidates the needs to make corrections to the endpoint models, and classifies the levels of localization and customization, which will enable the methodology in the case study to be applied to communication on motorcycle transportation in other locations and with other groups, with appropriate levels of localization and customization. A method to discover related consumption activities in a systematic way is needed to avoid overlooking important side-effects. Finally, further research is needed to extend the methodologies presented to communicate life-cycle wide intervention to wider-level (regional to global) sustainability.
2.6 References
Arnesen T., Kapiriri L. Can the value choices in DALYs influence global priority-setting? Health Policy 2004; 70, 137–149
Aultman-Hall, L., Kaltenecker, M. G., Toronto bicycle commuter safety rates. Accid. Anal. Prev. 1999; 31: 675-686
Bureau of Energy, Ministry of Economic Affairs (MOEA) of Taiwan, Guidebook on vehicles oil consumption, 2004
Department of Health (DOH) of Taiwan, Main Cause of Death Statistics 2004, 2004
Directorate General of Highways, Ministry of Transportation and Communications (MOTC) of Taiwan, Regulations on fuel tax and automobile tax, http://www.thb.gov.tw/hw/look2-2.html#a3, 2006
Di Monte R., Fornasiero P., Graziani M., Kašpar J., Oxygen storage and catalytic NO removal promoted by CeO2-containing mixed oxides, J. Alloys Compd. 1998; 877–85: 275–277.
Elaine M. Murtagh, Colin A. G. Boreham, Marie H. Murphy. Speed and Exercise Intensity of Recreational Walkers. Prev. Med. 2002; 35: 397–400
Environmental Protection Administration of Taiwan (TEPA), Investigation on driving patterns and emission factors for motorcycles in Kaoshiung City, Taiwan ROC, 1997 (in Chinese)