The relationship between visfatin levels and anthropometric and metabolic parameters: association with cholesterol levels in women
Ching-Chu Chen
a,f, Tsai-Chung Li
b,g,j, Chia-Ing Li
b, Chiu-Shong Liu
c,e, Wen-Yuan Lin
c,e, Ming-Tsang Wu
d,h, Ming-May Lai
c,e, Cheng-Chieh Lin
c,i,j,⁎
aDivision of Endocrinology and Metabolism, Department of Medicine, China Medical University Hospital, Taichung 404, Taiwan
bDepartment of Medical Research, China Medical University Hospital, Taichung 404, Taiwan
cDepartment of Family Medicine, China Medical University Hospital, Taichung 404, Taiwan
dDepartment of Family Medicine and Occupational Medicine, China Medical University Hospital, Taichung 404, Taiwan
eDepartment of Family Medicine, College of Medicine, China Medical University, Taichung 404, Taiwan
fDepartment of Endocrinology and Metabolism, College of Chinese Medicine, China Medical University, Taichung 404, Taiwan
gGraduate Institute of Chinese Medicine Science, College of Chinese Medicine, China Medical University, Taichung 404, Taiwan
hGraduate Institute of Environment Health, China Medical University, Taichung 404, Taiwan
iSchool and Graduate Institute of Health Care Administration, College of Public Health, China Medical University, Taichung 404, Taiwan
jInstitute of Health Care Administration, College of Health Science, Asia University, Taichung 404, Taiwan Received 8 December 2006; accepted 30 April 2007
Abstract
Adipose tissue has recently been identified as an endocrine organ. Visfatin is a novel adipocytokine predominantly secreted from visceral adipocytes. Visceral obesity is an important component of metabolic syndrome; however, the relationship between visfatin levels and metabolic syndrome is not clear. The purpose of this study was to explore the association between visfatin levels and anthropometry and parameters of metabolic syndrome. Anthropometric measurements included height, weight, body mass index, waist and hip circumferences, waist-to-hip ratio, and blood pressure. Metabolic parameters including fasting serum visfatin, fasting serum insulin and fasting plasma glucose, lipid profiles, and uric acid levels were measured. Data of 500 subjects (244 men and 256 women) were used for the analysis. There was no significant difference in serum visfatin levels between male and female subjects. Visfatin correlated negatively with body mass index (β = −.011, P = .025) in male subjects; however, visfatin did not correlate with any other anthropometric or any metabolic parameters in male subjects. There was no correlation between visfatin levels and any anthropometric parameters in female subjects; however, it did correlate positively with high-density lipoprotein cholesterol levels (β = .126, P = .006) and correlate negatively with low-density lipoprotein cholesterol levels (β = −.039, P = .010) in female subjects. In conclusion, visfatin is not related to most anthropometric parameters and most parameters of metabolic syndrome. It may play a role in cholesterol homeostasis in women.
© 2007 Elsevier Inc. All rights reserved.
1. Introduction
It has long been apparent that obesity is an important risk factor for the development of insulin resistance and type 2 diabetes mellitus (DM)[1]. Adipose tissue is now recognized as an endocrine organ that secretes many hormones, such as leptin [2], adiponectin [3], and resistin [4]. Leptin and
adiponectin were shown to correlate with many parameters of metabolic syndrome[5-8], although studies have revealed that resistin was not associated with most parameters of metabolic syndrome[9,10].
In 2005, Fukuhara et al [11] isolated a novel adipocyto- kine named visfatin; this cytokine was identical to pre–B- cell colony-enhancing factor and was preferentially expressed in visceral fat. Its plasma level correlated strongly with the amount of visceral fat estimated by computed tomography in humans[11]. Increased body fat, especially that which is visceral in origin, is closely linked to insulin resistance [12]. Visfatin level has been reported to be
www.elsevier.com/locate/metabol
⁎ Corresponding author. Department of Family Medicine, China Medical University Hospital, Taichung 404, Taiwan. Tel.: +886 4 22062121x6077; fax: +886 4 22064888.
E-mail address:cclin@www.cmuh.org.tw(C.-C. Lin).
0026-0495/$– see front matter © 2007 Elsevier Inc. All rights reserved.
doi:10.1016/j.metabol.2007.04.018
increased in subjects with type 2 DM[13-15]and polycystic ovary syndrome [16], 2 typical manifestations of insulin resistance. Because insulin resistance is the key component of metabolic syndrome [17] and visfatin is preferentially expressed in visceral fat [11], the relationship between visfatin levels and metabolic syndrome warrants elucidation.
The aim of this study is to investigate the association between visfatin levels and anthropometry and certain parameters related to metabolic syndrome in a community- based population.
2. Materials and methods
The study participants in the current report comprised subjects who participated in our previous Metabolic Syndrome Study (unpublished data) conducted in October 2004, a community-based study designed to estimate the prevalence of metabolic syndrome among residents, aged 40 years and older, in a metropolitan city in central Taiwan. In this study, visfatin levels were measured in the first 500 participants. Informed consent was obtained from each participant, and the study was approved by the Human Research Committee of the China Medical University Hospital.
All participating subjects presented to the outpatient clinic of the Department of Family Medicine subsequent to an overnight fasting. They were weighed in light clothing; and their heights, and waist circumference and hip circumference measurements were recorded. Body mass index (BMI) was calculated (kg/m2) as an index of overall adiposity. Waist circumference was measured midway between the inferior margin of the last rib and the crest of the ileum in a horizontal plane. Hip circumference was taken around the pelvis at the point of maximal protrusion of the buttocks. Circumference was measured to the nearest 1 mm. Waist circumference and waist-to-hip ratio (WHR) served as a measure of regional fat distribution. Blood pressure was measured from the right arm subsequent to the participant sitting at rest for a period of 20 minutes. The mean of 2 blood pressure recordings was used for statistical analysis. Fasting blood samples were drawn between 8:00 AM and 10:00 AM, and the separated serum was stored at −70°C until assays for visfatin and insulin levels were conducted. The insulin resistance index from fasting serum insulin and plasma glucose levels was estimated using the homeostasis model assessment (HOMA)
= fasting serum insulin (μU/mL) × fasting plasma glucose (mmoL/L)/22.5 [18]. The greater the HOMA value, the greater the level of insulin resistance.
2.1. Laboratory analysis
Plasma glucose level was determined by a glucose oxidase method (Astra-8, Beckman, Brea, CA), and the serum insulin level was measured by a commercial enzyme- linked immunosorbent assay kit (Diagnostic Products, Los Angles, CA). The interassay coefficient of variation (CV) for
insulin was 8.7% and the intra-assay CV was 3.4%.
Serum visfatin level was assayed by a commercial visfatin C-terminal enzyme-linked immunosorbent assay kit (Phoe- nix Pharmaceuticals, Belmont, CA). The limit of detection was 4.29 ng/mL; the intra- and interassay CV were 4.4% and 12%, respectively. Plasma cholesterol and triglyceride levels were determined by an enzymatic colorimetric method (Beckman Coulter Synchron LX-20; Beckman Coulter, Brea, CA)[19,20]. The high-density lipoprotein cholesterol (HDL-C) level was measured by a direct HDL-C method;
HDL lipoprotein particles were solubilized by a detergent to release HDL-C that reacted with cholesterol esterase and cholesterol oxidase in the presence of chromogens to produce a colored product (Beckman Coulter Synchron LX-20) [19,21]. The low-density lipoprotein cholesterol (LDL-C) level was also measured by a direct LDL-C method but used 2 kinds of detergents to solubilize the LDL particles (Beckman Coulter Synchron LX-20) [19,21]. The uric acid level was determined by a uricase-peroxidase method (Beckman Coulter Synchron LX-20).
2.2. Statistical analysis
All data are presented as mean ± SD. Serum visfatin levels were logarithmically transformed to obtain a distribution resembling a normal distribution. A Student t test compared the differences in parameter values between male subjects and female subjects. The level of correlation among log visfatin, anthropometry, and various parameters pertaining to metabolic syndrome was assessed
Table 1
Clinical and metabolic characteristics of all the study subjects
Variables All (N = 500) Range
Mean ± SD Minimum-maximum
Age (y) 54.33 ± 10.51 39.89-85.17
Adiposity index
BMI (kg/m2) 24.10 ± 3.24 14.05-41.21
Waist circumference (cm) 81.12 ± 9.84 56.00-114.00 Hip circumference (cm) 95.23 ± 6.46 74.50-128.00
Waist/hip ratio 0.85 ± 0.07 0.68-1.08
Blood pressure (mm Hg)
Systolic 132.85 ± 20.34 89.00-219.00
Diastolic 78.98 ± 12.23 46.00-133.00
Glucose tolerance index
FPG (mmol/L) 5.74 ± 1.55 4.05-17.49
FSI (pmol/L) 59.23 ± 53.94 0.72-551.97
HOMA 2.2 ± 2.39 0.02-26.38
Lipid profile
Total cholesterol (mmol/L) 5.37 ± 1.02 2.84-9.52 Triglyceride (mmol/L) 1.26 ± 0.83 0.28-8.98
HDL-C (mmol/L) 1.19 ± 0.32 0.51-2.49
Total cholesterol /HDL ratio 4.78 ± 1.30 1.91-8.67
LDL-C (mmol/L) 3.39 ± 0.92 0.87-7.46
Uric acid (mmol/L) 0.33 ± 0.08 0.15-0.65 Visfatin (ng/mL) 44.08 ± 26.84 14.20-277.85
Log visfatin 1.59 ± 0.21 1.15-2.44
FPG indicates fasting plasma glucose level; FSI, fasting serum insulin level.
by Pearson correlations and partial correlation coefficient analyses. The independent effects of the metabolic para- meters upon logarithmically transformed serum visfatin levels were identified by multiple linear regression analysis.
A P value of less than .05 represented statistically significant difference between compared data sets. All analyses were performed with the SAS statistical package 8.1 (SAS Institute, Cary, NC).
3. Results
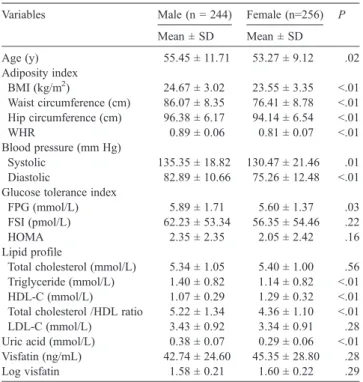
Table 1showed that the study subjects had a wide range of clinical and metabolic characteristics. Among these subjects, 121 subjects were on medications. The medica- tions were for DM (36 subjects), hypertension (87 subjects), hyperlipidemia (21 subjects), and gout (20 subjects). As shown inTable 2, male subjects had greater BMI, waist and hip circumferences, and WHR than female subjects. Male subjects exhibited higher systolic and diastolic blood pressures than female subjects. The fasting plasma glucose levels for male subjects were significantly higher than that for female subjects. There were no significant differences in fasting plasma insulin levels and HOMA between male and female subjects. Female subjects showed greater HDL-C and lower triglyceride, total cholesterol/HDL-C ratio, LDL-C, and uric acid levels than that of male subjects. There was no significant difference in serum visfatin levels between male and female subjects (visfatin, 42.74 ± 24.6 vs 45.35 ± 28.8 ng/mL, P = .28; log visfatin, 1.58 ± 0.21 vs 1.6 ± 0.22, P = .29).
Simple linear regression analysis revealed that log visfatin correlated negatively with BMI in male subjects. This
Table 2
Clinical and metabolic characteristics of the study subjects stratified by sex
Variables Male (n = 244) Female (n=256) P
Mean ± SD Mean ± SD
Age (y) 55.45 ± 11.71 53.27 ± 9.12 .02
Adiposity index
BMI (kg/m2) 24.67 ± 3.02 23.55 ± 3.35 b.01
Waist circumference (cm) 86.07 ± 8.35 76.41 ± 8.78 b.01 Hip circumference (cm) 96.38 ± 6.17 94.14 ± 6.54 b.01
WHR 0.89 ± 0.06 0.81 ± 0.07 b.01
Blood pressure (mm Hg)
Systolic 135.35 ± 18.82 130.47 ± 21.46 .01
Diastolic 82.89 ± 10.66 75.26 ± 12.48 b.01
Glucose tolerance index
FPG (mmol/L) 5.89 ± 1.71 5.60 ± 1.37 .03
FSI (pmol/L) 62.23 ± 53.34 56.35 ± 54.46 .22
HOMA 2.35 ± 2.35 2.05 ± 2.42 .16
Lipid profile
Total cholesterol (mmol/L) 5.34 ± 1.05 5.40 ± 1.00 .56 Triglyceride (mmol/L) 1.40 ± 0.82 1.14 ± 0.82 b.01
HDL-C (mmol/L) 1.07 ± 0.29 1.29 ± 0.32 b.01
Total cholesterol /HDL ratio 5.22 ± 1.34 4.36 ± 1.10 b.01
LDL-C (mmol/L) 3.43 ± 0.92 3.34 ± 0.91 .28
Uric acid (mmol/L) 0.38 ± 0.07 0.29 ± 0.06 b.01 Visfatin (ng/mL) 42.74 ± 24.60 45.35 ± 28.80 .28
Log visfatin 1.58 ± 0.21 1.60 ± 0.22 .29
Table 3
Correlation between log visfatin and anthropometric and metabolic parameters both without and with adjustment for age, waist circumference, and age and waist circumference
Adjustment for Males (n = 244) Females (n = 256)
– Age WC Age and WC – Age WC Age and WC
Age 0.060 – 0.062 – 0.092 – 0.082 –
Adiposity index
BMI −0.128 ⁎ −0.122 −0.176 ⁎⁎ −0.166 ⁎⁎ −0.019 −0.043 −0.069 −0.061
WC −0.030 −0.035 – – 0.026 −0.007 – –
HC −0.028 −0.022 −0.007 0.009 0.035 0.017 0.029 0.030
WHR −0.022 −0.036 0.001 −0.015 0.001 −0.030 −0.038 −0.039
Blood pressure
Systolic 0.008 −0.018 0.015 −0.010 0.010 −0.046 −0.004 −0.046
Diastolic −0.031 −0.037 −0.026 −0.031 −0.014 −0.058 −0.032 −0.058
Glucose tolerance
FPG 0.038 0.031 0.042 0.035 0.023 −0.014 0.006 −0.013
FSI −0.025 −0.021 −0.015 −0.008 −0.009 −0.019 −0.016 −0.017
HOMA −0.010 −0.008 0.001 0.005 −0.009 −0.024 −0.016 −0.023
Lipid profile
Total cholesterol −0.106 −0.101 −0.107 −0.102 −0.132 ⁎ −0.134 ⁎ −0.130 ⁎ −0.134 ⁎
Triglyceride 0.010 0.023 0.019 0.035 −0.098 −0.110 −0.111 −0.112
HDL-C −0.017 −0.020 −0.025 −0.029 0.170 ⁎⁎ 0.187 ⁎⁎ 0.189 ⁎⁎ 0.191 ⁎⁎
TC /HDL ratio −0.047 −0.040 −0.042 −0.033 −0.260 ⁎⁎⁎ −0.276 ⁎⁎⁎ −0.274 ⁎⁎⁎ −0.281 ⁎⁎⁎
LDL-C −0.091 −0.088 −0.091 −0.088 −0.146 ⁎ −0.151 ⁎ −0.146 ⁎ −0.151 ⁎
Uric acid −0.038 −0.035 −0.032 −0.028 −0.019 −0.043 −0.038 −0.043
WC indicates waist circumference; HC, hip circumference; TC, total cholesterol level.
⁎ P b .05.
⁎⁎ P b .01.
⁎⁎⁎ P b .001.
correlation disappeared after adjusting for age; however; it remained unchanged after adjusting for waist circumference and even after adjusting for age and waist circumference (γ =
−0.166, P b .01) (Table 3). For female subjects, log visfatin correlated negatively with total cholesterol, total cholesterol/
HDL-C ratio, and LDL-C levels; and log visfatin correlated positively with HDL-C levels. These correlations remained unchanged even after adjusting for age, waist circumference, and age and waist circumference (Table 3). Multiple linear regression analysis with log visfatin as a dependent variable showed that only BMI correlated negatively (β = −.011, P = .025) with log visfatin in male subjects, but HDL-C levels correlated positively (β = .126, P = .006) and LDL-C levels correlated negatively (β = −.039, P = .010) with log visfatin in female subjects (Table 4). The results of multiple linear regression analysis were similar after excluding subjects taking medicines for DM, hypertension, hyperlipidemia, and gout. Body mass index still correlated negatively (β = −.014, P = .031) with log visfatin in male subjects. High-density lipoprotein cholesterol levels still correlated positively (β = .175, P = .001) and LDL-C levels still correlated negatively (β = −.043, P = .011) with log visfatin in female subjects.
4. Discussion
In this study, serum visfatin levels did not appear to correlate significantly with most anthropometric markers, except BMI, and any metabolic parameters in male subjects.
It did, however, correlate with HDL-C and LDL-C levels in female subjects.
Leptin levels have been reported to be significantly higher in women than in men[22,23]; this is logical as women have more fat than men. Our study showed no sexual dimorphism
with regard to visfatin levels. This finding is consistent with a previous study [24]. A possible reason why no sex difference was found is that visfatin messenger RNA levels were also present in macrophages in addition to being secreted by adipocytes[25].
Fukuhara et al[11]identified visfatin as an adipocytokine predominantly secreted from visceral adipocytes. Computed tomographic scan demonstrated that plasma visfatin levels correlated strongly with the visceral fat area and weakly with the subcutaneous fat area in 101 male and female human subjects [11]. Because waist circumference and WHR are good surrogates of visceral fat[26,27], we would expect that visfatin levels correlate with waist circumference and WHR.
However, previous reports [28-30] and this study have not found this correlation. Furthermore, Berndt et al [28]and Hammarstedt et al [29]were unable to find an association between visfatin levels and intra-abdominal fat mass. Berndt et al [28] found that visceral visfatin expression in many subjects was several orders of magnitude lower than subcutaneous visfatin expression in their study. They doubted that the 2 women with very high visceral visfatin expression found by Fukuhara et al [11] was only a coincidence.
Although a positive correlation between visfatin levels and BMI was reported by Berndt et al [28], our study and the result reported by Jian et al [30] in a Chinese population showed a negative correlation between visfatin levels and BMI in male subjects. Pagano et al[24]also found that obese subjects had lower plasma visfatin levels than lean subjects.
The reason of this discrepancy is unclear.
In this study, visfatin levels did not correlate with systolic or diastolic blood pressure. This result also existed in patients with type 2 DM[13]. Our study showed that visfatin level was not related to insulin levels or insulin resistance.
This result was consistent with a previous study[24]. Lipid profiles are also an important component of metabolic syndrome. Simple linear regression analysis revealed that cholesterol-related profiles were associated with visfatin levels in female subjects. This association remained unchanged in multiple linear regression analysis including or excluding subjects taking medicines related to chronic metabolic diseases. As shown in previous studies, human visfatin gene is located at 7q22.3, which has been reported to be a linkage region for insulin resistance syndrome–related phenotypes [31]. Jian et al [30] reported that a single nucleotide polymorphism at 3 different loci of visfatin gene was associated with triglyceride and total cholesterol levels.
Bailey et al[32]found that the rs11977021 variant of visfatin gene was associated with total cholesterol levels and LDL- C1 levels. These reports and our study imply that visfatin may play a role in lipid homeostasis. However, the mechanism is currently unknown. Because inhibition of cholesteryl ester transfer protein increases HDL-C level and decreases LDL level[33,34], one explanation of visfatin in cholesterol homeostasis may be via inhibition of cholesteryl ester transfer protein. The sex difference of correlation between visfatin and cholesterol level may be due to estrogen
Table 4
Multiple linear regression analysis using log visfatin as a dependent variable
Variable EC (β) SE t P
Model I: male
Intercept 1.899 0.153 12.420 b.0001
Age b0.001 0.001 0.110 .910
BMI −0.011 0.005 −2.260 .025
FSI b0.001 b0.001 0.500 .620
LDL-C −0.023 0.014 −1.600 .111
Medication 0.050 0.031 1.600 .111
Model II: female
Intercept 1.390 0.150 9.290 b.0001
Age 0.003 0.002 1.830 .069
BMI 0.001 0.004 0.240 .813
FSI b0.001 b0.001 0.350 .727
TG −0.010 0.018 −0.570 .570
HDL-C 0.126 0.045 2.760 .006
LDL-C −0.039 0.015 −2.600 .010
Medication −0.023 0.037 −0.620 .535
Waist circumference was not included in the model because of the high degree of colinearity with BMI. The same reason exists between FSI and HOMA, and that among total cholesterol, total cholesterol/HDL, HDL-C, and LDL-C. EC indicates estimate coefficient; TG, triglyceride level.
effect. Estrogen may modulate visfatin to inhibit cholesteryl ester transfer protein in cholesterol homeostasis. However, whether visfatin acts by an endocrine mechanism or if it is predominantly a paracrine hormone, or even an autocrine factor, is not clear now, the physiologic effect(s) of visfatin needs further investigation. Our report provides a clue to explore the physiologic activity of this novel adipocytokine in humans.
In conclusion, visfatin did not correlate with most anthropometric parameters and most biomarkers of meta- bolic syndrome. It correlates with HDL-C and LDL-C levels in female subjects. Further studies are needed to clarify the role of visfatin in homeostasis of lipid, especially cholesterol homeostasis in female subjects.
Acknowledgments
This work was supported by a grant from the China Medical University Hospital (DMR-95-021).
We are grateful to the staff of the Department of Family Medicine for their assistance in various measurements.
References
[1] Kahn BB, Flier JS. Obesity and insulin resistance. J Clin Invest 2000;106:473-81.
[2] Zhang Y, Proenca R, Maffei M, et al. Positional cloning of the mouse obese gene and its human homologue. Nature 1994;372:425-32.
[3] Scherer PE, Williams S, Fogliano M, et al. A novel serum protein similar to C1q, produced exclusively in adipocytes. J Biol Chem 1995;270:26746-9.
[4] Steppan CM, Bailey ST, Bhat S, et al. The hormone resistin links obesity to diabetes. Nature 2001;409:307-12.
[5] Haffner SM, Mykkanen L, Rainwater DL, et al. Is leptin concentration associated with the insulin resistance syndrome in nondiabetic men?
Obes Res 1999;7:164-9.
[6] Chen CC, Li TC, Chien CM, et al. The relationship between leptin concentration and insulin resistance in Chinese type 2 diabetic patients.
Mid Taiwan J Med 2003;8:141-7.
[7] Weyer C, Funahashi T, Tanaka S, et al. Hypoadiponectinemia in obesity and type 2 diabetes: close association with insulin resistance and hyperuricemia. J Clin Endocrinol Metab 2001;86:1930-5.
[8] Yang WS, Lee WJ, Funahashi T, et al. Plasma adiponectin levels in overweight and obese Asians. Obes Res 2002;10:1104-10.
[9] Lee JH, Chan JL, Yiannakouris N, et al. Circulating resistin levels are not associated with obesity or insulin resistance in humans and are not regulated by fasting or leptin administration: cross-sectional and interventional studies in normal, insulin-resistant, and diabetic subjects. J Clin Endocrinol Metab 2003;88:4848-56.
[10] Chen CC, Li TC, Li CI, et al. Serum insulin level among healthy subjects: relationship to anthropometric and metabolic parameters.
Metabolism 2005;54:471-5.
[11] Fukuhara A, Matsuda M, Nishizawa M, et al. Visfatin: a protein secreted by visceral fat that mimics the effects of insulin. Science 2005;307:426-30.
[12] Despres JP, Moorjani S, Ferland M, et al. Adipose tissue distribution and plasma lipoprotein levels in obese women. Importance of intra- abdominal fat. Arteriosclerosis 1989;9:203-10.
[13] Chen MP, Chung FM, Chang DM, et al. Elevated plasma level of visfatin/pre–B cell colony-enhancing factor in patients with type 2 diabetes mellitus. J Clin Endocrinol Metab 2006;91:295-9.
[14] Lopez-Bermejo A, Chico-Julia B, Fernandez-Balsells M, et al. Serum visfatin increases with progressive β-cell deterioration. Diabetes 2006;55:2871-5.
[15] Dogru T, Sonmez A, Tasci I, et al. Plasma visfatin levels in patients with newly diagnosed and untreated type 2 diabetes mellitus and impaired glucose tolerance. Diabetes Res Clin Pract 2007;76:34-9.
[16] Tan BK, Chen J, Digby JE, et al. Increased visfatin mRNA and protein levels in adipose tissue and adipocytes in women with polycystic ovary syndrome: parallel increase in plasma visfatin. J Clin Endocrinol Metab 2006;91:5022-8.
[17] Alberti KGMM, Zimmet PZ, for the WHO Consultation. Definition, diagnosis and classification of diabetes mellitus and its complications.
Part 1: diagnosis and classification of diabetes mellitus. Provisional report of a WHO consultation. Diabet Med 1998;15:539-53.
[18] Matthews DR, Hosker JP, Rudenski AS, et al. Homeostasis model assessment: insulin resistance and beta-cell function from fasting plasma glucose and insulin concentrations in men. Diabetologia 1985;28:412-9.
[19] Allain CC, Poon LS, Chan CS, et al. Enzymatic determination of total serum cholesterol. Clin Chem 1974;20:470-7.
[20] Fossati P, Prencipe L. Serum triglycerides determined colorimetrically with an enzyme that produces hydrogen peroxide. Clin Chem 1982;28:2077-83.
[21] Roeschlau P, Bernt E, Gruber W. Enzymatic determination of total cholesterol in serum. Z Klin Chem Klin Biochem 1974;12:226.
[22] Chen CC, Li TC, Chang CT, et al. Lower serum leptin concentration in female subjects with type 2 diabetes mellitus. Mid Taiwan J Med 2003;8:8-12.
[23] Sheu WH, Lee WJ, Chen YT. Gender differences in relation to leptin concentration and insulin sensitivity in nondiabetic Chinese subjects.
Int J Obes 1999;23:754-9.
[24] Pagano C, Pilon C, Olivieri M, et al. Reduced plasma visfatin/pre–B cell colony-enhancing factor in obesity is not related to insulin resistance in humans. J Clin Endocrinol Metab 2006;91:3165-70.
[25] Curat CA, Wegner V, Sengenes C, et al. Macrophages in human visceral adipose tissue: increased accumulation in obesity and a source of resistin and visfatin. Diabetologia 2006;49:744-7.
[26] Pouliot MC, Despres JP, Lemieux S, et al. Waist circumference and abdominal sagittal diameter: best simple anthropometric indexes of abdominal visceral adipose tissue accumulation and related cardiovas- cular risk in men and women. Am J Cardiol 1994;73:460-8.
[27] Wajchenberg BL. Subcutaneous and visceral adipose tissue: their relation to the metabolic syndrome. Endocr Rev 2000;21:697-738.
[28] Berndt J, Kloting N, Kralisch S, et al. Plasma visfatin concentrations and fat depot-specific mRNA expression in humans. Diabetes 2005;54:2911-6.
[29] Hammarstedt A, Pihlajamaki J, Rotter Sopasakis V, et al. Visfatin is an adipokine but it is not regulated by thiazolidinediones. J Clin Endocrinol Metab 2006;91:1181-4.
[30] Jian WX, Luo TH, Gu YY, et al. The visfatin gene is associated with glucose and lipid metabolism in a Chinese population. Diabet Med 2006;23:967-73.
[31] Arya R, Blangero J, Williams K, et al. Factors of insulin resistance syndrome-related phenotypes are linked to genetic locations on chromosomes 6 and 7 in nondiabetic Mexican-Americans. Diabetes 2002;51:841-7.
[32] Bailey SD, Loredo-Osti JC, Lepage P, et al. Common polymorphisms in the promoter of the visfatin gene (PBEF1) influence plasma insulin levels in a French-Canadian population. Diabetes 2006;55:2896-902.
[33] Brousseau ME, Schaefer EJ, Wolfe ML, et al. Effects of an inhibitor of cholesteryl ester transfer protein on HDL cholesterol. N Engl J Med 2004;350:1505-15.
[34] Davidson MH, Mckenney JM, Chear CL, et al. Efficacy and safety of torcetrapib, a novel cholesteryl ester transfer protein inhibitor, in individuals with below-average high-density lipoprotein cholesterol levels. J Am Coll Cardiol 2006;48:1774-81.