行政院國家科學委員會專題研究計畫 期中進度報告
雙金屬奈米粒子之大小、結構及原子分佈對其電子結構及電 化學性質之影響(1/3)
計畫類別: 個別型計畫
計畫編號: NSC94-2214-E-011-010-
執行期間: 94 年 08 月 01 日至 95 年 07 月 31 日 執行單位: 國立臺灣科技大學化學工程系
計畫主持人: 黃炳照
報告類型: 精簡報告
報告附件: 出席國際會議研究心得報告及發表論文 處理方式: 本計畫可公開查詢
中 華 民 國 95 年 6 月 1 日
行政院國家科學委員會補助專題研究計畫期中進度報告 雙金屬奈米粒子之大小、結構及原子分佈對其電子結
構及電化學性質之影響(1/3)
Effect of Size, Structure and Atomic Distribution of Bimetallic Nano- sized Particles on Their Electronic Structures and Electrochemical Properties
(1/3)
計 畫 類 別 :
□
個 別 型 計 畫 □ 整 合 型 計 畫 計畫編號:NSC 94-2214-E-011-010-執行期間: 94 年 8 月 1 日至 95 年 7 月 31 日 計畫主持人:黃炳照 博士
共同主持人:
計畫參與人員:陳景翔、王國榮、張人文、顏世杰
成果報告類型(依經費核定清單規定繳交):□精簡報告 □完整報告
本成果報告包括以下應繳交之附件:
□赴國外出差或研習心得報告一份
□赴大陸地區出差或研習心得報告一份
█出席國際學術會議心得報告及發表之論文各一份
□國際合作研究計畫國外研究報告書一份
處理方式:除產學合作研究計畫、提升產業技術及人才培育研究計畫、列 管計畫及下列情形者外,得立即公開查詢
□涉及專利或其他智慧財產權,□一年□二年後可公開查詢 執行單位:國立台灣科技大學 化學工程系
中 華 民 國 95 年 05 月 31 日
2 中文摘要
本計畫之研究目的在於探討雙金屬奈米粒 子之成長機制,藉此控制合成奈米粒子之大 小、結構與原子分佈,進而研究奈米粒子之大 小、結構與原子分佈對其電子結構及電化學性 質之影響。本計畫將以三年的時間完成下列目 標:(一)探討雙金屬奈米粒子之成長機制,
並建立可控制奈米粒子之大小、結構與原子分 佈之合成技術;(二)建立量測控制合成之雙 金屬奈米粒子之大小、結構與原子分佈,探討 雙金屬奈米粒子之大小、結構或原子分佈對其 電子結構之影響,以深入瞭解其間之關連性;
(三)量測控制合成之雙金屬奈米粒子之電化 學性質,探討奈米粒子之大小、結構或原子分 佈對電化學性質之影響,並綜合探討雙金屬奈 米粒子之大小、結構或原子分佈與其電子結構 及電化學性質之關連性。
在第一年之計畫中,以 X 光吸收光譜分析 技術探討其雙金屬觸媒之生成機制研究,其主 要為 Pd-Pt 雙金屬觸媒在 AOT 微乳化系統下之 生成機制探討,其主要是利用 X 光吸收光譜技 術研究 Pd-Pt 雙金屬奈米粒子在水/AOT/庚烷 之油中水滴型微乳化系統下之前階段生成機制 情形。分析結果發現,Pd 與 Pt 離子之還原程 序與其所生成之奈米粒子呈現與聯氨還原劑之 劑量有一定之相依性。經由 Pd 與 Pt 之邊緣結 構解析後,其結構呈現核點為 Pd 原子,但核 層為 Pd-Pt 雙原子混合分佈,而殼層則是為富 Pt 原子但出現聚集之狀態。因此合成金屬型 態之奈米粒子技術中,其金屬離子與金屬離子 之間之反應機制與奈米金屬與金屬離子之間之 反應機制具之瞭解極具重要性。明智而審慎的 控制奈米粒子間之交互作用參數,便可有效的 設計出理想的奈米粒子結構。
關鍵字:雙金屬奈米粒子、微乳化系統、X 光 吸收光譜
Abstract
The main objective of this three year project is aimed to study the formation mechanism of metallic nanoparticles, control of particle size, structure and atomic distribution to attain the
structure-controlled nano particles and to investigate the impact of the studied properties on the electronic structures and electrochemical properties of the nanoparticles. In the first year, studies will be focused on the investigation of formation mechanism of nanoparticles by using techniques such as in-situ XAS. A structure- controlled synthesis technique will be developed.
The second year research work deals with the particle size of the nanoparticles evaluated and the structure and atomic distributions of the naoparticles determined. The evaluation of elelctronic structure and electron transfer of the synthesized structure-controlled nanoparticles will be carried out and their relationship with the size, structure and atomic distribution of the nanoparticles will be established. In the third year, studies will be targeted to estimate the electrochemical properties of the synthesized structure controlled nanoparticles by utilizing the electrochemical analysis technologies. The electrocatalytic behavior of nanoparticles towards small organic molecules can be studied.
Bimetallic nanoparticles can improve catalytic property due to the ensemble with ligand effects in catalysis. Consequently, it is notable that the understanding of formation mechanism of nanoparticles is essential for the successful nanoparticle design and scaling up process. In the first year of this project, the Pd–Pt in AOT reverse micelles has been explored by the X-ray absorption spectroscopy based methods to understand the formation mechanism of bimetallic nanoparticles system. The formation mechanism of Pd–Pt bimetallic clusters at the early stage within water-in-oil microemulsion system of water/AOT/n-heptane is investigated by in situ XAS. The reduction of Pd and Pt ions and the formation of corresponding clusters are monitored as a function of dosage of reducing agent, hydrazine. Analysis of both the Pd K-edge and Pt LIII-edge reveal that the Pt atoms are partially segregated and rich in the shell region and the Pd–Pt alloy atoms are preferentially located in the core region and the Pd acts as nuclei to form the bimetallic Pd–Pt clusters in reverse micelles. Therefore, these studies such as the reaction between metal ions and metal ions, nanoclusters and metal ions and their interactions are of great importance during the synthesis of metal-based nano-engineered clusters. Judicious control of the nanoparticles interaction
3 parameters allows for control over the assembly
of nanoparticles.
Keywords: Bimetallic nanoparticle, Microemulsion, X-ray absorption spectroscopy
ㄧ、前言
在奈米材料之研究中,奈米粒子之製備扮 演著相當重要之角色,它是構成奈米結構材料 及其他延伸應用之基礎,廣泛的吸引研究者之 興趣,並成功的製備出不同材質之奈米粒子。
奈米結構是當前奈米材料領域衍生出來含有豐 富的科學內涵的一個重要分支,由於其奇特之 物理化學現象與量子結構之聯繫,由於奈米材 料涉及許多未知過程和新奇之現象,很難用傳 統之物理與化學理論來解釋,尤其是當晶體尺 寸小到某一程度之後,其晶體之物理與表面化 學顯現出不同於塊材之特殊現象,為奈米材料 技術之提升帶來了新的機會與開發之空間。因 此,關於奈米材料之物理化學特性與電化學特 性之研究勢將把奈米科學之領域推向一個新層 次。
奈米材料之物理化學性質及其表面特性 與奈米粒子之製備方式有著非常密切的關係,
利用不同之製備方式合成相同成分及粒徑的奈 米粒子,也常因為其奈米粒子內部原子分佈及 表面組成之不同而有不同之物理化學性質,進 而影響其電化學催化之特性。因此,奈米材料 所具有之奈米結構、粒子內部原子分佈、表面 組成、物理化學特性及電化學催化特性實有著 密不可分之關係,如何釐清並建立其中之關連
性,對於研發出功能性奈米材料以及提升現階 段奈米技術之應用,實有刻不容緩之需要。
在奈米粒子合成中,其成長機制格外重 要,若能了解粒子之生成機制,便可依其需求 控制合成所需大小、結構與原子分佈之奈米粒
子。本計畫在此年度選用 AOT 微乳化系統製
備 Pd-Pt 雙金屬奈米粒子,其主要是利用 X 光 吸收光譜技術研究 Pd-Pt 雙金屬奈米粒子在水 /AOT/庚烷之油中水滴型微乳化系統下,其前 階段還原雙金屬觸媒過程中之配位基團之變化 與其化氧化還原狀態生成機制情形,以期能控 制合成雙金屬奈米粒子之大小、結構及原子分 佈。
二、實驗目的
本計畫之研究目的在於探討雙金屬奈米粒 子之成長機制,藉此控制合成奈米粒子之大 小、結構與原子分佈,進而研究奈米粒子之大 小、結構與原子分佈對其電子結構及電化學性 質之影響。計畫中將以三年的時間完成下列目 標:
第一年:
結合臨場同步輻射 X 光吸收光譜與繞射
光譜技術探討雙金屬奈米粒子之成長機制,並 建立可控制奈米粒子之大小、結構與原子分佈 之合成技術。
第二年:
4
擬以同步輻射 X 光吸收光譜以及程溫脫
附(TPD),藉由程溫表面反應(TPSR),來分析 雙金屬奈米粒子之組成,建立量測控制合成之 雙金屬奈米粒子之大小、結構與原子分佈,探 討雙金屬奈米粒子之大小、結構或原子分佈對 其電子結構之影響,以深入瞭解其間之關連 性。
第三年:
擬 以 循 環 伏 安 法 (CV )、極化曲線法 (Polarization Curve) 、 定 電 位 電 流 響 應 法 (Chronoamperametry responses )、一氧化碳去 除 法 (CO Stripping) 及 交 流 阻 抗 分 析 法 (AC Impedance)量測控制合成之雙金屬奈米粒子 之電化學性質,探討奈米粒子之大小、結構或 原子分佈對電化學性質之影響,並綜合探討雙 金屬奈米粒子之大小、結構或原子分佈與其電 子結構及電化學性質之關連性。建立上述各項 之關連性,可作為未來發展雙金屬電極觸媒之 參考。
三、實驗方法
AOT 微乳化系統製備 Pd-Pt 雙金屬觸媒步驟
(一)分別配置K2PdCl4與 H2PtCl6溶液。
(二)分別將所製備之溶液配製成水/AOT/庚 烷之油中水滴型微乳化系統,其中水與 界面活性劑之比例控制在 5.5。
(三)逐步地將聯氨還原劑加入 Pd 離子之微 乳化系統,使之還原成 Pd 奈米粒子。
(四)將配製好之 Pt 離子之微乳化系統加入
步驟(三),並逐步地將加入聯氨還原 劑,使之形成 Pd-Pt 雙金屬觸媒 進行以上各步驟之同時,藉由臨場同步輻射光 吸收光譜探測其局部結構變化情形。
四、結果於討論
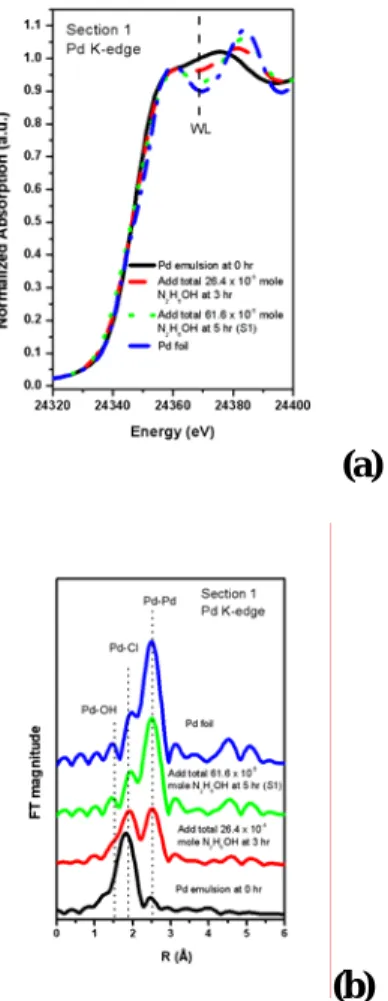
Fig.1(a)與(b)分別為 Pd 之同步輻射 X 光 吸收光譜之近邊緣結構圖與傅立葉轉換圖,圖 上可明顯的看出,Pd 邊緣之白線強度隨著還 原劑劑量增加而下降,而傅立葉轉換圖中之 Pd-Cl 鍵結之強度隨著還原劑劑量增加而下 降,且逐漸生成 Pd-Pd 之鍵結,意味著 Pd2+逐 漸被還原形成 Pd0之狀態。經由 FEFFIT 軟體 分析結果發現,其所生成之 Pd 奈米粒子之 Pd-Pd 配位數為 8.2,因此奈米粒子之粒子大 小約為 1.5nm【1】。依據所消耗之還原劑劑 量可推測出所進行之反應途徑如下式所示:
N2H5OH + PdCl42−+2H+→ N2+H2+2Pd0+ 4HCl+H2O (eq1)
5 (a)
(b)
Figure 1. (a) XANES spectra and (b) FT of k2- weighted EXFAS data at the Pd K-edge of the Pd microemulsion system as a function of hydrazine dosage.
Table 1. Structural Parameters Derived from the Pd K-edge EXAFS Data Analysis of the Pd Microemulsion System with Various Contents of Reducing Agent.
- 5 3 0 Time (hr)
0.00433 2.51 (0.29) 6.4 (0.6)
2.748 (0.004) 12.00 (0.50) Pd–Pd Pd foil
0.00293
−5.01 (0.28) 5.4 (0.5) 2.733 (0.003) 8.20 (0.32) Pd–Pd 61.6×10⁻⁵(S1)
0.00009 0.13 (0.11)
−2.11 (0.08) 3.5 (0.1) 4.7 (0.1) 2.304 (0.001) 2.739 (0.001) 1.89 (0.02) 4.14 (0.04) Pd–Cl Pd–Pd 26.4×10⁻⁵
0.00041 2.13 (0.40) 3.1 (0.3) 2.316 (0.003) 3.86 (0.13) Pd–Cl 0
R factor ΔE0(eV) σj(Å2) × 10−3
Rj(Å) N Shell Amount of N2H5OH
(mole)
N:Coordination Number, R (Å):Bonding Distance, σ2(Å2):Debye-Waller Factor, ΔE0(eV):Inner Potential Shift
Fig.2 (a)與(b)分別為Pd與Pt之近吸收邊緣結 構圖,其結果發現,將Pt離子微乳化溶液加入 Pd 奈米 粒 子 中 ,此 時Pd 邊 緣 之 白 線強 度 上 升,意味著Pd奈米粒子溶解而形成Pd離子。
逐步加入聯氨還原劑之後,Pd邊緣之白線位 置先往低能量之位置偏移,而後逐漸降低其強 度。對於Pt之邊緣結構而言,其白線強則是隨 著還原劑劑量之增加而下降。從傅立葉轉換圖 中發現,當加入Pt離子微乳化溶液加入Pd奈米 粒子時,Pd-Pd鍵結強度下降許多,而Pd-Cl鍵 結之強度上升。經參數適配後如Table2所示,
結果發現,Pd-Pd之配位數為0.9,其表示有Pd0
之核點存在於此系統中。此外Pt之傅立葉轉換 經參數適配後發現,微乳化系統中之Pt-Cl配 位數為4.1。若Pt在系統中為Pt4+之狀態,其 Pt-Cl配位數為6.0,若為Pt2+之狀態時,其Pt- Cl配位數為4.0【2】。因此當加入Pt離子微乳 化溶液加入Pd奈米粒子時大部分之Pd溶解生 成Pd-Cl鍵結,而Pt則從Pt4+還原成Pt2+進行電 荷補償。從Pd與Pt兩邊緣之傅立葉轉換圖中亦 可發現,在還原之過程中,Pd-Cl與Pt-Cl皆進 行離子交換而生成Pd-OH與Pt-OH鍵結,而後生 成Pd/Pt 雙金屬奈米 粒子。 其 反應式 如 下所 示:
N2H5OH + [Pd(OH)4]2− + [Pt(OH)4]2− + 4H +
→Pd0/Pt0+N2+6H2+3H2O (eq2)
6 (a)
(b)
Figure 2. Normalized XANES spectra near the (a) Pd K-edge (b) Pt LIII-edge of the Pd/Pt bimetallic microemulsion system.
(a)
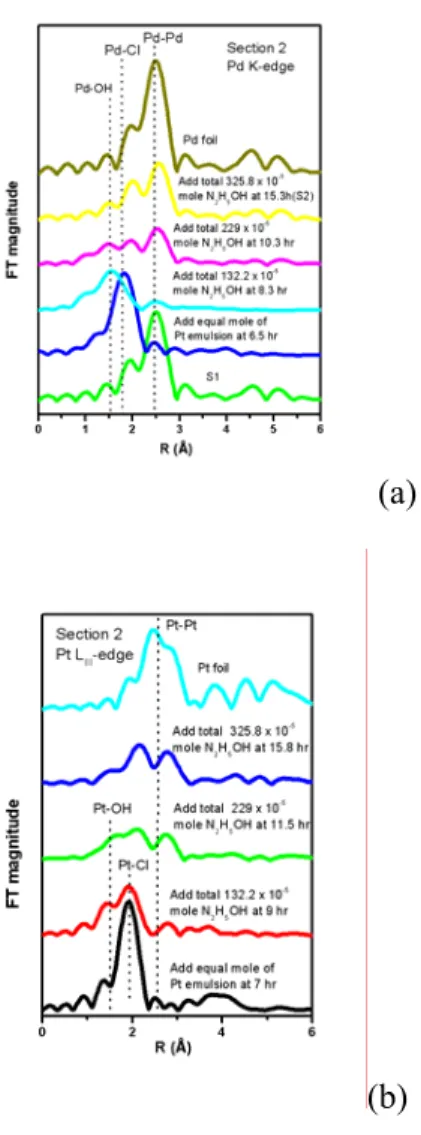
(b)
Figure 3. FT-EXAFS spectra at (a) Pd K-edge (b) Pt LIII-edge of the bimetallic Pd/Pt microemulsion system as a function reducing agent dosage.
Table2與Table3分別為不同反應狀態之 Pd與Pt兩邊緣之傅立葉轉換經適配後之物理參 數表,本研究團隊進一步的依據不同之配位 數,逐步的繪出其整體雙金屬奈米粒子之生成 機制,如 SCAEME1所示。依據總配位數之結果 發現,其Pd吸收邊緣之NPd-Pd+NPd-Pt=9.66,而Pt 先收邊緣之NPt-Pd+NPt-Pt=9.69,因此所得之平均
7 配位數為9.675,所以相對應之奈米粒子大小
約為2.5nm。
Table 2. Structural Parameters Derived from the Pd K-edge EXAFS Data Analysis of the Pd/Pt Bimetallic Clusters System with Various Contents of Reducing Agent.
- 15.3 10.3 8.3 6.5 5 Time
(hr)
0.00433 2.51 (0.29) 6.4 (0.6)
2.748 (0.004) 12.00 (0.50) Pd–Pd Pd foil
0.00526
−3.56 (0.52)
−4.00 (1.21) 4.8 (0.4)
7.8 (1.2) 2.747 (0.003)
2.750 (0.010) 5.24 (0.28)
4.42 (0.61) Pd–Pd Pd–Pt 325.8×10⁻⁵
(S2)
0.00118 1.06 (0.31)
−5.69 (0.24)
6.34 (1.03) 9.5 (0.7)
3.3 (0.4) 0.0 (1.2) 2.068 (0.003)
2.744 (0.003) 2.811 (0.010) 2.31 (0.08)
2.88 (0.11) 1.01 (0.12) Pd–OH
Pd–Pd Pd–Pt 229×10-5
0.03147 2.09 (1.13)
18.01 (5.09) 4.9 (1.3)
6.5 (0.4) 2.058 (0.008)
2.821 (0.037) 3.51 (0.32)
0.90 (0.61) Pd–OH Pd–Pd 132.2×10⁻⁵
0.00171 2.26 (0.26) 16.87 (3.11) 2.3 (0.4)
5.6 (0.6) 2.303 (0.002)
2.825 (0.030) 3.89 (0.08)
0.90 (0.51) Pd–Cl Pd–Pd Add equal mole of
Pt emulsion
0.00293
−5.01 (0.28) 5.4 (0.5) 2.733 (0.003) 8.20 (0.32) Pd–Pd S1
R factor ΔE0(eV) σj(Å2) × 10−3
Rj(Å) N Shell Amount of N2H5OH
(mole)
N:Coordination Number, R (Å):Bonding Distance, σ2(Å2):Debye-Waller Factor, ΔE0(eV):Inner Potential Shift
Table 6.3. Structural Parameters Derived from the Pt LIII-edge EXAFS Data Analysis of the Pd/Pt Bimetallic Clusters System with Various Contents of Reducing Agent.
- 15.8 11.5 9 7 Time (hr)
0.00499 -5.73 (1.35) 9.03 (0.57) 1.6 (0.9) 4.2 (0.4) 1.914 (0.007) 2.317 (0.003) 1.17 (0.11) 2.17 (0.09) Pt-OH Pt-Cl 132.2×10⁻⁵
0.01384 -11.69 (1.71)
0.24 (1.36) -2.29 (0.63) 4.3 (1.3) 8.8 (1.5) 7.3 (0.5) 1.914 (0.011) 2.671 (0.011) 2.672 (0.004) 0.88 (0.14) 1.99 (0.29) 6.64 (0.38) Pt-OH Pt-Pd Pt-Pt 229×10-5
0.00394 6.48 (0.27) 4.8 (0.2) 2.778 (0.007) 12.00 (0.29) Pt–Pt Pt foil
0.02235 2.96 (1.21) 3.74 (0.89) 6.3 (0.8) 7.3 (0.8) 2.748 (0.007) 2.758 (0.006) 2.91 (0.32) 6.78 (0.58) Pt–Pd Pt–Pt 325.8×10⁻⁵
(S2)
0.00641 9.15 (0.50) 2.2 (0.4) 2.317 (0.007) 4.10 (0.17) Pt–Cl Add equal mole of
Pt emulsion
R factor ΔE0(eV) σj(Å2) × 10−3
Rj(Å) N Shell Amount of N2H5OH
(mole)
N:Coordination Number, R (Å):Bonding Distance, σ2(Å2):Debye-Waller Factor, ΔE0(eV):Inner Potential Shift
SCAEME 1. Model Proposed for the Formation Mechanism of Bimetallic Pd–Pt Clusters at Early Stages.
由 Pd 與 Pt 兩邊緣之吸收係數得知,其 Pd:Pt 之原子比例為 1.2:1。從 Pd 吸收邊緣之 NPd-Pd+NPd-Pt=9.66 , Pt 先 收 邊 緣 之 NPt-Pd+NPt- Pt=9.69 結果可知,Pd 與 Pt 兩金屬呈現合金分 散之情形其較多的 Pt 原子存在於核區,,而 核點為 Pd 原子。本研究團隊依據過去 X 光吸 收研究中所建立之方法進一步的討論其 Pd/Pt 原子分佈與合金程度【3】。首先定義出兩個 主要之原子結構參數,JPd與 JPt。
%
×100
=
random observed
Pd p
J
P%
×100
=
random observed
Pt R
J
R依 據 適 配 出 之 結 構 參 數 可 計 算 出 其 JPd=101.1%,而 JPt=55%,此說 明了 Pd 在此
8 Pd/Pt 雙金屬結構中具有較高之分散性。因此
整體 Pd/Pt 雙金屬觸媒之結構模型為,核點為 Pd 原子,但核層為 Pd-Pt 雙原子混合分佈,
而殼層則是為富 Pt 原子但出現聚集之狀態。
本研究成功的利用臨場同步輻射 X 光吸收 光譜建構出 Pd/Pt 雙金屬奈米粒子在 AOT 微乳 化系統中之生成機制,此相關之研究以發表於 2005 年之 J. Phys. Chem. B 期刊中。此外還 有 以 修 飾 Watanabe 之 膠 體 還 原 製 備 Pt- Ru/C,以及自身氧化還原金屬至換程序製備 Ag-Pd 雙金屬奈米粒子之生成機制皆發表於 2006 年之 J. Phys. Chem. B 期刊中。
五、總結
(一)本研究成功的利用臨場同步輻射 X 光吸 收光譜建構出 Pd/Pt 雙金屬奈米粒子在 AOT 微 乳化系統中之生成機制,其相關之研究以發表 於 2005 年之 J. Phys. Chem. B 期刊中。
(二)所製備之 Pd/Pt 雙金屬奈米粒子結構模 型為核點為 Pd 原子,但核層為 Pd-Pt 雙原子 混合分佈,而殼層則是為富 Pt 原子但出現聚 集之狀態。
(三)X 光吸收光譜分析技術可有效的探測其 合成金屬型態之奈米粒子時,金屬離子與金屬 離子之間之反應機制,以及奈米金屬與金屬離 子之間之反應機制。為有效的設計出理想的奈 米粒子結構,瞭解與控制奈米粒子間之交互作 用參數極具重要性。
六、成果自評
(一)本研究所完成之成果項目與第一年計劃 內容相符,執行之效率達百分之百。
(二)本研究在本年度已有二篇相關之生成機 制發表於 J. Phys. Chem. B 期刊中,其分別 為微乳化法之 Pd/Pt 及自身氧化還原金屬至換 程序之 Ag-Pd 等雙金屬奈米粒子生成機制。
(三)本研究室研究團隊正積極建立微乳化法 合成各種不同奈米粒子,並結合同步輻射技術 來鑑定各種原子之堆疊情形,並以適度的方式 來控制奈米粒子之排列,以建立出原子排列情 形與催化特性之關係。
(四)藉此研究提昇國內奈米粒子之生產技 術,增進國內技術之自主性。並藉由同步輻射 光源之應用以提昇奈米科技研究在國際學術之 地。
七、參考文獻
1. Frenkel, A. I.; Hill, C. W.; Nuzzo, R. G. J.
Phys. Chem. B 2001, 105, 12689.
2. Tsai, W. Y.; Tseng, Y. L.; Sarma, L. S.; Liu, D.
G.; Lee, J. F.; Hwang, B. J. J. Phys. Chem. B 2004, 108, 8148.
3. Hwang, B.-J.; Sarma, L. S.; Chen, J.-M.; Chen, C.-H.; Shih, S.-C.; Wang, G.-R.; Liu, D.-G.; Lee, J.-F.; Tang, M.-T. J. Am. Chem. Soc. 2005, 127, 11140.
9
出席「美國化學會第 231 次國際研討會」報告書
台灣科技大學化工系 黃炳照
一、參加會議經過及心得
本次會議為美國化學會第 231 次國際研討會(231st ACS National Meeting)。本屆會議在美國亞 特蘭大市(Atlanta, GA)舉行,會期為 3 月 26 日至 3 月 30 日,共五天。此次會議議程安排十分緊
湊,有難以數計之 session 同時進行,無數的的邀請演講、報和論文及壁報論文發表,大會舉辦
十分成功。本人於Nanoparticles in Energy Processes: Friend and Foe: Nanoparticle-based Catalysts and Sorbents-Fuel Cells and Batteries 的 session 發表論文,本人論文被安排在 3 月 30 日星期四早 上 9:45 發 表 (Probing the formation mechanism and chemical states of carbon supported Pt_Ru nanoparticles by in-situ X-ray absorption spectroscopy),由於內容提供如何由形成機構之研究,進 而控制奈米材料之原子分佈,內容極具創新性,因此雖然是最後一天之議程,但當場卻引起熱 烈之迴響,此論文亦已發表於 J. Phys. Chem. B 2006, 110, 6475,如附件(一)。奈米結構材料乃是 大會之主軸,內容充實,討論熱烈。此次會議,除了本人外,參加此次會議之國內學者及專家 較少,有清華大學化學系葉君棣教授。
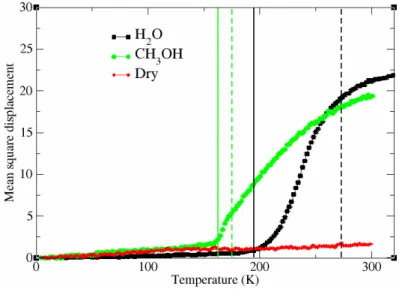
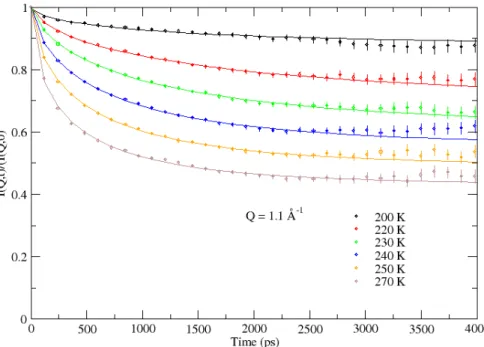
除了參加美國化學會第 231 次國際研討會,本人亦前往美國 National Institute of Standard and Technology (NIST)進行本研究室合成之玻璃質子膜之中子散射實驗(3 月 31 日~4 月 4 日),其初步結果如附件(二)。
二、攜回資料名稱與內容
出席本屆會議攜回註冊時分發的大會手冊一本與大會論文摘要光碟一片。
10 附件(一) (發表論文)
Probing the Formation Mechanism and Chemical States of Carbon-supported Pt–Ru nanoparticles by in Situ X- ray Absorption Spectroscopy
Bing-Joe Hwang,∗, †,‡ Ching-Hsiang Chen,† Loka Subramanyam Sarma,† Jiun-Ming Chen,† Guo-Rung Wang,† Mau-Tsu Tang,‡ Din-Goa Liu,‡ and Jyh-Fu Lee‡
†Nanoelectrochemistry Laboratory, Department of Chemical Engineering, National Taiwan University of Science and Technology, Taipei 106, Taiwan, Republic of China
CORRESPONDING AUTHOR EMAIL ADDRESS: [email protected]
RECEIVED DATE (to be automatically inserted after your manuscript is accepted if required according to the journal that you are submitting your paper to)
TITLE RUNNING HEAD: Formation of carbon-supported Pt–Ru bimetallic nanoparticles: in Situ XAS investigation
ABSTRACT. The understanding of formation mechanism of nanoparticles is essential for the successful particle design and scaling-up process. This paper reports findings of an X-ray absorption spectroscopy (XAS) investigation, comprising of X-ray absorption near-edge structure (XANES) and extended X-ray absorption fine structure (EXAFS) regions, to understand the mechanism of carbon- supported Pt–Ru nanoparticles (NPs) formation process. We have utilized Watanabe’s colloidal reduction method to synthesize Pt–Ru/C NPs. We slightly modified the Watanabe method by introducing a mixing and heat treatment step of Pt and Ru oxidic species at 100 0C for 8 hrs with a view
∗ Corresponding author (Bing Joe Hwang). Fax: +886-2-27376644. E-mail: [email protected]
†National Taiwan University of Science & Technology.
‡National Synchrotron Radiation Research Center, Hsinchu 300, Taiwan.
11 to enhance the mixing efficiency of the precursor species thereby one can achieve improved homogeneity and atomic distribution in the resultant Pt–Ru/C NPs. During the reduction process, in Situ XAS measurements allowed us to follow the evolution of Pt and Ru environments and their chemical states. The Pt LIII-edge XAS indicates that when H2PtCl6 is treated with NaHSO3, the platinum compound is found to be reduced to a Pt(II) form corresponding to the anionic complex [Pt(SO3)4]6−. Further oxidation of this anionic complex with hydrogen peroxide forms dispersed [Pt(OH)6]2− species.
Analysis of Ru K-edge XAS results confirms the reduction of RuIIICl3 to [RuII(OH)4]2− species upon addition of NaHSO3. Addition of hydrogen peroxide to [RuII(OH)4]2− causes dehydrogenation and forms RuOx species. Mixing of [Pt(OH)6]2− and RuOx species and heat treatment at 100 0C for 8 hrs produced a colloidal sol containing both Pt and Ru metallic as well as ionic contributions. After the reduction of this colloidal mixture at 300 0C in hydrogen atmosphere for 2 hours forms Pt–Ru nanoparticles as indicated by the presence of Pt and Ru atoms in the first coordination shell. Determination of the alloying extent or atomic distribution of Pt and Ru atoms in the resulted Pt–Ru/C NPs reveals that the alloying extent of Ru (JRu) is greater than that of the alloying extent of Pt (JPt). The XAS results support the Pt-rich core and Ru-rich shell structure with a considerable amount of segregation in Pt region and with a less segregation in Ru region for the obtained Pt–Ru/C NPs.
1. Introduction
Nanometer-sized carbon-supported and unsupported Pt–Ru nanoparticles have received great scientific interest in academic and industrial research due to their superior activity as anode catalysts for methanol electro-oxidation and CO tolerance oxidation related to fuel cell applications.1 The current interest in the use of Pt–Ru nanoparticles is largely due to the enhanced activity and selectivity that may be achieved by two metals working synergistically as explained by the so-called bifunctional mechanism. According to this bifunctional mechanism adsorbed CO species are oxidized by OH species generated on Ru surface atoms2 or by electronic effects3 where the presence of ruthenium involves a change in the electronic density of state of platinum leading to the weakening of the CO–Pt bond, or a mixing of both effects as was recently shown by Waszczuk et al.4 A true synergetic effect between the
12 two metals is shown only if they are in strong interaction e. g. in contact with each other, allowing higher CO mobility from platinum towards ruthenium. It is clear that the catalytic performance is strongly dependent on the distribution of Pt and Ru sites at the atomic level and believed to be sensitive to the particles shape and size and to the nature of the support.
Various methods are used for the preparation of Pt–Ru bimetallic NPs, such as (1) the colloidal chemistry methods,5 (2) the reverse micelles method,6 (3) the microwave irradiation method,7 (4) the alcohol-reduction method,8 and (5) the deposition of an organometallic PtRu5C(CO)16 cluster on to a carbon black followed by the decomposition at a high-temperature treatment.9 Of the several methods considered, the preparation of the catalyst via the formation of a sulfite complex, followed by a thermal treatment at 280 0C in a reducing atmosphere gave better results,10 comparable to those obtained with the state-of-the-art Pt–Ru/C catalysts. However, from the experience of formation mechanism studies on mono and bimetallic nanoparticles by XAS11 we believe that the change in the ligand environment around metal ions and mixing of metal ion precursors will affect the reducibility of metal ions. Here we attempted to enhance the homogeneity and atomic distribution of metals in the nanoparticle by improving the mixing efficiency of metal ion precursors prior to reduction step and modified the Watanabe colloidal reduction method accordingly. Even though a wealth of information is available on the synthesis of Pt–Ru bimetallic NPs studies focusing on understanding the relationships that exist between composition, size and ultimately the structure adopted are limited. Nuzzo et al give detailed information about the structural aspects of the Pt–Ru bimetallic NPs and pointed-out that more in-depth study on the above features are beneficial to gain new insights that could lead to the useful catalytic activities of metallic NPs.12 Recently based on XAS methodology, we have shown that the alloying extent or atomic distribution in nanoparticles is another important factor of concern which have strong influence on their catalytic activities.13 Thus studies focusing on controlling the size, morphology and homogeneity of the bimetallic NPs14 receives great importance in current nanoscience research and to achieve this thorough understanding of metal nanoparticle formation mechanism is necessary.11 Also success in either particle design or scaling-up requires a detailed knowledge of the particle formation mechanism. A full understanding of the particle formation mechanism during the preparation process,
13 especially in terms of the chemical environment around the metal ions to be reduced and nature of the ligands formed during the course of nanoparticle formation will greatly benefit the development of needed structure-controllable synthetic pathways for metal nanoparticles.
For metal nanoparticles X-ray absorption spectroscopy (XAS) is proved to be one of the most suitable methods for investigating structural evolution and in many cases structural properties of metal particles can be probed in situ during the different steps of preparation. Other techniques such as X-ray diffraction (XRD) and transmission electron microscopy (TEM)15 are difficult to employ during in situ conditions because the nanoparticle structure would change during the preparation or transportation of the sample or by the lack of long-range ordering.16 It has been shown in the literature that study at the X-ray absorption near-edge spectroscopy (XANES) region (conventionally from below the edge up to
~30–50 eV) provides information about the oxidation state, fractional d-electron density, and electronic environment of the absorbing atom. Spectra obtained from the region extending from the XANES region to as high as 2 keV above the edge are known as the extended X-ray absorption fine structure (EXAFS), and are primarily due to the scattering of the photoelectron off near-neighbor atoms. The amplitude of the EXAFS function χ (k) where k is the wave vector, is proportional to the number of nearest neighbors, and the change of phase with the wavelength of the photoelectron depends on the distance between the emitter and the backscattering atom.17 The backscattering strength also depends on the type or atomic number of atoms involved in the backscattering process. Thus, an analysis of EXAFS data yields structural details about the absorbing atom and its local environment. In recent years XAS studies have been well explored on bimetallic nanoparticles.18 The electronic and structural properties of nanometer- scale metallic clusters have been widely studied by utilizing the L-edge XANES.19 Recently Bazin et al have used a combined full multiple scattering (MS) and principal component analysis (PCA) approach for the K-edge XANES analysis of nanometer-scale transition metals. The combined MS and PCA approach offers a better understanding of the physicochemical processes specific to nanometer scale entities.20 In situ XAS allows investigating the properties of Pt–Ru catalyst particles under working conditions similar to that of actual fuel cell. Even though XAS has been applied to the study of fuel cell
14 electrocatalysts its application during the formation of Pt–Ru nanoparticles has remained relatively less explored. Note that interesting results can be obtained through wide angle X-ray scattering (WAXS) on Pt–Ru nanoparticles.21
In this work, we demonstrate a simple XAS methodology for following the formation of Pt–Ru nanoparticles by analyzing the XAS spectra recorded at the Pt LIII-edge (11564 eV) and Ru K-edge (22117 eV). In addition, we discuss the atomic distribution or alloying extent of Pt and Ru atoms inside the Pt–Ru nanoparticles based on the XAS structural parameters. The methodology proposed in this contribution to study the formation mechanism would be beneficial to a rational design and size and shape control of metal nanoparticle fabrication which is highly required for their superior catalytic activities.
2. Experimental Section
Synthesis of Pt–Ru bimetallic NPs.Carbon-supported Pt–Ru bimetallic NPs were prepared by using a slight modification of colloidal reduction method developed by Watanabe et al.10 In brief,the pH of equimolar aqueous H2PtCl6 and RuCl3 solutions was adjusted to 7 and 4, respectively with 0.6 M Na2CO3 and reduced by using NaHSO3 to their corresponding intermediate compounds. To the each compound hydrogen peroxide was added and again pH was maintained at 5 by using 1 M NaOH. These two solutions were then mixed and the pH was maintained at 5. Later, an appropriate amount of Vulcan XC-72R carbon was added, mixed and heated the mixture at 100 0C for 8 hrs. The resulting colloidal product was then washed with ultra pure water and dried. Hydrogen reduction was performed on the colloidal product at 300 0C for 2 hrs to achieve carbon-supported Pt–Ru bimetallic NPs.
XRD and TEM measurements. Powder X-ray diffraction (XRD) patterns for the final Pt–Ru/C sample was obtained on a diffractometer (Rigaku Dmax–B, Japan) using a Cu K∝ source that was operated at 40 kV and 100 mA. The X-ray diffractogram was obtained at a scan rate of 0.050 s−1 for 2θ values between 200 and 900. Transmission electron microscopy (TEM) examination was performed on JEOL JEM – 1010 microscope that operated at an accelerating voltage of 200 kV. Specimens were
15 prepared by ultrasonically suspending the catalyst powders in ethanol, applying the specimen to a copper grid and drying in air.
XAS measurements. The X-ray absorption spectra were recorded at the Taiwan Beam Line of BL12B2 at the Spring-8, Hyogo, Japan. The electron storage ring was operated at 8 GeV. A double Si(111) crystal monochromater was employed for energy selection with a resolution ∆E/E better than 1
× 10−4 at both the Pt LIII-edge (11564 eV) and the Ru K-edge (22117 eV). All the reaction sequences during the formation of Pt–Ru/C bimetallic nanoparticles were preceded in a homemade cell made with PTFE for XAS study. Two holes were made, one on top of the cell and the other on one side. After placing the liquid samples, the top hole was closed with a Teflon rod to avoid the exposure of the sample to the outer atmosphere. A hollow Teflon rod with a Kapton film cap at one end was inserted into the other in the XAS cell. The position of the Teflon rod was adjusted to reach the optimum absorption thickness (∆µx ≈ 1.0, ∆µ is the absorption edge, x is the thickness of the liquid layer) so that the proper edge jump step could be achieved during the measurements. All of the spectra were recorded at room temperature in a transmission mode. Higher harmonics were eliminated by detuning the double crystal Si(111) monochromator. Three gas-filled ionization chambers were used in series to measure the intensities of the incident beam (I0), the beam transmitted by the sample (It), the beam subsequently transmitted by the reference foil (Ir). The third ion chamber was used in conjunction with the reference sample, which was a Pt foil for Pt LIII-edge measurements and Ru powder for Ru K-edge measurements.
The control of parameters for EXAFS measurements, data collection modes and calculation of errors were all done as per the guidelines set by International XAFS Society Standards and Criteria Committee.22
EXAFS Data Analysis. The XAS experimental data were treated by utilizing the standard procedures.
The EXAFS function, χ, was obtained by subtracting the postedge background from the overall absorption and then normalized with respect to the edge jump step. The normalized χ(E) was transformed from energy space to k-space, where ‘k’ is the photoelectron wave vector. The χ(k) data were multiplied by k2 to compensate the damping of EXAFS oscillations in the high k-region.
Subsequently, k2-weighted χ(k) data in the k-space ranging from 3.6 to 12.6 Å–1 for the Pt LIII-edge,
16 from 3.6 to 11.6 Å−1 for the Ru K-edge were Fourier transformed (FT) to r-space to separate the EXAFS contributions from the different coordination shells. A nonlinear least-squares algorithm was applied to the curve fitting of an EXAFS in the r-space between 0.7 to 3.3 Å for both Pt and Ru depending on the bond to be fitted. The Pt–Ru reference file was determined by a theoretical calculation. Reference phase and amplitude for the Pt–Pt, Pt–O, and Pt–S absorber-scatterer pairs were obtained from a Pt foil, Na2Pt(OH)6 and H2PtCl6, respectively. For Ru−Ru and Ru−O absorber-scatterer pairs the phase and amplitude were obtained from reference Ru powder and RuO2, respectively. All the computer programs were implemented in the UWXAFS 3.0 package23 with the backscattering amplitude and the phase shift for the specific atom pairs being theoretically calculated by using the FEFF7 code.24 From these analyses, structural parameters like coordination numbers (N), bond distance (R) and the Debye–Waller factor (∆σj2) and inner potential shift (∆E0) have been calculated. The amplitude reduction factor, S02, values for Pt and Ru were obtained by analyzing the Pt foil and Ru powder reference samples, respectively, and by fixing the coordination number in the FEFFIT input file. The S02 values were found to be 0.95 and 0.88 for Pt and Ru, respectively.
3. Results and discussion
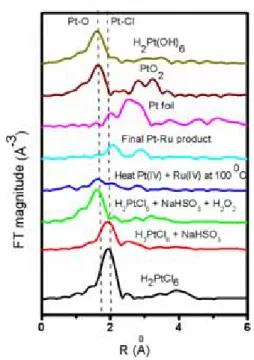
The Pt LIII-edge XANES data were obtained for all the reaction steps during the preparation of Pt–Ru nanoparticles and for a Pt foil, PtO2 and H2Pt(OH)6 reference compounds and are compared in Figure 1.
In the first step the pH of the beginning compound i.e H2PtCl6 is adjusted to 7 and XANES spectra is recorded, the first peak on the rising edge at 11566 eV results from the electronic transition from a 2p3/2
to the unoccupied “d” states near or above the Fermi level. This sharp peak is generally called as white line and its intensity is sensitive to the degree of electron occupancy in the valence orbits of the absorber.25 Generally speaking, the lower the white line intensity, the higher the electron density and the lower the oxidation state of Pt. Hence, changes in the white line intensity may be regarded as an indication of the change in the oxidation state of Pt. Another feature appearing at, postedge, 11580 eV in the spectra of H2PtCl6 is very much similar to the one found by Ankudinov et al. in the XANES spectra
17 of Pt(IV) chlorides.26 This peak is assigned as a hybridization peak by these authors and it arises due to the hybridization of the Pt d photoelectron state with the unoccupied atomic Cl 3d states, mediated by multiple scattering. In the second step the addition of reducing agent NaHSO3 to the H2PtCl6 witnessed a sharpdecrease in the white line intensity and its XANES spectra indicate the decrease in Pt oxidation state (from +4 to +2). However chemical speciation of the compound formed in this step is rather complicated with only XANES results and we will confirm it later during the discussion of EXAFS results. In the third step we have added hydrogen peroxide to the intermediate complex species and in the corresponding XANES spectra there is a sharp increase in white line intensity. Comparison of the spectra with those of reference H2Pt(OH)6 and PtO2 compounds reasonably suggest the species formed are similar to H2Pt(OH)6, which is further supported by EXAFS analysis, indicating that Pt oxidation state is changed from +2 to +4. After mixing the H2Pt(OH)6 species with RuO2 followed by heat treatment at 100 0C for about 8 hrs decreases the white line intensity probably due to the presence of both metallic and ionic contributions of Pt and Ru. We relate this observation to the well-mixed state of Pt and Ru oxidic species and initiation of the reduction reaction. It is interesting that hydrogen peroxide which is acted as an oxidizing agent in the previous step i. e. during the conversion of Pt(SO3)42−
complex ion to Pt(OH)62− will play a different role when RuO2 is added to H2Pt(OH)6. The presence of RuO2 species probably catalyze the decomposition of hydrogen peroxide present excess in the reaction medium and facilitates the in situ reduction of Pt and Ru oxides to certain extent and results in bimetallic Pt–Ru and ionic contributions in the species. This phenomena observed in the present study is consistent with Watanabe et al findings who observed the formation of bimetallic Pt–Ru clusters when RuO2 species were added to platinum oxidic species as was evidenced by XPS studies.10 Even though our XAS results reasonably suggest the presence of both Pt and Ru metallic and ionic contributions in the colloidal product, obtained when H2Pt(OH)6 species mixed with RuO2 followed by heat treatment at 100
0C for about 8 hrs, the exact mechanism of this step needs further studies and we will address this in our future contributions. The XANES spectra recorded after performing the H2 reduction at 300 0C for 2 hrs on the reaction mixture is comparable with that of Pt foil spectra indicating the complete reduction of Pt ions to metallic Pt and the oxidation state of Pt is decreased from +4 to 0.
18 XANES analysis at Ru K-edge of all the reaction steps and reference compounds Ru powder and RuO2 is shown in Figure 2. Upon NaHSO3 addition, the spectrum of RuCl3 changed significantly. The edge energy (the first inflection point on the rapidly rising portion of the absorption edge) has shifted about 2 eV to a lower energy indicating that Ru has been reduced from +3 to +2. We believe that the reduced species are in the form of [Ru(OH)4]2− which will be confirmed later with the EXAFS results.
After the addition of hydrogen peroxide to the intermediate [Ru(OH)4]2− species the edge position is comparable to the near-edge structure of the RuO2 reference compound indicating that Ru has been oxidized from +2 to +4. From these changes and comparison with the reference compound, we infer that the local structure of the formed compound is similar to RuO2. However, when we mix the RuO2
species with H2Pt(OH)6 followed by heat treatment at 100 0C for about 8 hrs shifts the Ru edge energy to lower values indicates formation of a mixed colloid of Pt and Ru oxidic species further supports the enhanced mixing of these species and initiation of the reduction reaction. The XANES spectra recorded after performing the H2 reduction at 300 0C for 2 hrs on the reaction mixture is closely resembles with that of Ru reference spectra indicating the complete reduction of Ru ions to metallic Ru and the oxidation state of Ru is decreased from +4 to 0.
The magnitude of the k2-weighted Pt LIII-edge FT EXAFS spectra for all the reaction steps and reference compounds PtO2 and H2Pt(OH)6 is shown in Figure 3. The transform for the starting compound H2PtCl6 exhibits a strong peak at 2.0 Å characteristic of the presence of Pt–Cl bond. The position and nature of the peak and the number of chlorine atoms found to be comparable with the constants given in the literature.27 The magnitude of the peak corresponding to the Pt–Cl bond decreases upon the addition of NaHSO3 to H2PtCl6 indicating the progressive reduction of Pt4+ ions. Analysis of the EXAFS spectra of this stage revealed that the framework of the [PtCl6]2− is destroyed upon the addition of NaHSO3. The characteristic Pt–Cl bond of the precursor is not observed and the Fourier transform exhibits feature characteristic of only Pt–S (2.31 Å) and Pt–O (2.91 Å) bonds. The coordination of sulfur and oxygen around platinum is found as 3.9 and 2.9, respectively. At this stage it is reasonable to expect that the Pt ions are surrounded by 4 SO32− groups. However, the bond distance of Pt–O (2.91 Å) observed in this step is quite large when compared to the bond distance of Pt–O (2.07 Å)
19 in PtO2 reference compound.28 Hence, we believe that the contribution of oxygen around Pt comes from the attached SO32− groups as a result of multiple scattering. Both the XANES and EXAFS results suggests that the precipitated species formed in this step are like [PtII(SO3)4]6−. Petrow and Allen found six sodium and four moles of SO32− per atom of platinum when NaHSO3 is added to the H2PtCl6
solution with a pH controlled at 7 and present results are consistent with their findings.29 They have prepared a corresponding platinum sulfite complex of form H3Pt(SO3)2OH from Na6[Pt(SO3)4] by replacing sodium atoms via treatment with strong acid resin. They found that the addition of H2O2 to the platinum sulfite complex formed produced platinum oxide species as shown in equation 1.27
H3Pt(SO3)2OH + 3 H2O2 → PtO2 + 3 H2O + 2 H2SO4 (equation 1)
Watanabe et al10 have suggested that the white precipitate obtained after the addition of H2O2 to the platinum sulfite complex acid consists of not only PtO2 but also mixtures of oxides at least in two oxidation states. They reached to this conclusions based on the comparison of XPS of the white precipitate with the XPS on pure platinum.
However, careful examination of XAS results of the present study indicates that when the anionic complex of [PtII(SO3)4]6− is oxidized with hydrogen peroxide the magnitude of the peak corresponding to Pt–S bond is decreased and a new peak at 1.62 Å corresponding to the presence of Pt–O bond (NPt–O, 5.9) is observed. The corresponding FTs closely matches with that of reference H2Pt(OH)6 compound rather than PtO2. This observation reveals that the species formed are more like H2Pt(OH)6.
The following possible reactions are deduced from the XAS results of the present study:
H2PtCl6 + Na2CO3 → Na2PtCl6 + H2O + CO2 (equation 2) Na2PtCl6 + 6 NaHSO3 + 2 H2O → Na6[Pt(SO3)4] + 2 H2SO4 + 2 NaCl + 4 HCl (equation 3) Na6[Pt(SO3)4] + 5 H2O2 → H2Pt(OH)6 + H2SO4 + 3 Na2SO4 (equation 4) Mixing of H2Pt(OH)6 with RuO2 species followed by heat treatment at 100 0C for 8 hrs produces Pt–Pt and Pt–Ru bonds apart from the Pt–O bonds. However, hydrogen reduction at 300 0C for 2 hours on this colloidal mixture led to the appearance of Pt–Ru and Pt–Pt bonds only with bond lengths 2.70 and 2.74 Å, respectively. The best fit EXAFS parameters (N: coordination number, R: bond distance, σ2: Debye–
Waller factor, ∆E0: inner potential shift) are summarized in Table 1.
20 The FT EXAFS spectra collected at Ru K-edge for different reaction steps and reference compounds Ru powder and RuO2 are shown in Figure 4. The different coordination numbers and interatomic distances of the first shell, obtained by fitting the data are given in Table 2. The RuCl3 FT-EXAFS spectra shows a maximum between 1.4 to 2.3 Å corresponds to the nearest chlorine neighbors of Ru.
The NRu–Cl is found to be 6.0 with a Ru–Cl bond length of 2.34 Å. After the addition of NaHSO3 the magnitude of the FT peak of Ru–Cl is decreased and the position of the peak is slightly shifted to lower R values indicates change in the ligand environment from chloride to oxygen. We found oxygen coordination around Ru (NRu–O, 3.9) with a bond length of 2.12 Å. The Ru–O bond length value is similar to the Ru–O in Ru(OH)x compounds.30 This observation indicates that the species formed during this step are in the form of [Ru(OH)4]2−. Upon addition of H2O2 the FT-EXAFS spectra exhibits a peak at 1.2 Å corresponds to the nearest neighbors of Ru: six O atoms at 2.05 Å and it is closely resembles with that of reference RuO2 compound peak indicating the local structure of the obtained species is similar to RuO2.
The corresponding chemical reactions can be written as follows:
2 RuCl3 + 6 NaHSO3 + 4 H2O → 2 Na2[Ru(OH)4] + Na2SO4 + 6 HCl + 5 SO2 (equation 5) Na2[Ru(OH)4]+ H2O2 → RuO2 + 2 NaOH + 2 H2O (equation 6)
Later when we mixed RuO2 with the H2Pt(OH)6 species and followed by heat treatment at 100 0C for 8 hrs, we observed the Ru–O, Ru–Ru and Ru–Pt coordination in the FT-EXAFS spectra and their coordination numbers are found to be NRu–O (4.1), NRu–Ru (1.6) and NRu–Pt (1.2). The observation of Ru and Pt coordination around Ru in this step is believed to be due to the formation of a mixed colloidal sol of unknown composition containing both Pt and Ru ionic as well as metallic contributions. After H2
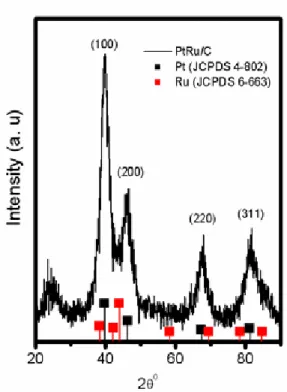
reduction Pt coordination around Ru is observed (NRu–Pt, 1.9) with a bond length of 2.70 Å revealed the formation of Pt–Ru species. It is also evidenced from the XRD pattern of Pt–Ru/C particles as shown in Figure 5, the characteristic platinum fcc peaks (111), (200), (220) and (311) are shifted slightly to higher 2θ values. If the homogeneous solid-solution of Pt–Ru is not formed, then the XRD spectra of pure Ru in an hcp structure would be observed in the scan. However, in the XRD scan no observable peaks that corresponds to those of tetragonal RuO2 and of the hcp structure of pure ruthenium. The increase in 2θ