國立臺灣大學管理學院資訊管理學研究所 碩士論文
Department of Information Management College of Management
National Taiwan University Master Thesis
以創新擴散模型結合社會影響力和認知風險探索消費 者採用創新產品之因子
Why people play Wii? An extended IDT model with social influence and perceived risk
林子超 Lin, Tzu-Chao
指導教授:吳玲玲 博士 Advisor: Wu Ling-Ling, Ph.D.
中華民國 97 年 07 月
July, 2008
中文摘要
近幾年來,遊戲產業的蓬勃發展,尤其是次世代遊戲主機的來臨造成了一股 旋風。2006 年初由微軟率先發表 Xbox360 在遊戲市場掀起了一股熱潮,而 Sony 也不甘示弱的相繼推出 PS3(Play Station 3)加入了這場大戰,在 2006 年底任天堂 推出的 Wii 將這場戰爭達到最高潮,並在這場次世代遊戲主機大戰獨占鰲頭。為 什麼這個後起之秀 Wii 能夠廣受好評而創下如此佳績呢?而又為什麼消費者想 要 去 採 用 這 樣 創 新 的 體 感 式 遊 戲 主 機 呢 ? 我 們 利 用 了 創 新 擴 散 理 論 IDT(Innovation Diffusion Theory)當做我們的基礎模型(Base model),再結合了認知 風險(Perceived Risk)及社會影響力(Social Influence) 來探討是什麼樣的因子會去 影響消費者採用創新產品,又是什麼樣的因子會去幫助消費者將這種創新產品在 一個社會體系中擴散開來。我們將認知風險(Perceived Risk)當作模型內的中介變 數 (Mediator) , 和 不 同 的 採 用 者 (adopter categories) 當 作 模 型 內 的 調 節 變 數 (Moderator)去探討創新認知屬性和社會影響力對於採用意願的關係。我們利用問 卷收集的方式以及相關的統計方法-結構方程模組(Structural equation modeling SEM)來幫助我們找到研究問題的答案。最後我們根據我們研究的結果去提供行銷 管理人員一些行銷策略的建議
關鍵字: 創新擴散理論 IDT (Innovation Diffusion Theory), 認知風險 Perceived Risk, 社會影響力 Social Influences
ABSTRACT
In recent years, the game industry has been growing rapidly. In particular, innovative video games like motion-sensitive game consoles have recently received increasing popularity. The primary research question to be addressed in this research is “Why do people adopt the innovative game console?” We want to apply IDT (Innovation Diffusion Theory, Rogers, 1983, 2004) as our base model with perceived risk (Jocoby & Kaplan, 1972) and social influence (Moore and Benbasat, 1990). In our extend IDT, perceived risk mediate the effects of technological factors (perceived attributes of innovation) and social factors (social influence) onto use intention.
Moreover, adopter categories moderate the relationships in our conceptual model. A preliminary version of a 49-item online questionnaire was developed. We asked 701 respondents on a gamers’ website and BBS to complete the online questionnaire. To achieve the purposes of our research and test the hypotheses, we employed the SPSS 14.0 (Statistical Package for the Social Sciences) and structural equation modeling (SEM) with LISREL to help us analyze the collected data. Our contribution to this research area is twofold. We explain 1) how the factors affect the people to adopt an innovation and 2) the factors that help people diffuse an innovation and reduce uncertainty about it. Finally, our research provides marketing managers with some suggestions about marketing strategies, such as audience segmentation (Rogers, 2005).
Keywords: IDT (Innovation Diffusion Theory), Perceived Risk, Social Influences,
Audience SegmentationTable of Contents
中文摘要... I ABSTRACT ... II Table of Contents ... III List of Tables ... IV List of Figures ... V
1. Introduction ... 1
1.1. Research Background ... 1
1.2. Research Motivations... 2
1.3. Research Purpose ... 3
2. Literature Review ... 5
2.1. Innovation ... 5
2.2. Perceived Risk ... 5
2.3. Innovation Diffusion Theory ... 7
2.4. Social Influences ... 10
2.5. Innovativeness of Adopters ... 12
2.6. Conceptual Model ... 15
3. Research Methodology ... 17
3.1. Sampling ... 17
3.2. Measures ... 18
3.3. Analysis Method ... 23
4. Results ... 27
4.1. Reliability ... 27
4.2. Measurement Model (Validity) ... 27
4.3. Structural Model ... 34
4.4. Discussion ... 36
5. Conclusion ... 38
5.1. Managerial Implications ... 38
5.2. Future Research Direction ... 39
5.3. Limitation ... 40
References ... 41
Appendix ... 45
Questionnaire (English Version) ... 45
Questionnaire (Chinese Version) ... 48
List of Tables
Table 1. Definitions of Jacoby and Kaplan’s five perceived risks ... 6
Table 2. Definitions of Moore and Benbasat’s perceived attributes of innovation ... 8
Table 3. Definitions of Deutsch and Gerard’s social influences ... 10
Table 4. The relationships among the three concepts of social influences ... 11
Table 5. Demographic Profile ... 18
Table 6. Source of Indicators ... 23
Table 7. Cronbach’s alpha for each measurement ... 27
Table 8. Factor Analysis for Perceived Attributes of Innovation ... 28
Table 9. Factor Analysis for Social Influences ... 29
Table 10. Factor Analysis for Perceived Risk ... 30
Table 11. Factor Analysis for Use Intention ... 30
Table 12. Model Fit Indices for Measurement Model ... 31
Table 13. Convergent Validity Assessment ... 32
Table 14. Discriminant Validity Assessment through AVE ... 33
Table 15. Sizes of adopter category ... 34
Table 16. Structural Equations Results for Moderator Effects Models ... 35
Table 17. Change in Standardized Path Coefficient ... 35
List of Figures
Figure 1. Our Research Model ... 16
Figure 2. Adopter Category ... 21
Figure 3. Hypotheses Model ... 36
1. Introduction
1.1. Research Background
In recent years, the game industry has been growing rapidly. In particular,
innovative video games like motion-sensitive game consoles have recently received
increasing popularity.
For instance, Wii, which is one of the motion-sensitive game consoles, is the
fifth home video game console developed by Nintendo. An innovative feature of this
console is its wireless controller, Wii Remote, which can be used as a handheld
control device that can detect acceleration in 3D. This feature has revolutionized
traditional hand-contolled video games. The DFC forecasts that Wii will become the
best-selling hardware unit in Japan and possibly worldwide (Datamonitor, 2007).
According to a recent AOL survey (Sina, 2007), Wii ranked the third in the 2007 Top
15 Hot and Popular Products in American. Moreover, according to The Annual
Video Game Industry Report in 2007, Wii was in second place in terms of total sales
in Japan (NS-shop, 2007). Because the motion-sensitive game console has
revolutionized video games, it has become known as a “killer application” in the
entertainment community and among gamers worldwide.
This motivates us to ask: Why do people adopt innovative game console like Wii?
Understanding the game’s phenomenal success would enable designers to develop
other popular games and help marketing managers adjust their marketing strategies.
1.2. Research Motivations
The primary research question to be addressed in this research is “Why do
people adopt the innovative game console?” In our research, we apply IDT
(Innovation Diffusion Theory) (Rogers, 1983, 2005) to explain the adoption behavior
and use intentions.
In order to reach our research context and explain our research question
completely, we extend IDT in three ways. First, as people are presented with an
innovation, they invariably experience some uncertainty (perceived risks) (Jacoby &
Kaplan, 1972) about it. Thus, the use intention will decrease. In addition to our
primary research questions, we try to determine the factors that affect perceived risks.
Specifically, by perceived risks as a mediator, we explore 1) the relationship between
technological factors (perceived attributes of innovation) and the adoption attitude
toward the innovation (use intention); and 2) the relationship between social factors
(social influences) and the adoption attitude toward the innovation (use
intention).Second, IDT is a social process (Rogers, 2005), but the theory does not
consider that social factors affecting an innovation in different stages of the diffusion
process; hence we incorporate the construct of social influences (Deutsch & Gerard,
1955) into our conceptual model. Finally, according to IDT, there are different
adopters in the different stages of the adoption processes. Facing uncertainty about
innovations, they have different levels of perceived risks because they have different
personality, socioeconomic and knowledge about innovations. Therefore, they would
be influenced by different factors that help reduce their perceived risks. Thus, we
argued adopter categories could moderate our conceptual model. Hence, in this thesis,
we propose a synthesized conceptual model to determine why people adopt an
innovation.
1.3. Research Purpose
The purpose of this research is to use IDT as the base model and integrate social
influences and perceived risks in order to develop a new theoretical model that can
explain adoption behavior and use intention. In our extend IDT, perceived risk
mediate the effects of technological factors and social factors onto use intention. In
addition, adopter categories moderate the relationships in our conceptual model. Our
contribution to this research area is twofold. We explain 1) how the factors affect the
people to adopt an innovation and 2) the factors that help people diffuse an innovation
and reduce uncertainty about it. Specifically, we apply the proposed model to the
game console phenomenon.
The remainder of this thesis is structured as follows. In Chapter 2, we provide a
literature review, present our hypotheses, and explain our conceptual model. Chapter
3 describes our methodology, including the sampling method, measurement
development, and analysis method. In Chapter 4, we test our hypotheses using
statistical tools, namely Lisrel and SPSS and we summarized our findings. In chapter
5, we provide some marketing strategies to marketing managers.
2. Literature Review
2.1. Innovation
In 1962, Rogers proposed the Innovation Diffusion Theory (IDT) to explain why
people adopt a new product or a new idea, and how diffusion of a new product or idea
occurs. He defined innovation as an idea, practice, or object that is perceived as new
by an individual or group (Rogers, 2005).
2.2. Perceived Risk
Innovation is not a sufficient reason for a technology to be adopted because it is
widely recognized that consumers often perceive an element of risk when they adopt
an innovation (Rogers, 2005). Therefore, we propose perceived risk is an interim
period before deciding to adopt an innovation.
Rogers (2005) noted that a technological innovation leads to uncertainty in the
mind of potential adopters. This uncertainty can be represented in terms of as
perceived risk. Conchar et al. (2004) found that perceived risk may negatively affect
the decision to adopt and use new products. Perceived Risk is commonly thought of
as the uncertainty felt about the possible negative consequences of using a product or
service (Featherman & Pavlou, 2003). In their study, Featherman and Pavlou found
that perceived risk reduces adoption intention. Teo and Pok (2003) also found that
perceived risk is negatively associated with the attitude of adopting and using a
WAP-enabled mobile phone. Based on the above findings, we put forward the
following hypothesis:
H1: Perceived Risk is negatively associated with Use Intention.
Jacoby and Kaplan (1972) also proposed five facets of perceived risk, namely,
performance risk, financial risk, psychological risk, social risk, and physical risk. The
five dimensions are defined in Table 1.
Table 1. Definitions of Jacoby and Kaplan’s five perceived risks Construct Definition
Performance Risk The risk that there will be something wrong with products or services, or that it will not meet expectations.
Financial Risk The risk that maintaining the product or service will cost more than expected.
Physical Risk The risk that products or services may be harmful or injurious to health
Psychological Risk The risk that products or services will not fit well with the user’s self-image or self-concept, and will cause a loss of self-esteem.
Social Risk The risk that products or services will cause the user to lose status in his/her social group.
Source: Jacoby and Kaplan (1972), Featherman and Pavlou (2003)
We argued perceived risks mediate the effects of technological factors (perceived
attributes of innovation) and social factors (social influence) and use intention.
Kuhlthau (1993) has also proposed uncertainty as a basic principle for information
seeking. Information seeking activities can reduce uncertainty about the innovations
(Rogers, 2005). Due to uncertainty, people would seek information to reduce the
anxiety in their mind. According to an earlier study (Geoffrey & Roger, 1981), the
source of information seeking can divided into non-interpersonal search and
interpersonal search. In our research, we proposed the following two factors to help
people reduce perceived risk: technological factors (perceived attributes of innovation)
and social factors (social influences). When these risks are reduced, use intention will
increase. Therefore, technological factors and social factors are the antecedents of
perceived risk.
2.3. Innovation Diffusion Theory
2.3.1. Perceived attributes of innovation
The perceived attributes of innovation represent one of important technological
factors that affect adoption behavior (Roger, 2005); hence, they represent a key factor
in the adoption of innovations. If people perceive or rate the attributes of an
innovation highly, they will adopt it.
Moore and Benbasat (1990) developed scales to measure the perceived
attributes of an innovation that may affect its diffusion. The perceived attributes of
innovation, which were based on the Innovation Diffusion Theory (Rogers, 1983)
include relative advantage, ease of use, compatibility, observability, and trialability.
However, Moore and Benbasat proposed some new constructs, namely, voluntariness
and they replaced Roger’s attribute of observability with image, visibility, and result
demonstrability. Their perceived attributes of innovation are defined in Table 2.
Table 2. Definitions of Moore and Benbasat’s perceived attributes of innovation Construct Definition
Relative advantage The degree to which an innovation is perceived as better than the idea it supersedes.
Ease of use The degree to which an individual believes that using a particular system would be free of physical and mental effort.
Compatibility The degree to which an innovation is perceived as being consistent with the current values, needs, and past experiences of potential adopters.
Trialability The degree to which an innovation may be experimented with before adoption.
Image The degree to which use of an innovation is perceived as enhancing one’s image or status in one’s social system.
Visibility The degree to which adopters see the innovation as being visible in the adoption context.
Result demonstrability The degree to which the results of using an innovation are perceived to be tangible.
Voluntariness The degree to which the use of the innovation is perceived as being based on free will.
Source: Moore and Benbasat (1990)
Our research investigates innovation adoption behavior in the context of
motion-sensitive game consoles. It is assumed that use intentions depend on the
following six attributes proposed by Rogers (1983) and Moore and Benbasat (1990):
relative advantage, ease of use, compatibility, trailability, image, and visibility. Result
demonstrability and voluntariness do not fit the motion-sensitive game consoles’
context well, so we omit them.
In addition, usability (relative advantage) has become a term among
Human-Computer Interaction (HCI) researchers in recent years (John & Ding, 2002).
Game designers have their own term, playability, which was coined by game
designers and experts in the game industry almost 10 years (John & Ding, 2002).
Moreover, previous studies have found that the use of entertainment-oriented
technologies, such as online games, is influenced by perceived enjoyment (Davis,
Bagozzi, & Warshaw, 1992; Van der Heijden, 2003; Hsu & Lu, 2004; Hsu & Lu, 2005;
Ha, Yoon, & Choi, 2007). Therefore, in our research, we replace relative advantage
with playability and perceived enjoyment to fit the context of motion-sensitive game
consoles.
The success of innovation technology products depends on people’s perception
of technological factors, i.e., the perceived attributes of innovation. Holak and
Lehmann (1990) focused on customer acceptance by exploring how the perceived
attributes of innovation and perceived risk combine to affect the use intention of an
innovation. They found that relative advantage, compatibility, and ease of use were
negatively correlated to perceived risk. Featherman and Pavlou (2003) used perceived
risk to predict the adoption of e-services. The results indicate that relative advantage
and ease of use significantly reduce perceived risk. According to Rogers (2005),
technological factors can reduce the uncertainty and risks associated with an
innovation. In this thesis, we propose the following hypothesis:
H2: Perceived Attributes of Innovation are negatively associated with Perceived Risk.
2.4. Social Influences
Social factors (Social influences) also help reduce consumer’s perceived risks
and diffuse an innovation. A social process, involving interpersonal relationships, is a
central tenet of IDT (Rogers, 1976, 2005). In addition, social influences have a very
strong impact on most people’s perceptions, beliefs, and actions (Asch, 1955). Hence,
social influences are another issue that we consider in our research.
Deutsch and Gerard (1955) defined two types of social influences:
informational influence and normative social influence, which are defined in Table 3.
Table 3. Definitions of Deutsch and Gerard’s social influences Construct Definition
Normative Social Influence
An influence that pressures an individual to conform with the positive expectations of another.
Information Social Influence
An influence that pressures an individual to accept information obtained from another as evidence about reality.
Source: Deutsch and Gerard (1955)
The two types of social influences, “normative” and “informational” social
influence, are related to two psychological needs that lead people to conform. One
relates to people who need to be liked, so they conform to normative influence. The
other relates to people who need to be right, so they conform to informational
influence.
These two social influences manifest through three processes: internalization,
identification, and compliance (Kelman, 1958, 1961). Based on the work of Deutsch
and Gerard (1955) and Kelman (1958, 1961), Park & Lessig (1977) identified three
motivational influences that derive from reference groups, namely value-expressive
influence, utilitarian influence, and informational influence. Each of Kelman’s
processes relates to one of Deutsch and Gerard’s social influences types and one of
Park and Lessig’s reference group influences. Their relationships are summarized in
Table 4.
Table 4
. The relationships among the three concepts of social influences Influence Process Reference Group Influence
Normative Social Influence
Identification Value-expressive Reference Group Influence
Compliance Utilitarian Reference Group Influence
Informational Social Influence
Internalization Informational Reference Group Influence
Sources: Kelman (1958, 1961), Burnkrant and Cousineau (1975), Park and Lessig (1977), Bearden and Etzel (1982), and Bearden, Netemeyer, and Teel (1989)
Normative pressure from reference groups reduces an individual’s perceived
risk in adopting an innovation (Thompson, Higgins & Howell, 1994). Perry and
Hamm (1969) proposed that the higher the risk involved in a buying decision, the
greater the importance of personal influence will be. Lutz and Reilly (1974) found
that consumers tend to use more sources of information when faced with increased
levels of perceived risk. These social factors can reduce uncertainty about the
innovations. This leads to the following hypotheses:
H3a: Normative Social Influence is negatively associated with Perceived Risk.
H3b: Informational Social Influence is negatively associated with Perceived Risk.
2.5. Innovativeness of Adopters
According to IDT (Rogers, 2005), people react differently to an innovation
because of their different characteristics and levels of innovativeness; that is the
degree to which an individual or group adopts new ideas relatively earlier than other
members of a social system. Previous studies have found that that innovativeness
results from different personal traits (Bruce & Witt, 1970; Jacoby, 1971; Im, Bayus,
& Mason., 2003) and developed some scales to measure levels of innovativeness
(Hurt & Joseph, 1977; Midgley & Dowling, 1978; Hirschman, 1980; Flynn &
Glodsmith, 1993; Hirunyawipada & Paswan, 2006).
Based on the above scales, Rogers (1983) classified adopters into five categories
called Adopter Categories (AC). They are: innovators, early adopters, early majority,
late majority, and laggards. The approximate percentage of people in each group is
2.5%, 13.5%, 34%, 34%, and 16%.
their perceptions of an innovation’s characteristics and the adoption innovation factors
they are concerned about (Yi, Fiedler & Park, 2006). Based on the Cross the Chasm
(Moore, 1999), there is a chasm between early adopters and early majority in stages of
adoption processes. The chasm means that the two groups of people have different
personalities, socioeconomic backgrounds, and psychological characteristics. In our
research, we focus on innovators, early adopters, the early majority, and the late
majority. Early adopters and innovators are combined into one category, called earlier
adopters. The early majority and late majority are also combined into one category,
called later adopters. Laggards are omitted because of their resistance to innovation,
so they are not a key part of our research. Thus, hereafter, we focus on two groups:
earlier adopters and later adopters.
The two groups of adopters differ in terms of socioeconomic characteristics,
personality variables, and communication behavior patterns. Earlier adopters are
better able to cope with uncertainty and risk than later adopters because they have
sufficient knowledge to estimate risks (Rogers, 2005). In their empirical study, Labay
and Kinnear (1981) also found earlier adopters are less concerned about financial
risks and social risks than later adopters or non-adopters. Therefore, we propose the
following hypothesis:
H4: The relationship between Perceived Risk and Use Intention is stronger
for Later Adopters than for Earlier Adopters.
With regard to communication behavior, earlier adopters seek information about
innovations more actively than later adopters. They also have more knowledge about
innovations (Rogers, 2005). Rogers (1983) argued that individuals develop an attitude
about adopting an innovation by collecting information from a variety of channels,
including mass media and interpersonal channels. Mass media are usually fast and
efficient communication channels that can provide information to individuals,
especially for earlier adopters (Rogers, 2005). In addition, Rogers suggested that an
interpersonal channel that involves face-to-face interaction between two or more
individuals during the exchange of information is also an efficient means of
communication, especially for later adopters. The Bass Forecasting Model (Bass,
1969) showed that potential adopters of an innovation are influenced by two types of
communication channels: mass media and interpersonal channels. Bass suggested that
earlier adopters are usually influenced by mass media, while later adopters are usually
influenced by interpersonal messages. In an earlier empirical study, James et al. (1969)
found that innovators is influenced by formal media, such as popular technical
magazines. Manning, Bearden, and Madden (1995) used two concepts of innovation
to analyze the new product adoption process. Their results show that consumers in the
early stages of the adoption process often seek novel information about a new product.
Meanwhile, consumers in the later stages of the adoption process often ask their
friends or relatives about a new product. Therefore, earlier adopters have knowledge
about innovations than later adopters do. Clark and Goldsmith (2006) found that the
higher the level of global innovativeness, the lower the level of normative
interpersonal influence, and the higher the level of informational interpersonal
influence. Karahanna, Straub, and Chervany (1999) found that potential adopters are
more influenced by subject norm than existing users. Therefore, we propose the
following hypotheses:
H5: The relationship between Perceived Attributes of Innovation and Perceived Risk is stronger for Earlier Adopters than for Later Adopters.
H6: The relationship between Informational Social Influence and Perceived Risk
is stronger for Earlier Adopters than for Later Adopters.
H7: The relationship between Normative Social Influence and Perceived Risk is
stronger for Later Adopters than for Earlier Adopters.2.6. Conceptual Model
Based on the literature review, we suggest that 1) perceived risk will reduce use
intention and 2) perceived attributes of innovation and social influences can reduce
Perceived Risk Then, adopter categories moderate all the relationships. For the
purpose of our research, we have developed the conceptual model shown in Figure1.
Figure 1. Our Research Model
3. Research Methodology
A preliminary version of a 49-item questionnaire was developed and
adapted based on the related literature. The questionnaire used in this research is
comprised of five parts: perceived attributes of innovation (23 items), social
influences (12 items), perceived risk (5 items), use intention (3 items), and
innovativeness of adopters (6 items). We measure the items on 7-point Likert scale
with anchors of 1=Strongly Disagree to 7=Strongly Agree.
3.1. Sampling
In the sampling process, people who have experiences in playing game were
essential to collect. The questionnaire was designed to be placed on homepages on a
web site. Asp.net programming was developed to handle the data collection process.
We will post our questionnaire website on the famous game forum “Bahamut”
(www.gamer.com.tw) and BBS (Bulletin Board System). In total, 743 surveys were
collected in four weeks. After weeding entries of incomplete answers, and having the
same answer for a lot of questions, 701 respondents were valid (94.35%). The
incentive for respondent in the online survey is NT 150 gift card lottery. Table 5
shows the descriptive statistics of the sample. Our research was also compared to
market intelligence center (MIC) in November, 2007.
Table 5. Demographic Profile
Sample in Our Research MIC 2007
Variable Description Frequency (%) (%) Gender Male 398 (56.8%) (65.8%) Female 303 (43.2%) (34.2%)
Age Under 14 0 (0.00%) The average is 22.8 years
old.
The major group is 20-24.
15-19 55 (7.85%)
20-24 421 (60.06%)
25-29 185 (26.39%)
30-34 30 (4.28%)
35-39 8 (1.14%)
More than 40 2 (0.28%)
Education Junior high school or less 10 (1.43%) N/A
High school 11 (1.57%)
College 18 (2.57%)
Bachelor’s degree 463 (66.05%) Graduate degree or above 199 (28.38%)
Occupation Student 487 (69.47%) (56.1%)
Not student 214 (30.53%) (43.9%)
Experience in Game 1 year 56 (7.99%) N/A
2 years 61 (8.70%)
3 years 72 (10.27%)
4 years 30 (4.28%)
5 years 43 (6.13%)
6 years 20 (2.85%)
More than 6 years 419 (59.78%) (48.7%)
3.2. Measures
The purpose of this research is to investigate adoption behavior and use of
motion-sensitive game consoles, and determine the different ways of eliminating
perceived risk of adopters when they are presented with an innovation. All measures
were adapted from pre-existing scales in the literature. The operational definitions are
detailed in Table 6.
To ensure that the English version of the instrument was conceptually equivalent
to the Chinese culture, the translation processes were implemented in the following
steps. 1) Forward translation: the English version was translated into Chinese by a
bilingual translator knowledgeable about English-speaking and Chinese-speaking
cultures. 2) Two graduate students and the original translator were invited to assess
the adequacy of the translation and identify any discrepancies between the forward
translation and the previous versions of the questionnaire. Then, the back-translation
was adopted as the first step. The Chinese version questionnaire was translated back
to the English version by another independent bilingual translator. The
back-translation focused on the conceptual and cultural equivalence of the original
version. Discrepancies were discussed by all the experts mentioned in Steps 1 and 2.
The accurate rate is about 94.11%. The discussion continued until an adequate version
was obtained. Details of the content of the questionnaire are given in the Appendix.
3.2.1. Perceived Attributes of Innovation
Based on Moore and Benbasat’s work (1990), the items for Perceived Attributes
of Innovation were evaluated along eight dimensions: relative advantage, ease of use,
compatibility, trailability, image, visibility, result demonstrability and voluntariness.
Result demonstrability and voluntariness were omitted for the reasons mentioned in
Chapter 2. We also modified the scales from previous studies (Yi, Fiedler, & Park,
2006; Lewis, Agarwal, & Sambamurthy, 2003; Teo & Pok, 2003; Taylor & Todd,
1995; Davis, 1989). In addition, we replaced the scales for measuring the relative
advantage dimension with playability (Desurvire, Caplan, & Jozesef, 2004) and
perceived enjoyment (Davis, Bagozzi, & Warshaw, 1992) to suit motion-sensitive
game consoles’ context.
3.2.2. Social Influences
The scales for measuring social influences, including normative and
informational factors, were modified from Bearden et al (1989). The construct for
social influences evaluated respondents’ susceptibility to interpersonal influence.
3.2.3. Innovativeness of Adopters
The respondents were classified into three categories on the basis of their
self-reported behavior patterns. The criterion for adopter categorization is
innovativeness (Roger, 2005). For the purposes of the analysis, we split the
distribution of innovativeness scores to form three groups of respondents, namely,
earlier adopter, later adopter, and laggard. One standard deviation above the mean
value and one standard deviation below the mean value for the innovativeness score
were taken as a splitting point of three groups of respondents (See Figure 2). The First
group is early adopters the second group is later adopters, and the third group is
laggards. Laggards are omitted because of their resistance to innovation, so they are
not a key part of our research. This procedure is proposed by Flynn and Goldsmith
(1992). The innovativeness scales were adapted from Hirschman (1980), Goldsmith
and Hofacker (1991), Flynn and Goldsmith (1993), and Hirrunyawipada and Paswan
(2006), with modifications to suit the motion-sensitive game consoles’ context.
Source: Source: Rogers, E. M. (1983). Diffusion of Innovations, Moore, G. A. (1999). Crossing the Chasm
Figure 2. Adopter Category
3.2.4. Perceived Risk
The scales for measuring perceived risk, including performance risk, financial
risk, physical risk, psychological risk, and social risk, were modified from Peter and
Tarpey (1975) and Jacoby and Kaplan (1972). The construct for perceived risk
evaluated respondents’ perception of the probability of risk and perception of the
importance of risk.
Although the literature contains a wide variety of measures of perceived risk
(Bettman, 1973; Peter & Tarpey, 1975; and Dowling & Stealin, 1994), the proposed
model shows not only a multiplicative function of the probability and importance of
risk, but also the various facets of risk (Peter & Tarpey, 1975). Peter and Tarpey
developed the perceived risk model to measure them. The following model was
formulated:
OPR
j∑
=
×
= n
i
PL
ijIL
ij1
where
OPR = over perceived risk for brand j
jPL = probability of risk i form purchase of brand j
ijIL = importance of risk i form purchase of brand j
ijn
= risk facetsHence, we use the model to measure and calculate perceived risk in this research.
3.2.5. Use Intention
The scales for the use intention were modified from Hsu, Lu, and Hsu (2007),
Taylor and Todd (1995) and Yi et al. (2006). For these items, we evaluated the survey
future.
Table 6. Source of Indicators
Construct Dimension Source Perceived Attributes of
Innovation
Relative advantage Ease of use
Compatibility Trialability Image Visibility
Adapted from Moore and Benbasat (1990), Yi et al.
(2006), Lewis et al. (2003), Teo and Pok (2003), Taylor and Todd (1995), Davis (1989), Desurvire et al.
(2004), and Davis et al.
(1992) Social Influences Normative Social Influence
Informational Social Influence
Adapted from Bearden et al.(1989)
Innovativeness Earlier adopter Later adopter
Adapted from Hirschman (1980), Goldsmith and Hofacker (1991), Flynn and Goldsmith (1993), and Hirrunyawipada and Paswan (2006)
Perceived Risk Performance Risk Financial Risk Physical Risk Psychological Risk Social Risk
Adapted from Peter et al.
(1975), and Jacoby(1972)
Use Intention Adapted from Hsu et al.
(2007), Taylor and Todd (1995) and Yi et al. (2006)
3.3. Analysis Method
To conduct our research and test the hypotheses, we used the SPSS 14.0
(Statistical Package for the Social Sciences) and structural equation modeling (SEM)
with LISREL to help us analyze the collected data. We employ the following analysis
methods in the research.
Structural Equation Modeling (SEM) is an important technique of multivariate
statistical analysis that has been widely applied in the fields of social science and
marketing. SEM is not a completely new statistical technique. It is a combination of
factor analysis and path analysis. This technique is comprised of two parts: a
measurement model, which is used to reflect the relationships between measured
variables and latent variables; and a structural model, which is used to verify the
structural relationships between constructs.
3.3.1. Reliability
Regarding reliability of the scales, the fair threshold generally acknowledged
was 0.6 for Cronbach’s alpha (Cronbach, 1951; Malhotra, 1993). Broadly speaking,
all scales exceed 0.7 and the reliability analysis yielded favorable results.
3.3.2. Measurement Model (Validity)
Step1: Exploratory Factor Analysis (EFA)
PCA with Varimax as the orthogonal rotation method was applied to extract the
latent variables. The Kaiser-Meyer-Olkin (KMO) coefficient (greater than 0.7) and
significant p-values for the Bartlett’s sphericity test were carried out to examine the
adequacy for factor analysis. In addition, factors with eigenvalue above 1.0 would be
extracted and the absolute value of each factor loading after rotation should reach at
Tatham, & Black, 1998).
Step2: Confirmatory Factor Analysis (CFA)
CFA was often used in data analysis as a further step to examine the expected
factor structure and it was preferred when measurement model had a mature
development in the underlying theory. LISERL was employed to examine convergent
validity of each construct. We evaluated the model fit from three types of indices
describing below:
(1)absolute indices such as adjusted goodness-of-fit index (AGFI) greater than 0.8
(Gefen, Straub, & Boudreau, 2000), root mean square eroor of approximation
(RMSEA) lower than 0.08 for a acceptable fit (Bagozzi & Yi, 1988), and standardized
root mean square residual (SRMR) lower than 0.1 (McDonald & Ho, 2002) (2)
comparative indices such as normed fit index (NFI) greater than 0.9, non-normed fit
index (NNFI) greater than 0.9 (Bentler & Bonett, 1980), incremental fit index (IFI)
greater than 0.9 (Bentler & Bonett, 1980), and comparative fit index (CFI) larger than
0.9 (Bentler, 1995); and (3) parsimonious indices such as normed chi-square (χ2/df)
lower than 3 (Hair, Anderson, Tatham,& Black, 1998), parsimonious normed fit index
(PNFI) greater than 0.5 (Hu, & Bentler, 1999) and parsimonious goodness-of-fit index
(PGFI) greater than 0.5 (Bagozzi & Yi, 1988). Furthermore, the chi-square statistic
index was too sensitive to large sample size that the null hypothesis would be rejected
too easily (Hair, Anderson, Tatham, & Black, 1998) so in the loose condition,
chi-square (χ2/df) lower than 5.
3.3.3. Structural Model
Structural model was evaluated through structural equation modeling (SEM)
which was a combination of the traditional factor analysis and path analysis. SEM
with maximum likelihood (ML) estimation using LISREL was carried out to examine
the hypothesized relationship among constructs.
4. Results
4.1. Reliability
The reliability of all instruments was assessed by the Cronbach alpha reliability
coefficient (see Table 7).
Table 7. Cronbach’s alpha for each measurement
Scale Items Cronbach’s α Relative advantage 4 0.83
Compatibility 3 0.80
Image 3 0.68
Ease of Use 4 0.89
Visibility 4 0.87
Trialability 5 0.88
Normative Social Influence 5 (Delete 3 items) 0.88 Informational Social Influence 4 0.88 Perceived Risk 5 0.72 Use Intention 3 0.87
Innovativeness 6 0.60
4.2. Measurement Model (Validity)
4.2.1 Exploratory Factor Analysis (EFA)
Regarding the scale on perceived attributes of innovation, the KMO coefficient
(0.897) and χ2(253)(8767.214) for Barletts sphericity test (p < .001) showed that they
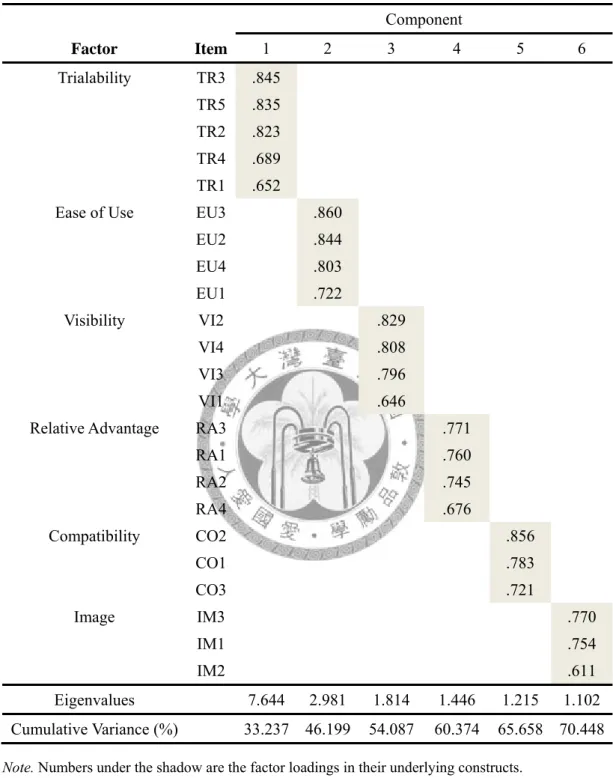
were suitable for factor analysis. Six factors explaining 70.448% total variance
yielded: trialability, ease of use, visibility, relative advantage, compatibility, and
image, each item loaded well on the suited factor as listed in Table 8.
Table 8. Factor Analysis for Perceived Attributes of Innovation
Component
Factor Item 1 2 3 4 5 6 Trialability TR3 .845
TR5 .835 TR2 .823 TR4 .689 TR1 .652 Ease of Use EU3 .860
EU2 .844
EU4 .803
EU1 .722
Visibility VI2 .829
VI4 .808
VI3 .796
VI1 .646
Relative Advantage RA3 .771
RA1 .760
RA2 .745
RA4 .676
Compatibility CO2 .856
CO1 .783
CO3 .721
Image IM3 .770
IM1 .754
IM2 .611
Eigenvalues 7.644 2.981 1.814 1.446 1.215 1.102 Cumulative Variance (%) 33.237 46.199 54.087 60.374 65.658 70.448
Note. Numbers under the shadow are the factor loadings in their underlying constructs.
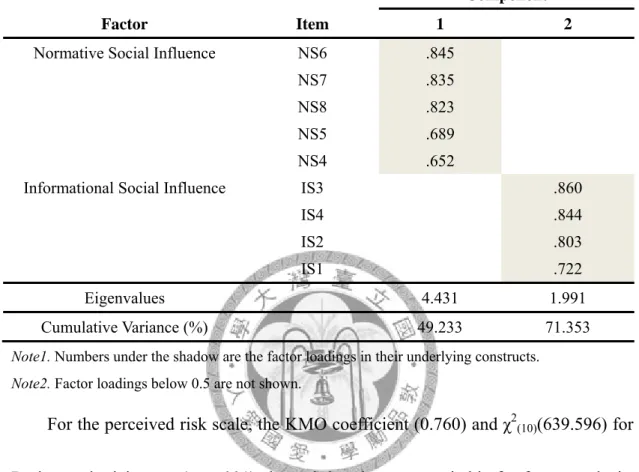
For the social influences scales, the KMO coefficient (0.855) and χ2(36)(3739.979)
for Barletts sphericity test (p < .001) showed that they were suitable for factor
analysis. Six factors explaining 71.353% total variance yielded: normative social
influence and informational social influence, each item loaded well on the suited
factor as listed in Table 9.
Table 9. Factor Analysis for Social Influences
Component
Factor Item 1 2
Normative Social Influence NS6 .845
NS7 .835
NS8 .823
NS5 .689
NS4 .652
Informational Social Influence IS3 .860
IS4 .844
IS2 .803
IS1 .722
Eigenvalues 4.431 1.991 Cumulative Variance (%) 49.233 71.353
Note1. Numbers under the shadow are the factor loadings in their underlying constructs.
Note2. Factor loadings below 0.5 are not shown.
For the perceived risk scale, the KMO coefficient (0.760) and χ2(10)(639.596) for
Barletts sphericity test (p < .001) showed that they were suitable for factor analysis.
Five factors explaining 47.355% total variance yielded: perceived risk, each item
loaded well on the suited factor as listed in Table 10.
Table 10. Factor Analysis for Perceived Risk
Component
Factor Item 1
Perceived risk PSRISK .766 PERISK .747 FIRISK .711 PHRISK .604 SORISK .592
Eigenvalues 2.368
Cumulative Variance (%) 47.355
Note. Numbers under the shadow are the factor loadings in their underlying constructs.
For the use intention scale, the KMO coefficient (0.700) and χ2(3)(1152.734) for
Barletts sphericity test (p < .001) showed that they were suitable for factor analysis.
Five factors explaining 79.405% total variance yielded: perceived risk, each item
loaded well on the suited factor as listed in Table 11.
Table 11. Factor Analysis for Use Intention
Component
Factor Item 1
Use intention UI2 .926 UI1 .910 UI3 .835
Eigenvalues 2.382
Cumulative Variance (%) 79.405
Note. Numbers under the shadow are the factor loadings in their underlying constructs.
4.2.2 Confirmatory Factor Analysis (CFA)
Convergent Validity
Convergent validity was assessed based on the criteria that indicator’s estimated
coefficient was significant on its posited underlying construct factor. In assessing
convergent validity of measures, four criteria were evaluated:
(1) The measurement model should have good model fit.
(2) Each path must have significant lambda coefficient (Anderson & Gerbing, 1988)
(3) All lamba value in CFA model exceed 0.5 (Fornell & Larcker, 1981).
(4) Composite Reliability1 should exceed 0.7 (Fornell and Larcker, 1981)
All λ value in CFA model exceeds 0.5 and was significant at p < .001. The fit
indices for measurement model were good, indicating that the model was reasonably
consistent with the data (see Table 12 and Table 13). In addition, the chi-square
statistic index of our research was 3.75. That is not fit with criterion. However,
according to Hair (Hair, 1998), this index was too sensitive to large sample size that
the null hypothesis would be rejected too easily, so the loose rule is smaller than 5.
Table 12. Model Fit Indices for Measurement Model
Index Criterion Results Absolute indices
χ
2/df <5 3.75
AGFI >0.8 0.87
RMSEA <0.08 0.068
SRMR <0.1 0.06
Comparative indices
NFI >0.9 0.93
NNFI >0.9 0.94
IFI >0.9 0.95
CFI >0.9 0.95
Parsimonious indices
PNFI >0.5 0.81
PGFI >0.5 0.71
Table 13. Convergent Validity Assessment
Item Factor
loading
t-value CR
Perceived Attributes of Innovation(PAI) 0.757
RRA 0.70 17.83***
CCO 0.55 13.15***
IIM 0.56 13.36***
EEU 0.62 15.20***
VVI 0.57 13.84***
TTR 0.50 11.93***
Normative Social Influence(NSI) 0.855
NS4 0.66 17.51***
NS5 0.78 22.03***
NS6 0.83 24.27***
NS7 0.82 23.79***
NS8 0.79 22.19***
Informational Social Influence(ISI) 0.880
IS1 0.63 16.60***
IS2 0.80 22.96***
IS3 0.90 27.27***
IS4 0.87 22.19***
Perceived Risk(RISK) 0.738
FIRISK 0.60 13.94***
SORISK 0.50 11.39***
PERISK 0.67 15.85***
PSRISK 0.72 17.12***
PHRISK 0.50 11.45***
Use Intention(UI) 0.870
UI1 0.87 25.57***
UI2 0.93 27.96***
UI3 0.68 18.17***
Note. ***p < .001.
___________________________________________________________________________________
1
∑
∑
∑
=
=
=
⎟⎟ +
⎠
⎜⎜ ⎞
⎝
⎛
⎟⎟⎠
⎜⎜ ⎞
⎝
⎛
= p
i i p
i i
p
i i
CR
1 2
1 2
1
ε λ
λ
See Fornell and Larcker (1981), p is the number of items for each construct; λ is factor loading; ε is
Discriminate Validity
Discriminate Validity was the extent to which the measures of two constructs
were not correlated thoroughly (Reichardt & Coleman, 1995) and it was assessed
using the criteria recommended by Fornell and Larcker (1981). The square root of the
AVE1 should exceed the correlation shared between and the construct and other
construct in the model (See Table 14).
Table 14. Discriminate Validity Assessment through AVE
PAI NNS IIS RISK UI
PAI 0.586
NNS 0.23 0.780
IIS 0.16 0.22 0.806
RISK -0.46 -0.72 -0.40 0.604
UI 0.32 0.60 0.33 -0.52 0.833
Note. The diagonal elements are square roots AVE of constructs and the off-diagonal elements are the correlations between pairs of different constructs.
___________________________________________________________________________________
2
∑ ∑
∑
= =
=
+
= p
i
p i
i i
p i
i
AVE
1 1
2 1
2
ε λ
λ
See Fornell and Larcker (1981), p is the number of items for each construct; λ is factor loading; ε is measurement error.
4.3. Structural Model
To tests for moderator effects were conducted as follows. First, innovativeness
was divided into earlier adopter and later adopter group, using the method mentioned
chapter 3. Sizes for adopter category are shown in Table 15.
Table 15. Sizes of adopter category
Adopter category Frequency (%) Earlier adopter 99 (14.12%)
Later adopter 503 (71.15%) Laggard 99 (14.12%)
Second, two model compared tests were conducted for each variable suggested
by Pratibha and Richard (2002). Model A had all factor loadings constrained across
the groups, and error variances of the items for endogenous variables were also
constrained. Model B had the factor loading free but error variances constrained.
Because we have already controlled the error terms, if Models A and B are different
from each other, this difference would be caused by factor loadings. Besides, if the χ2
difference between these two models divided by the change in degrees of freedom is
significant (Δχ2/Δdf > 3.84), then there are significant moderator effects across earlier
adopters and later adopters. The results for these hypotheses and changes in
standardized β and γ coefficients are presented in Table 16 and Table 17. It is seen that
a majority of the moderator hypotheses are supported.
Table 16. Structural Equations Results for Moderator Effects Models Moderator
Variable
Model χ
2df GFI RMSEA SRMR NFI NNFI IFI PNFI Δχ
2/Δdf p value
Adopter Category
A 910.35 451 0.92 0.058 0.043 0.93 0.96 0.96 0.83 8.79 0.003**
B 875.19 447 0.92 0.042 0.042 0.93 0.96 0.97 0.82
Criterion N/A N/A >0.9 <0.08 <0.1 >0.9 >0.9 >0.9 >0.5 >3.84 <0.01
Note: **p<0.01Table 17.
Change in Standardized Path Coefficient Adopter Category
Earlier adopter Later Adopter
Path significant
PAIÆRISK -0.69 -0.15 S**
NSIÆRISK -0.00 -0.68 S**
ISIÆRISK -0.22 -0.16 S*
RISKÆUI -0.20 -0.92 S**
Note: S** = support (change is in correct direction and ), S* = support (change is in correct direction and ).
4.4. Discussion
This research explored why people are adopting innovation and what factors help
earlier adopters and later adopters reduce perceived risk. Our results supported the
expected hypotheses.
Figure 3. Hypotheses Model
In Figure2 supportive findings for H1, H2, and H3 suggest negative association.
Perceived attributes of innovation and social influences have negatively associated
with perceived risk. Perceived risk has negatively associated with use intention.
Additionally, there is a significant moderating effect in our research model.
Finding for H4 (βearlier adopter =-0.20,
ns; β
later adopter =-0.92,p<0.01), suggest that later
adopters have more perceived risk than earlier adopters do. The two groups have
different perceived risk. Therefore, the factors of reducing their perceived risk are
totally different.
First, findings for H5 (γearlier adopter=-0.69,
p <0.01; γ
later adopter=-0.15,ns),
compared to later adopters, the relationship between perceived attributes of
innovation and perceived risk is stronger for earlier adopters. Moreover, finding for
H6 (γearlier adopter=-0.00, ns; γlater adopter=-0.68, p<0.01), compared to earlier adopters, the
relationship between informational social influence and perceived risk is stronger for
later adopters. Finally, finding for H7 (γearlier adopter=-0.22,
ns, p=0.085; γ
lateradopter=-0.16,
p<0.05), compared to later adopters, the relationship between
informational social influence and perceived risk is slightly stronger for earlier
adopters. In addition, the p value of γearlier adopter is 0.085 nearly to 0.05. Therefore,
earlier adopters are also influenced by informational influence more strongly than
later adopters.
The results provide us two implications. First, the major way to help reduce the
perceived risk of earlier adopter is to consider perceived attributes of innovation,
followed by informational social influence. Second, the key to helping later adopter
reduce their perceived risk is to consider normative social influence, followed by
informational social influence, and perceived attributes of innovation.
5. Conclusion
5.1. Managerial Implications
For marketing managers, this research provides a theoretical understanding and
the following marketing strategies.
1) Consumers often perceive uncertainty (perceived risk) when they adopt an
innovation. Therefore, marketing managers should help them reduce perceived
risk. Once they rate the perceived risk as low, they will adopt the innovation.
2) Marketing managers should plan different marketing strategies for earlier adopters
and later adopters, such as audience segmentation (Rogers, 2005). They should
also promote the novelty features of an innovation via mass media in the early
stage of a product’s life cycle in order to attract earlier adopters who seek
information about innovations more actively that later adopters (Rogers, 2005).
After that, the marketing manager should build solid relationships with earlier
adopters, and encourage them become opinion leaders in their group.
3) To attract later adopters, marketing managers should promote their products via
interpersonal influences because later adopters, who have less knowledge about an
innovation, rate uncertainty and risk. The marketing manager should use
interpersonal influences such as opinion leaders, friends, and family to help
reduce later adopters’ perceived risk.
4) In terms of innovations, our results suggest that “ease of use” and “relative
advantage” are the major concerns of users. Therefore, marketing managers
should consider these aspects when they provide input during a product’s design..
5.2. Future Research Direction
A number of issue remain to be addressed in future research.
1) Adopter category in our research was combined into two groups, namely earlier
adopter and later adopter. In future research, other applications can be explored
what factors affect four groups to adopt an innovation and make more detail
marketing strategies for the four groups.
2) Recently, E-WOM (Electronic Word Of Mouth) has become more popular. WOM
often takes the form of objective product information in addition to subjective
personal opinions and experiences in an informal way (Arndt, 1967). In
blogosphere, it is called E-WOM, which is a kind of social influence. In future
research, other applications could incorporate this factor into the conceptual
model.
5.3. Limitation
Our work is subject to a number of limitations as follows.
1) The results of our research were based on cross-sectional data. However, it should
be longitudinal study to examine technological factors and social factors in
different time periods and make comparisons. Thus, the results and conclusion
could provide more marketing strategies to marketing managers.
2) This study asked internet users as respondents to answer an online survey. Thus,
the sample may not match the profile of the population because the sample was
self-selected.
3) A Taiwan-based sample was adopted in this study and might not be generalized to
users in other cultures or countries.
4) The research model of this study has investigated the respondents’ self-reported
behavior patterns. Therefore, social desirable and bias may occur.
References
Arndt, J. (1967). Role of product-related conversations in the diffusion of a new product. Journal of Marketing Research, Ⅳ, 291-294.
Asch, S. E. (1955). Opinions and Social Pressure. Scientific American, 193(5), 31-35.
Bass, F. M. (1969). A New Product Growth for Model Consumer Durables.
Management Science, 15(5), 215-227.
Bagozzi, R. P., & Yi, Y. (1988). On the evaluation of structural equation models.
Journal of the Academy of Marketing Science, 16(1), 74-94
Bearden, W. O. (1982). Reference Group Influence on Product and Brand Purchase Decisions. Journal of Consumer Research, 9, 183-194.
Bearden, W. O., Netemeyer, R. G., & Teel, J. E. (1989). Measurement of Consumer Susceptibility to Interpersonal Influence. Journal of Consumer Research, 15, 473-481.
Bentler, P. M., Bonett, D. G. (1980). Significance tests and goodness-of-fit in the analysis of covariance structures. Psychological Bulletin, 88(3), 588-606.
Bentler, P. M. (1995). EQS: Strctural equations program manaual. Encino, CA:
Multivairate Software.
Bruce, G. D., & Witt, R. E. (1970). Personality Correlates of Innovative Buying Behavior. Journal of Marketing Research, 12, 259-260.
Burnkrant, R. E., & Cousineau, A. (1975). Informational and Normative Social Influence in Buyer Behavior. Journal of Consumer Research, 2, 206-215.
Clark, R. A., & Goldsmith, R. E. (2006). Global Innovativeness and Consumer Susceptibility to Interpersonal Influence. Journal of Marketing Theory and
Practice, 14(4), 275-285.
Conchar, M. P., Zinkhan, G. M., Peters, C., & Olavarrieta, S. (2004). An Integrated Framework for the Conceptualization of Consumers’ Perceived-Risk Processing.
Journal of the Academy of Marketing Science, 32(4), 418-436.
Cronbach, L. J. (1951). Coefficient alpha and the internal structure of tests.
Psychometnka, 16(3), 297-334
Datamonitor 2007. DFC Intelligence, from http://www.dfcint.com/index.php
Davis, F. D. (1989). Perceived Usefulness, Perceived Ease of Use, and User Acceptance of Information Technology. MIS Quarterly, 13(3), 319-340.
Davis, F. D., Bagozzi, R. P., & Warshaw, P. R. (1992). Extrinsic and Intrinsic Motivation to Use Computers in the Workplace. Journal of Applied Social
Psychology, 22(4), 1111-1132.
Desurvire, H., Caplan, M., & Jozsef, A.T. (2004). Using Heuristics to Evaluate the Playability of Games. Computer Human Interaction. 24-29.
Deutsch, M., & Gerard, H. B. (1955). A Study of Normative and Informational Social Influences upon Individual Judgement. Journal of Abnormal and Social
Psychology, 51, 624-636.
Dowling, G. R., & Staelin, R. (1994). A Model of Perceived Risk and Intended Risk-Handling Activity.
Journal of Consumer Research, 21(1), 119-134.
Engel James E, Blackwell Roger D, Kegerreis Robert J. (1969). How information is used to adopt an innovation. Journal of Advertising Research, 9(4), 3–8.
Flynn, L. R., & Goldsmith, R. E. (1993). A Validation of the Goldsmith and Hofacker Innovativeness Scale. Educational and Psychological Measurement, 53(4), 1105-1116.
Gefen, D., Straub, D., & Boudreau, M. (2000). Structural equation modeling and regression: Guidelines for research practice. Comm. AIS, 7(7)1-78.
Geoffrey C. K., & Roger A. L., (1981). Dimensions of Consumer Information Seeking Behavior. Journal of Marketing Research, 18(2), 233-239.
Goldsmith, R. E.& Hofacker, C. F., (1991). Measuring Consumer Innovativeness.
Journal of the Academy of Marketing Science, 19(3), 209-221.
Goldsmith, R. E.& Flynn, L. R., (1992). Identifying Innovators in Consumer Product Markets. European Journal of Marketing, 26(12), 42-55.
Hair, J. F., Anderson, R. E., Tatham R. L., & Black, W. C. (1998). Multivairate Data Analysis with Readings (5th ed). Prentice Hall, Englewood Cliffs, NJ.
Hirschman, E.C. (1980). Innovativeness, novelty seeking, and consumer creativity.
Journal of Consumer Research, 7(3), 283-295.
Hirunyawipada, T. & Paswan, A. K. (2006). Consumer innovativeness and perceived risk: implications for high technology product adoption. Journal of consumer
Marketing, 23(4), 182-198.
Holak, S. L., & Lehmann, D. R. (1990). Purchase Intentions and the Dimensions of Innovation: An Exploratory Model. Journal of Product Innovation Management,
7(1), 59-73.
Hsu, C. L., Lu, H. P., & Hsu, H. H. (2007). Adoption of the mobile internet: an empirical study of multimedia message service(MMS), OMEGA, 35(6),715-726.
Hu, L., & Bentler, P. M. (1999). Cutoff criteria for fit indexes in covariance structure analysis: conventional criteria versus new alternatives. Structural
Equation Modeling, 6(1), 1-55
Hurt, H. T., & Joseph, K. (1977). Scales for the Measurement of Innovativeness.
Human Communication Research, 4(1), 58-65.
Im, S., Bayus, B. L., & Mason, C. H. (2003). An Empirical Study of Innate Consumer
Innovativeness, Personal Characteristics, and New-Product Adoption Behavior.
Journal of the Academy of Marketing Science, 31(1), 61-73.
Jacoby, J. (1971). Personality and Innovation Proneness. Journal of Marketing
Research, 13, 244-247.
Jacoby, J., & Kaplan, K. B. (1972). The Components of Perceived Risk, Proceedings of the Third Annual Conference of the Association for Consumer Research, 382-393.
John, Y., & Ding, Y. (2002). HCI and Game Design: From a practitioner’s point of
View, from http://www.ye-brothers.com/documents/HCIGAMEDESIGN.pdf
Joreskog, K. G. (1970). A general method for analysis of covariance structures.Biometrika, 57(2), 239-251
Karahanna, E., Straub, D. W., & Chervany, N. L. (1999). Information Technology Adoption Across Time: Cross-Sectional Comparison of Pre-Adoption and Post-Adoption Beliefs. MIS Quarterly, 23(2), 183-213.
Kelman, H. C. (1958). Compliance, Identification, and Internalization: Three Processes of Attitude Change. Journal of Conflict Resolution, 2(1), 51-60.
Kelman, H. C. (1961). Processes of Opinion Change. The Public Opinion Quarterly,
25(1), 57-78.
Kuhlthau, C.C. (1993). A principle of uncertainty for information seeking. Journal of
Documentation, 49(4), 339–355.
Labay, D. G., & Kinnear, T. C. (1981). Exploring the Consumer Decision Process in the Adoption of Solar Energy Systems. Journal of Consumer Research, 8(3), 271-278.
Lewins, W., Agarwal, R., & Sambamurthy, V. (2003). Sources of Influence on Beliefs about Information Technology Use: An Empirical Study of Knowledge Workers.
MIS Quarterly, 27(4), 657-678.
Lutz, R. J., & Reilly, P. J. (1974). An Exploration of the Effects of Perceived Social and Performance Risk on Consumer Information Acquisition. Advances in
Consumer Research, 393-405.
Malhotra, N. K. (1993), Marketing Research-An Applied Orientation. Prentice-Hall, Englewood Cliffs, NJ.
Manning, K. C., Bearden, W. O., & Madden, T. J. (1995). Consumer Innovativeness and the Adoption Process. Journal of Consumer Psychology, 4(4), 329-345.
Midgley, D. F., & Dowling, G. R. (1978). Innovativeness: The Concept and Its Measurement. Journal of consumer research, 4, 229-242.
Moore, G. A. (1999). Crossing the Chasm. New York: HarperCollins.
Moore, G. C., & Benbasat, I. (1990). Development of an Instrument to Measure the Perceptions of Adopting an Information Technology Innovation. Information