YEARBOOK OF
EARNINGS AND PRODUCTIVITY STATISTICS REPUBLIC OF CHINA, 2015
ၗ ਔ ය Ǻ ύ ҇ ୯ 104 ԃ
Ά ीྗǺҁൔୖྣȨύ҇୯Չྗϩᜪಃΐԛঅ
ुހȩϷȨ100 ԃπϷ୍ܺදी่݀ȩ ਠ҅ᐕԃਔ໔ኧӈၗǴ࣬ᜢࡰኧၗׯа 100 ԃࣁ୷යǶ
Άᆛ! ! ֟Ǻhttp://www.stat.gov.tw ɧЬीᕴೀीɧᖒ ၗϷғౢΚी
Չ ࡹ ଣ Ь ी ᕴ ೀ ύ҇୯ 105 ԃ 5 Дጓӑ
DIRECTORATE-GENERAL OF BUDGET, ACCOUNTING AND STATISTICS, EXECUTIVE YUAN, REPUBLIC OF CHINA, MAY 2016
тයᓎǺԃ ൔ
рހᐒᜢǺՉ ࡹ ଣ Ь ी ᕴ ೀ
Ӧ֟Ǻᆵ ч ѱ ύ ҅ ቶ Ԁ ຉ 2 ဦ
ႝ၉Ǻ( 0 2 ) 2 3 8 0 - 3 6 2 7
! ! ! ! 0 8 0 0 0 0 7 5 8 9 - 1 5 ᆛ֟Ǻh t t p : / / w w w . d g b a s . g o v . t w ӑ ڇ ޣǺࣽ ᛬ ற Յ ᇙ ހ ӑ ڇ Ԗ ज़ Ϧ љ
Ӧ֟Ǻᆵчѱεຉ 157 ဦΟኴϐ 2
ႝ၉Ǻ( 0 2 ) 2 3 0 2 - 0 4 0 6 ጓ ޣǺՉ ࡹ ଣ Ь ी ᕴ ೀ рހԃДǺύ ҇ ୯ 1 0 5 ԃ 5 Д
ബтԃДǺύ ҇ ୯ 7 7 ԃ 5 Д
ۓ ሽǺཥ ᆵ ჾ 2 9 0 ϡ
୧ ೀǺ ύ ୯ ी Ꮲ ޗ
Ӧ֟Ǻᆵ ч ѱ ύ ҅ ቶ Ԁ ຉ 2 ဦ!
ႝ၉Ǻ( 0 2 ) 2 3 8 0 - 3 6 5 6!
ແ ࡹ Ⴤ ኘ ဦ 0 0 0 4 1 3 0 - 8
! ! ! ! ϖ ࠄ Ў ϯ ቶ
Ӧ֟Ǻᆵ ύ ѱ ύ ύ ξ ၡ 6 ဦ
ႝ၉Ǻ( 0 4 ) 2 2 2 6 - 0 3 3 0 ϖࠄᆛၡਜ۫Ǻ http://www.wunanbooks.com.tw
! ! ! ! ୯ ৎ ਜ ۫ ݊ Ԣ ߐ ѱ Ӧ֟Ǻᆵчѱύξ݊Ԣၡ 209 ဦ 1 ኴ
ႝ၉Ǻ( 0 2 ) 2 5 1 8 - 0 2 0 7 ୯ৎᆛၡਜ۫Ǻ http://www.govbooks.com.tw
ҁբ௦ബҔ CCȨۉӜҢɡߚ܄ȩచීѠ 2.5 ހញрǴज़ ܭҢբΓۉӜϷߚᔼճ܄ҞޑϐచҹΠǴளճҔҁբǶ
GPN: 2007700004
ISSN: 1 0 1 8 - 1 6 9 5
I
ගाϩ ...-1-
ӚڙႿπᖒၗፓी߄ ᖒၗᆶғౢΚीख़ाࡰኧ... 2
̅ǵڙႿπΓኧ 1. ᐕԃӚڙႿπΓኧɡᕴी... 6
1. ᐕԃӚڙႿπΓኧɡᙍȐᅱ࿎ϷמΓȑ Ȑុˡȑ... 14
1. ᐕԃӚڙႿπΓኧɡπȐߚᅱ࿎מΓȑ Ȑុ˥ȑ... 22
2. ᐕԃᇙڙႿπΓኧɡᕴी... 30
2. ᐕԃᇙڙႿπΓኧɡᙍȐុˣȑ... 42
2. ᐕԃᇙڙႿπΓኧɡπȐុ˞˟ȑ... 54
3. πϷ୍ܺڙႿπΓኧɡࡪߐձϩ... 66
4. Ϸβҡ௦ڗڙႿπΓኧɡࡪύձϩ... 66
5. ᇙڙႿπΓኧɡࡪύձϩ... 68
6. ႝΚϷᐯٮᔈڙႿπΓኧɡࡪύձϩ... 72
7. ҔНٮᔈϷԦࢉݯڙႿπΓኧɡࡪύձϩ... 72
8. ᔼڙႿπΓኧɡࡪύձϩ... 74
9. ץวϷ႟୧ڙႿπΓኧɡࡪύձϩ... 74
10. ၮᒡϷঊᓯڙႿπΓኧɡࡪύձϩ... 76
11. ՐஎϷᓓڙႿπΓኧɡࡪύձϩ... 78
12. ၗૻϷ೯ૻኞڙႿπΓኧɡࡪύձϩ... 78
13. ߎᑼϷߥᓀǵόౢڙႿπΓኧɡࡪύձϩ... 80
14. ǵࣽᏢϷמೌ୍ܺڙႿπΓኧɡࡪύձϩ... 82
15. Ѝජ୍ܺǵ௲ػ୍ܺڙႿπΓኧɡࡪύձϩ... 84
16. ᙴᕍߥ଼୍ܺǵ᛬ೌুϷҶ໕୍ܺڙႿπΓኧɡࡪύձϩ... 86
17. ځд୍ܺڙႿπΓኧɡࡪύձϩ... 86
̅̅ǵᖒၗ 18. ᐕԃӚڙႿπΓДᖒၗɡᕴी... 88
18. ᐕԃӚڙႿπΓДᖒၗɡᙍȐᅱ࿎ϷמΓȑ Ȑុˡȑ... 96
18. ᐕԃӚڙႿπΓДᖒၗɡπȐߚᅱ࿎מΓȑ Ȑុ˥ȑ... 104
II
19. ᐕԃӚڙႿπΓДத܄ᖒၗ... 112
20. ᐕԃᇙڙႿπΓДᖒၗɡᕴी... 120
20. ᐕԃᇙڙႿπΓДᖒၗɡᙍȐុˣȑ... 132
20. ᐕԃᇙڙႿπΓДᖒၗɡπȐុ˞˟ȑ... 144
21. πϷ୍ܺڙႿπΓДᖒၗɡࡪߐձϩ... 156
22. Ϸβҡ௦ڗڙႿπΓДᖒၗɡࡪύձϩ... 156
23. ᇙڙႿπΓДᖒၗɡࡪύձϩ... 158
24. ႝΚϷᐯٮᔈڙႿπΓДᖒၗɡࡪύձϩ... 162
25. ҔНٮᔈϷԦࢉݯڙႿπΓДᖒၗɡࡪύձϩ... 162
26. ᔼڙႿπΓДᖒၗɡࡪύձϩ... 164
27. ץวϷ႟୧ڙႿπΓДᖒၗɡࡪύձϩ... 164
28. ၮᒡϷঊᓯڙႿπΓДᖒၗɡࡪύձϩ... 166
29. ՐஎϷᓓڙႿπΓДᖒၗɡࡪύձϩ... 168
30. ၗૻϷ೯ૻኞڙႿπΓДᖒၗɡࡪύձϩ... 168
31. ߎᑼϷߥᓀǵόౢڙႿπΓДᖒၗɡࡪύձϩ... 170
32. ǵࣽᏢϷמೌ୍ܺڙႿπΓДᖒၗɡࡪύձϩ... 172
33. Ѝජ୍ܺǵ௲ػ୍ܺڙႿπΓДᖒၗɡࡪύձϩ... 174
34. ᙴᕍߥ଼୍ܺǵ᛬ೌুϷҶ໕୍ܺڙႿπΓДᖒၗɡࡪύձϩ... 176
35. ځд୍ܺڙႿπΓДᖒၗɡࡪύձϩ... 176
̅̅̅ǵπਔ 36. ᐕԃӚڙႿπΓДѳ֡πբਔኧɡᕴी... 178
36. ᐕԃӚڙႿπΓДѳ֡πբਔኧɡ҅தπਔȐុˡȑ... 186
36. ᐕԃӚڙႿπΓДѳ֡πբਔኧɡуπਔȐុ˥ȑ... 194
37. ᐕԃᇙڙႿπΓДѳ֡πբਔኧɡᕴी... 202
37. ᐕԃᇙڙႿπΓДѳ֡πբਔኧɡ҅தπਔȐុˣȑ... 214
37. ᐕԃᇙڙႿπΓДѳ֡πբਔኧɡуπਔȐុ˞˟ȑ... 226
38. πϷ୍ܺڙႿπΓДѳ֡πբਔኧɡࡪߐձϩ... 238
39. Ϸβҡ௦ڗڙႿπΓДѳ֡πբਔኧɡࡪύձϩ... 238
40. ᇙڙႿπΓДѳ֡πբਔኧɡࡪύձϩ... 239
41. ႝΚϷᐯٮᔈڙႿπΓДѳ֡πբਔኧɡࡪύձϩ... 242
42. ҔНٮᔈϷԦࢉݯڙႿπΓДѳ֡πբਔኧɡࡪύձϩ... 242
43. ᔼڙႿπΓДѳ֡πբਔኧɡࡪύձϩ... 243
III
46. ՐஎϷᓓڙႿπΓДѳ֡πբਔኧɡࡪύձϩ... 245
47. ၗૻϷ೯ૻኞڙႿπΓДѳ֡πբਔኧɡࡪύձϩ... 245
48. ߎᑼϷߥᓀǵόౢڙႿπΓДѳ֡πբਔኧɡࡪύձϩ... 246
49. ǵࣽᏢϷמೌ୍ܺڙႿπΓДѳ֡πբਔኧɡࡪύձϩ... 247
50. Ѝජ୍ܺǵ௲ػ୍ܺڙႿπΓДѳ֡πբਔኧɡࡪύձϩ...248
51. ᙴᕍߥ଼୍ܺǵ᛬ೌুϷҶ໕୍ܺڙႿπΓДѳ֡πբਔኧ ɡࡪύձϩ... 249
52. ځд୍ܺڙႿπΓДѳ֡πբਔኧɡࡪύձϩ... 249
̅̒ǵπଏ 53. ᐕԃӚڙႿπଏϷࢬ... 250
54. ᐕԃᇙڙႿπଏϷࢬ... 256
55. ӚڙႿπଏɡࡪύձϩ... 268
̒ǵമғౢΚ 56. ᐕԃπߐڙႿޣമғౢΚࡰኧ... 276
57. ᐕԃπߐڙႿޣൂՏౢрമԋҁࡰኧ... 277
58. ᐕԃᇙڙႿޣമғౢΚࡰኧ... 278
59. ᐕԃᇙڙႿޣൂՏౢрമԋҁࡰኧ... 284
̒̅ǵۑፓၗ 60. ᐕԃӚڙႿπΓኧۑፓ่݀... 290
61. ᐕԃӚڙႿπΓДѳ֡ᖒၗۑፓ่݀... 294
62. ᐕԃӚڙႿπΓДѳ֡πբਔኧۑፓ่݀... 298
63. ᐕԃӚڙႿπଏۑፓ่݀... 302
̒̅̅ǵ୯ሞी 64. Ьा୯ৎπϷ୍ܺДǵຼǵВǵਔᖒ... 308
65. Ьा୯ৎᇙڙႿࡰኧ... 309
66. Ьा୯ৎᇙຼπբਔኧ... 310
67. Ьा୯ৎᇙᖒၗ... 312
68. Ьा୯ৎᇙമғౢΚࡰኧ... 314
܄ձीϩ ... 316
ߕᒵ ... 330
IV
CONTENTS
Preface
Summary Analysis ... -8- Statistical Table
Indexes of Earnings and Productivity Statistics... 2 I. Employees
1. Employees on Payrolls of Establishments by Industry - Total... 6 1. Employees on Payrolls of Establishments by Industry - Salaried Workers
(Supervisory & Technical Employees) (Cont. 4)... 14 1. Employees on Payrolls of Establishments by Industry - Wage Earners
(Nonsupervisory Employees) (Cont. 8)... 22 2. Employees on Payrolls of Manufacturing Establishments - Total... 30 2. Employees on Payrolls of Manufacturing Establishments - Salaried Workers
(Cont. 6)... 42 2. Employees on Payrolls of Manufacturing Establishments - Wage Earners
(Cont. 12)... 54 3. Employees on Payrolls of Industry & Services Establishments by Division
Industry... 66 4. Employees on Payrolls of Mining & Quarrying Establishments by Division
Industry... 66 5. Employees on Payrolls of Manufacturing Establishments by Division Industry... 68 6. Employees on Payrolls of Electricity & Gas Supply Establishments by Division
Industry... 72 7. Employees on Payrolls of Water Supply & Remediation Activities Establishments
by Division Industry... 72 8. Employees on Payrolls of Construction Establishments by Division Industry... 74 9. Employees on Payrolls of Wholesale & Retail Trade Establishments by Division
Industry... 74 10. Employees on Payrolls of Transportation & Storage Establishments by Division
Industry... 76 11. Employees on Payrolls of Accommodation & Food Service Activities
Establishments by Division Industry... 78
V
Establishments by Division Industry... 80 14. Employees on Payrolls of Professional, Scientific & Technical Activities
Establishments by Division Industry... 82 15. Employees on Payrolls of Support Service Activities, Education Establishments by
Division Industry... 84 16. Employees on Payrolls of Human Health Activities, Arts, Entertainment &
Recreation Establishments by Division Industry... 86 17. Employees on Payrolls of Other Service Activities Establishments by Division
Industry... 86 II. Earnings
18. Average Monthly Earnings of Employees on Payrolls of Establishments by
Industry - Total... 88 18. Average Monthly Earnings of Employees on Payrolls of Establishments by
Industry - Salaried Workers (Supervisory & Technical Employees)(Cont. 4)... 96 18. Average Monthly Earnings of Employees on Payrolls of Establishments by
Industry - Wage Earners (Nonsupervisory Employees) (Cont. 8)... 104 19. Average Monthly Regular Earnings of Employees on Payrolls of Establishments
by Industry... 112 20. Average Monthly Earnings of Employees on Payrolls of Manufacturing
Establishments by Industry - Total... 120 20. Average Monthly Earnings of Employees on Payrolls of Manufacturing
Establishments by Industry - Salaried Workers (Cont. 6)... 132 20. Average Monthly Earnings of Employees on Payrolls of Manufacturing
Establishments by Industry - Wage Earners (Cont. 12)...144 21. Average Monthly Earnings of Employees on Payrolls of Industry & Services
Establishments by Division Industry... 156 22. Average Monthly Earnings of Employees on Payrolls of Mining & Quarrying
Establishments by Division Industry... 156 23. Average Monthly Earnings of Employees on Payrolls of Manufacturing
Establishments by Division Industry... 158
VI
24. Average Monthly Earnings of Employees on Payrolls of Electricity & Gas Supply Establishments by Division Industry... 162 25. Average Monthly Earnings of Employees on Payrolls of Water Supply &
Remediation Activities Establishments by Division Industry...162 26. Average Monthly Earnings of Employees on Payrolls of Construction
Establishments by Division Industry... 164 27. Average Monthly Earnings of Employees on Payrolls of Wholesale & Retail Trade
Establishments by Division Industry... 164 28. Average Monthly Earnings of Employees on Payrolls of Transportation & Storage
Establishments by Division Industry... 166 29. Average Monthly Earnings of Employees on Payrolls of Accommodation & Food
Service Activities Establishments by Division Industry... 168 30. Average Monthly Earnings of Employees on Payrolls of Information &
Communication Establishments by Division Industry... 168 31. Average Monthly Earnings of Employees on Payrolls of Financial & Insurance
Activities, Real Estate Activities Establishments by Division Industry... 170 32. Average Monthly Earnings of Employees on Payrolls of Professional, Scientific &
Technical Activities Establishments by Division Industry... 172 33. Average Monthly Earnings of Employees on Payrolls of Support Service Activities,
Education Establishments by Division Industry... 174 34. Average Monthly Earnings of Employees on Payrolls of Human Health Activities,
Arts, Entertainment & Recreation Establishments by Division Industry... 176 35. Average Monthly Earnings of Employees on Payrolls of Others Service Activities
Establishments by Division Industry... 176 III. Working Hours
36. Average Monthly Working Hours of Employees on Payrolls of Establishments by Industry - Total... 178 36. Average Monthly Working Hours of Employees on Payrolls of Establishments by
Industry - Regular Time (Cont. 4)... 186 36. Average Monthly Working Hours of Employees on Payrolls of Establishments by
Industry - Overtime (Cont. 8)... 194 37. Average Monthly Working Hours of Employees on Payrolls of Manufacturing
Establishments by Industry - Total... 202
VII
Establishments by Industry - Overtime (Cont. 12)... 226 38. Average Monthly Working Hours of Employees on Payrolls of Industry & Services
Establishments by Division Industry... 238 39. Average Monthly Working Hours of Employees on Payrolls of Mining &
Quarrying Establishments by Division Industry... 238 40. Average Monthly Working Hours of Employees on Payrolls of Manufacturing
Establishments by Division Industry ... 239 41. Average Monthly Working Hours of Employees on Payrolls of Electricity & Gas
Supply Establishments by Division Industry... 242 42. Average Monthly Working Hours of Employees on Payrolls of Water Supply &
Remediation Activities Establishments by Division Industry... 242 43. Average Monthly Working Hours of Employees on Payrolls of Construction
Establishments by Division Industry... 243 44. Average Monthly Working Hours of Employees on Payrolls of Wholesale & Retail
Trade Establishments by Division Industry... 243 45. Average Monthly Working Hours of Employees on Payrolls of Transportation &
Storage Establishments by Division Industry... 244 46. Average Monthly Working Hours of Employees on Payrolls of Accommodation &
Food Service Activities Establishments by Division Industry...245 47. Average Monthly Working Hours of Employees on Payrolls of Information &
Communication Establishments by Division Industry... 245 48. Average Monthly Working Hours of Employees on Payrolls of Financial &
Insurance Activities, Real Estate Activities Establishments by Division Industry... 246 49. Average Monthly Working Hours of Employees on Payrolls of Professional,
Scientific & Technical Activities Establishments by Division Industry... 247 50. Average Monthly Working Hours of Employees on Payrolls of Support Service
Activities, Education Establishments by Division Industry... 248 51. Average Monthly Working Hours of Employees on Payrolls of Human Health
Activities, Arts, Entertainment & Recreation Establishments by Division Industry.... 249 52. Average Monthly Working Hours of Employees on Payrolls of Other Service
Activities Establishments by Division Industry... 249
VIII
IV. Labor Turnover
53. Labor Turnover Rate of Employees on Payrolls of Establishments by Industry... 250
54. Labor Turnover Rates of Employees on Payrolls of Manufacturing Establishments by Industry... 256
55. Labor Turnover Rates of Employees on Payrolls of Establishments by Division Industry... 268
V. Labor Productivity 56. Indexes of Labor Productivity of Employees of Industry Establishments... 276
57. Indexes of Unit Labor Costs of Employees of Industry Establishments... 277
58. Indexes of Labor Productivity of Employees of Manufacturing Establishments... 278
59. Indexes of Unit Labor Costs of Employees of Manufacturing Establishments... 284
VI. Seasonally Adjusted Series 60. Seasonally Adjusted Series of Employees on Payrolls of Establishments by Industry... 290
61. Seasonally Adjusted Series of Average Monthly Earnings of Employees on Payrolls of Establishments by Industry... 294
62. Seasonally Adjusted Series of Average Monthly Working Hours of Employees on Payrolls of Establishments by Industry... 298
63. Seasonally Adjusted Series of Labor Turnover Rates of Employees on Payrolls of Establishments by Industry... 302
VII. International Statistics 64. Earnings Per Hour (H), Per Day (D), Per Week (W), or Per Month (M) in Industry and Services in Major Countries... 308
65. Fixed Indexes of Employment in Manufacturing in Major Countries... 309
66. Working Hours Per Week in Manufacturing in Major Countries... 310
67. Earnings in Manufacturing in Major Countries...312
68. Indexes of Labor Productivity in Manufacturing in Major Countries... 314
Gender Statistics and Analysis... 322
Appendix ... 343
ྗǵπբਔኧϷπଏᡂރݩǴ٠ᆕӝጓᇙғౢΚᡂǴаϷቷ
മԋҁϐቚ෧ݩǶ
ΒǵԃൔጓӑҞޑǺਥᏵၗǴуаጓᇙᆶϩǴаٮΠӈϐҔǶ
ȐȑӚՉΓΚሡݩǺᙖٮࡹ۬ೕჄΓΚၗྍǴෳᔮวǴᙶुΓΚࡹ
ϐሡाǶ
ȐΒȑπᖒၗНྗᡂ༈ǺࣴزፓΓΚٮሡѱǴׯ๓πࡑၶϷπғࢲ ϐୖᏵǶ
ȐΟȑғౢΚߏᖿ༈ǺٮࣁᑽໆౢჹѦᝡݾૈΚǴׯᡂౢ่ᄬᆶගϲᔼၮਏ
ϐ٩ᏵǶ
ΟǵԃൔीጄൎǺх֖Ϸβҡ௦ڗǵᇙǵႝΚϷᐯٮᔈǵҔНٮ ᔈϷԦࢉݯǵᔼǵץวϷ႟୧ǵၮᒡϷঊᓯǵՐஎϷᓓǵၗ
ૻϷ೯ૻኞǵߎᑼϷߥᓀǵόౢǵࣽᏢϷמೌ୍ܺǵЍජܺ
୍ǵ௲ػ୍ܺȐ֖ځд௲ػϷ௲ػᇶշ୍ܺȑǵᙴᕍߥ଼୍ܺǵ᛬
ೌুϷҶ໕୍ܺǵځд୍ܺ 17 εՉǶځচۈၗǴ߯ϩҗӚԖᜢ ЬᆅᐒᜢॄೢൔǴӆҗҁᕴೀᆕӝуаቩਡǵፄǵႝηೀǵ༼ጓᇙ߄ǵ
ࣴزϩၸำǴጓӑԋҁԃൔǶ
ѤǵԃൔӜᆀঅुǺԾύ҇୯ 77 ԃଆǴКྣДൔӜᆀǴஒচጓȨύ҇୯മπ
ीԃൔȩ٩ځϣϩձጓӑࣁȨᖒၗᆶғౢΚीԃൔȩϷȨΓΚၗྍፓ
ीԃൔȩٿᅿǴ٠ׯаၗЬᡏԃҽࣁॊٿᅿԃൔϐԃձӜᆀǶ ϖǵၗጓ௨ᡏٯǺ
Ȑȑҁԃൔၗаύ҇୯ 104 ԃࣁЬǴࣁߡܭਔ໔ኧӈϐೱុǴኧӷᅰໆߥ੮ Կύ҇୯ 85 ԃǴځύཥጓीҞҭᅰёૈ٩ᏵԖᜢၗݤሒௗଓྉ
ӈǶ
ȐΒȑी߄ϐ௨ӈǴӃ٩ЬाڙႿπीҞϩᜪࣁ IǵIIǵIII ǴӚᜪύа ӕीǵፓౢғϐၗ่௨ӈࣁচ߾Ƕ
ȐΟȑගाϩᇥܴܭڔ२ǴӚी܈ፓᇥܴǴࡪीҞԛׇύᒠӑǴ ጓᇙБݤᇥܴߕܭڔ҃Ƕ
ȐѤȑी߄܌Ҕ಄ဦཀကӵΠǺ
0! ߄ҢኧӷόϷൂՏ ...! ߄Ңኧӷόܴ
- ߄Ңคኧӷ *! ߄Ңኩኧӷ
1. The source data of the Yearbook: From researching the changes in employees, earnings level, working hours and labor turnover of employees hired by Industry & Services. Combined with productivity statistics series and fluctuations in labor cost of firms.
2. The purpose of the Yearbook:
(1) Industrial manpower demand: Statistics in the Yearbook are important reference for the government in its planning manpower policies.
(2) Earnings level of employees: Statistics on earnings of employees are essential reference data in studying and adjusting manpower market demand and supply, raising earnings of employees, and improving their living conditions.
(3) Fluctuations of productivity: Productivity is a base to measure industrial competitive strength against trading rivals, change industrial structure, and upgrade operational efficiency.
3. The coverage of the Yearbook: The statistics cover 17 major industries: Mining & quarrying, Manufacturing, Electricity & gas supply, Water supply & remediation activities, Construction, Wholesale & retail trade, Transportation & storage, Accommodation & food service activities, Information & communication, Financial & insurance activities, Real estate activities, Professional, scientific & technical activities, Support service activities, Education (only other education and educational support activities included); Human health activities, Arts, entertainment & recreation and Other service activities. The primary survey of industries is managed by various statistic organizations, and finally compiled by the Directorate-General of Budget, Accounting and Statistics (DGBAS), Executive Yuan. All the data are put through a tight procedure of close review, recheck, and electronic computer data processing and are turned into statistical tables for research and analysis. Results are prepared into this Yearbook to be published.
4. The revised name of the Yearbook: Following the Monthly Bulletin from 1988, the YEARBOOK OF LABOR STATISTICS is separated into YEARBOOK OF EARNINGS AND PRODUCTIVITY STATISTICS and YEARBOOK OF MANPOWER SURVEY STATISTICS in accordance with their contents. The year of the main part of data is the year title of these two Yearbooks.
5. The compilation of the Yearbook:
(1) The data mainly contain the statistics in 2015 and for the continuation of time series the figures can be traced as far as back to 1996 while the data of the new items are being revealed precisely in accordance with the estimated past data.
(2) The statistical tables, based on the employees statistics items, are classified into I, II, III, and so on, and in which they are arranged by the principle that the data derive from the same statistics or from the same survey as a group.
(3) The summary analysis is arranged above the order of each item. The directions of statistics or surveys are arranged under the order of each item, which are listed at the end of this Yearbook.
(4) The following symbols are used for tables:
0 less than a unit ... not available
- none * provisional figure
ڙ215ԃΠъԃඳեǴቷҔΓሡ෧ቹៜǴӄԃπϷ୍ܺڙႿ
πΓኧѳ֡ࣁ8496ίΓǴၨ)214*ԃቚу22Γ܈2/62ʘǴቚॶϷቚ൯֡
եܭԃНྗǹऩ൩ڙႿπவ٣Չ่ᄬᢀჸǴπߐڙႿΓኧэ54/96 ʘǴ୍ܺߐэ67/26ʘǶ!
πߐӄԃڙႿπΓኧࣁ434:ίΓǴၨԃቚу43ίΓ܈1/:9ʘǴ ځύаᇙቚу4Γനӭǹ୍ܺߐҭၨԃቚу8:ίΓ܈2/:4ʘǴၲ
5258ίΓǴځύаץวϷ႟୧ᆶՐஎϷᓓǴϩձቚу34ίΓᆶ27ί ΓၨӭǶ!
ᇙڙႿπΓኧѳ֡ࣁ3828ίΓǴၨԃቚу4Γ܈2/22ʘǴځύ аځдᇙቚу4/55ʘۚ२ǴځдၮᒡπڀϷځ႟ҹᇙ3/95ʘԛϐǴᐒఓ
ഢᇙ3/85ʘۚಃΟǶԶΓኧ෧ϿϐձаҡݨϷྡᇙࠔᇙ෧Ͽ3/95ʘ
ۚ२ǴϯᏢᇙࠔᇙ෧Ͽ3/3:ʘԛϐǴԋՊϷܺႬࠔᇙ෧Ͽ2/24ʘۚಃ
ΟǶ!
߄˞! ӚՉڙႿπΓኧ!
ൂՏǺΓ!
!
҇୯!
211ԃ!
҇୯!
212ԃ!
҇୯!
213ԃ!
҇୯!
214ԃ!
҇୯!
215ԃ!
!
ԃቚ)ʘ*!
ᕴ ी!
6 926 177 7 048 865 7 137 983 7 275 399 7 385 427 1.51π ߐ!
3 097 291 3 129 409 3 152 260 3 207 232 3 238 708 0.98 Ϸ β ҡ ௦ ڗ ! 4 176 4 156 3 872 3 908 3 900 -0.20 ᇙ ! 2 593 287 2 619 490 2 635 487 2 686 693 2 716 503 1.11
ႝ Κ Ϸ ᐯ ٮ ᔈ ! 28 608 28 903 29 223 29 111 29 790 2.33 Ҕ Н ٮ ᔈ Ϸ Ԧ ࢉ ݯ ! 26 264 26 759 27 593 27 829 27 833 0.01
ᔼ ! 444 956 450 101 456 085 459 691 460 682 0.22
ܺ ୍ ߐ!
3 828 886 3 919 456 3 985 723 4 068 167 4 146 719 1.93ץ ว Ϸ ႟ ୧ ! 1 530 130 1 571 791 1 591 192 1 617 678 1 640 893 1.44 ၮ ᒡ Ϸ ঊ ᓯ ! 264 487 267 178 272 473 277 176 283 817 2.40 Ր எ Ϸ ᓓ ! 322 845 345 950 359 314 374 362 389 740 4.11
ၗ ૻ Ϸ ೯ ૻ ኞ ! 180 625 183 935 187 145 190 475 195 661 2.72 ߎ ᑼ Ϸ ߥ ᓀ ! 362 432 364 344 365 693 368 904 375 134 1.69
ό ౢ ! 103 225 105 686 110 418 116 738 117 148 0.35
ǵ ࣽ Ꮲ Ϸ מ ೌ ܺ ୍ ! 231 738 237 999 243 169 248 477 253 059 1.84 Ѝ ජ ܺ ୍ ! 322 849 325 308 327 123 336 437 341 552 1.52
௲ ػ ܺ ୍ ! 72 488 72 486 71 956 72 087 73 273 1.65
ᙴ ᕍ ߥ ଼ ܺ ୍ ! 296 816 304 847 316 339 325 692 334 521 2.71
᛬ ೌ ǵ ু Ϸ Ҷ ໕ ܺ ୍ ! 56 701 56 574 56 142 54 986 55 540 1.01
ځ д ܺ ୍ ! 84 550 83 358 84 759 85 155 86 381 1.44
ຏ;௲ػ୍֖ܺȨځд௲ػϷ௲ػᇶշ୍ܺȩǶ!
Βǵᖒၗ!
ɇπϷ୍ܺڙႿπΓДᖒၗၨԃቚу3/63ʘǶ!
215ԃπϷ୍ܺڙႿπΓДᖒၗѳ֡ࣁ59-5:1ϡȐځύДத܄
ᖒၗ49-827ϡǴߚத܄ᖒၗ:-885ϡȑǴၨԃቚу3/63ʘǴЬा߯215ԃ߃ቷ
ቚуวܫԃಖዛߎϷᕮਏዛߎ܌ठǶ!
πߐΓДᖒၗѳ֡ࣁ57-846ϡǴၨԃቚу3/::ʘǴаᇙᖒၗ
ၨԃቚу4/59ʘനଯǴႝΚϷᐯٮᔈቚу3/69ʘԛϐǴᔼቚу1/33ʘۚ
ಃΟǹԶҔНٮᔈϷԦࢉݯᆶϷβҡ௦ڗ߾ϩձ෧Ͽ2/52ʘᆶ2/38ʘǶ!
୍ܺߐΓДᖒၗѳ֡ࣁ5:-972ϡǴၨԃቚу3/25ʘǴନځд୍ܺ
Ϸόౢၨԃϩձ෧Ͽ2/71ʘϷ2/42ʘѦǴځᎩӚ֡ၨԃቚуǴځύ аᙴᕍߥ଼୍ܺቚу5/68ʘനଯǴՐஎϷᓓቚу3/78ʘԛϐǴץวϷ႟୧
ቚу3/51ʘۚಃΟǶ!
!
߄˟! ӚՉڙႿπΓДᖒၗ!
ൂՏǺཥᆵჾϡ!
! ҇୯!
211ԃ!
҇୯!
212ԃ!
҇୯!
213ԃ!
҇୯!
214ԃ!
҇୯!
215ԃ!
!
ԃቚ
)ʘ*!
ᕴ ी!
45 508 45 589 45 664 47 300 48 490 2.52π ߐ!
43 746 44 011 44 076 45 378 46 735 2.99 Ϸ β ҡ ௦ ڗ ! 53 978 52 751 54 871 54 579 53 886 -1.27
ᇙ ! 43 316 43 689 43 829 45 207 46 781 3.48
ႝ Κ Ϸ ᐯ ٮ ᔈ ! 95 382 92 869 88 873 94 022 96 444 2.58 Ҕ Н ٮ ᔈ Ϸ Ԧ ࢉ ݯ ! 45 828 43 680 44 118 44 814 44 183 -1.41
ᔼ ! 42 716 42 683 42 540 43 251 43 346 0.22
ܺ ୍ ߐ!
46 933 46 850 46 921 48 815 49 861 2.14ץ ว Ϸ ႟ ୧ ! 42 562 41 822 42 274 44 422 45 488 2.40
ၮ ᒡ Ϸ ঊ ᓯ ! 50 186 50 196 49 808 50 028 51 219 2.38
Ր எ Ϸ ᓓ ! 29 715 30 107 30 504 31 747 32 596 2.67
ၗ ૻ Ϸ ೯ ૻ ኞ ! 66 291 67 008 65 545 66 316 66 453 0.21
ߎ ᑼ Ϸ ߥ ᓀ ! 76 951 77 989 77 871 83 092 84 696 1.93
ό ౢ ! 41 958 39 588 40 298 42 914 42 351 -1.31
ǵ ࣽ Ꮲ Ϸ מ ೌ ܺ ୍ ! 55 322 56 479 55 507 57 414 58 252 1.46
Ѝ ජ ܺ ୍ ! 33 009 33 635 33 850 34 909 35 671 2.18
௲ ػ ܺ ୍ ! 22 416 22 769 22 922 24 224 24 302 0.32
ᙴ ᕍ ߥ ଼ ܺ ୍ ! 59 900 60 263 59 910 61 300 64 103 4.57
᛬ ೌ ǵ ু Ϸ Ҷ ໕ ܺ ୍ ! 33 236 35 458 36 072 35 829 36 185 0.99
ځ д ܺ ୍ ! 32 526 32 728 33 313 35 086 34 526 -1.60
ຏ;ӕ߄2Ƕ!
ऩ൩ӚύՉᢀჸǴаҡݨϷྡᇙࠔᇙΓДᖒၗѳ֡ࣁ97-757ϡന ଯǴځԛࣁϯᏢᇙ77-35:ϡǴႝη႟ಔҹᇙ6:-::4ϡۚಃΟǶԶᖒ
ၗၨեޣࣣឦമΚஏՉǴ٩ׇࣁЕԮᇙࠔᇙ46-26:ϡǵԋՊϷܺႬࠔᇙ
43-446ϡᆶৎڀᇙϐ43-442ϡǶ!
!
߄ˠ! ᇙڙႿπΓДᖒၗ!
! ! ! ! ! ! ! ! ! ! ! ! ! ! ! ! ! ! ! ҇୯215ԃ! ! ! ! ! !! !! ! ! ൂՏǺཥᆵჾϡ
!! ѳ!!!֡!
!ᙍ!!!!
!π!!!!
!ԃቚ)ʘ*! ԃቚ)ʘ*! ԃቚ)ʘ*!
ᇙ ! 46 781 3.48 60 637 4.96 36 786 1.76
१ ࠔ ᇙ !
38 258 1.05 43 260 0.47 33 551 1.53
Ϸ ᇙ !
55 800 1.80 54 302 2.33 57 197 1.46
ત ᙃ !
38 238 1.31 49 472 2.82 32 027 0.15
ԋ Պ Ϸ ܺ Ⴌ ࠔ ᇙ !
32 335 2.42 43 585 2.96 25 530 1.77
Ҝ ॠ ǵ Л Ҝ Ϸ ځ ᇙ ࠔ ᇙ !40 784 3.64 48 283 5.93 31 131 -2.42
Е Ԯ ᇙ ࠔ ᇙ !
35 159 5.18 40 621 4.99 28 619 4.89
ર ዀ ǵ ર Ϸ ર ᇙ ࠔ ᇙ !
36 460 0.76 41 441 -1.77 34 388 2.04
ӑ ڇ Ϸ ၗ ᓯ Ӹ ൞ ᡏ ፄ ᇙ !36 898 3.59 44 438 4.15 34 563 3.60
ҡ ݨ Ϸ ྡ ᇙ ࠔ ᇙ !86 646 4.75 98 688 5.98 80 078 3.94
ϯ Ꮲ ᇙ !
66 249 1.65 77 674 -2.03 59 935 4.73
ϯ Ꮲ ᇙ ࠔ ᇙ !
54 052 4.52 63 192 2.98 45 357 6.42
ᛰ ࠔ Ϸ ᙴ Ҕ ϯ Ꮲ ᇙ ࠔ ᇙ !
45 879 6.02 52 557 5.31 36 562 5.21
ᐎ ጤ ᇙ ࠔ ᇙ !
41 180 1.71 50 602 0.81 35 902 1.75
༟ ጤ ᇙ ࠔ ᇙ !
38 921 0.34 46 222 0.06 31 855 1.16
ߚ ߎ ឦ ނ ᇙ ࠔ ᇙ !
38 036 -0.88 49 678 -0.74 33 327 -1.01
୷ ҁ ߎ ឦ ᇙ !
54 922 1.11 62 562 1.25 51 960 1.23
ߎ ឦ ᇙ ࠔ ᇙ !
35 676 1.17 44 023 1.20 31 748 1.30
ႝ η ႟ ಔ ҹ ᇙ !
59 993 7.45 78 713 10.08 40 877 2.32
ႝတǵႝηౢࠔϷӀᏢᇙࠔᇙ!
56 556 3.49 70 296 3.82 32 095 0.94
ႝ Κ ഢ ᇙ !
39 675 1.59 56 558 1.81 31 799 1.69
ᐒ ఓ ഢ ᇙ !
39 141 2.29 50 957 3.88 34 459 1.39
ؓ ً Ϸ ځ ႟ ҹ ᇙ !
48 483 0.85 57 631 2.04 40 281 -0.75
ځ д ၮ ᒡ π ڀ Ϸ ځ ႟ ҹ ᇙ !47 044 1.87 61 312 3.84 39 279 0.56
ৎ ڀ ᇙ !
32 331 -0.58 36 785 -1.45 27 946 0.07
ځ д ᇙ !
39 874 5.23 50 307 7.17 29 666 1.81
ౢ Ҕ ᐒ ఓ ഢ ᆢ অ Ϸ Ӽ း !
44 241 5.21 57 368 5.53 38 780 4.57
ɇڙႿπΓДπਔѳ֡ၨ!ԃ෧Ͽ3/7λਔǶ!
215ԃπϷ୍ܺڙႿπΓДπਔѳ֡ࣁ286/4λਔǴၨԃ෧Ͽ 3/7λਔǶπߐπਔѳ֡ၨԃ෧Ͽ4/1λਔǴࣁ291/5λਔǴӚՉ֡ၨ
ԃ෧ϿǴځύаᔼᆶҔНٮᔈϷԦࢉݯϩձ෧Ͽ4/9λਔϷ4/8λਔၨ
ӭǹ୍ܺߐҭၨԃ෧Ͽ3/1λਔǴࣁ282/5λਔǴځύаځд୍ܺ෧Ͽ 4/7λਔനӭǴߎᑼϷߥᓀᆶǵࣽᏢϷמೌ୍ܺ֡෧Ͽ4/4λਔԛϐǶ!
൩ӚύՉᢀჸǴπਔѳ֡ၨߏϐ21ӜՉǴ٩ׇࣁߥӄϷدৎୀ୍ܺ
Ȑ333/3λਔȑǵϦӅًؓ࠼ၮ!)315/7λਔ*!ǵऍᎳϷऍऍᡏȐ311/6λ ਔȑǵતᙃȐ2:2/8λਔȑǵᐎጤᇙࠔᇙȐ29:/:λਔȑǵЕԮᇙࠔᇙ
Ȑ299/:λਔȑǵځдঁΓ୍ܺȐ299/1λਔȑǵરዀǵરϷરᇙࠔᇙȐ298/8 λਔȑǵߚߎឦނᇙࠔᇙȐ296/:λਔȑǵӑڇϷၗᓯӸ൞ᡏፄᇙȐ295/:
λਔȑǶ!
߄ˡ! ӚՉڙႿπΓДπਔѳ֡
!
ൂՏǺλਔ!
! ҇୯!
211ԃ!
҇୯!
212ԃ!
҇୯!
213ԃ!
҇୯!
214ԃ!
҇୯!
215ԃ!
!
ၨԃቚ෧!!
)λਔ*!
ᕴ ी!
178.7 178.4 177.0 177.9 175.3 -2.6π ߐ!
184.0 182.9 182.4 183.4 180.4 -3.0 Ϸ β ҡ ௦ ڗ ! 181.5 182.7 181.6 180.9 178.1 -2.8
ᇙ ! 185.1 183.9 183.9 184.8 181.8 -3.0
ႝ Κ Ϸ ᐯ ٮ ᔈ ! 170.6 176.5 174.6 175.9 174.8 -1.1
Ҕ Н ٮ ᔈ Ϸ Ԧ ࢉ ݯ ! 178.8 178.8 179.0 179.3 175.6 -3.7
ᔼ ! 178.2 178.0 174.9 176.0 172.2 -3.8
ܺ ୍ ߐ!
174.4 174.7 172.7 173.4 171.4 -2.0ץ ว Ϸ ႟ ୧ ! 174.0 173.3 171.5 172.9 170.9 -2.0
ၮ ᒡ Ϸ ঊ ᓯ ! 179.4 181.2 179.1 179.5 178.0 -1.5
Ր எ Ϸ ᓓ ! 169.0 171.2 169.9 169.2 167.3 -1.9
ၗ ૻ Ϸ ೯ ૻ ኞ ! 168.0 168.6 166.4 166.1 165.2 -0.9
ߎ ᑼ Ϸ ߥ ᓀ ! 165.9 167.5 164.6 165.6 162.3 -3.3
ό ౢ ! 179.4 180.6 179.6 179.9 177.2 -2.7
ǵ ࣽ Ꮲ Ϸ מ ೌ ܺ ୍ ! 173.0 173.7 172.0 173.8 170.5 -3.3
Ѝ ජ ܺ ୍ ! 192.7 192.7 188.4 189.1 186.5 -2.6
௲ ػ ܺ ୍ ! 135.1 132.4 131.9 134.4 132.8 -1.6
ᙴ ᕍ ߥ ଼ ܺ ୍ ! 173.9 174.7 173.1 172.6 172.2 -0.4
᛬ ೌ ǵ ু Ϸ Ҷ ໕ ܺ ୍ ! 182.0 183.1 180.7 178.7 177.7 -1.0
ځ д ܺ ୍ ! 196.8 196.6 195.6 193.1 189.5 -3.6
ຏ;ӕ߄2Ƕ!
!
Ϸπᙯᙍ֡ၨԃ෧ϿǴӄԃڙႿπѳ֡ࢬ\)Εɠଏр*03^
ࣁ3/39ʘǴၨԃϐ3/54ʘ෧Ͽ1/26ঁԭϩᗺǶ!
πߐృΕࣁ1/14ʘǴځύаႝΚϷᐯٮᔈϐ1/41ʘၨଯǴҔН ٮᔈϷԦࢉݯϐ1/16ʘۚԛǴԶϷβҡ௦ڗ߾ևృଏрຝǴځృଏ рࣁ1/26ʘǶ୍ܺߐృΕࣁ1/26ʘǴӚՉନόౢևృଏрѦǴ ځᎩࣣևృΕǴځύаՐஎϷᓓϐృΕ1/45ʘࣁനଯǴၗૻϷ೯ૻ
ኞృΕࣁ1/41ʘԛϐǶ!
ऩ൩ӚՉଏϩձᢀჸǴΕаՐஎϷᓓϐ5/8:ʘۚ२ǴЍජܺ
୍ϐ5/4:ʘԛϐǴ᛬ೌǵুϷҶ໕୍ܺ5/16ʘۚಃΟǴԶаႝΚϷᐯٮ ᔈϐ1/93ʘۚ҃ǹଏрҭаՐஎϷᓓ5/56ʘۚ२ǴЍජ୍ܺ5/3:ʘԛ ϐǴ᛬ೌǵুϷҶ໕୍ܺ4/96ʘۚಃΟǴ٠ӕаႝΚϷᐯٮᔈϐ1/63ʘ
ۚ҃Ƕ!
!
߄ˢ! ӚՉڙႿπଏ
!
!ൂՏǺʘ!
!
҇୯!
211ԃ!
҇୯!
212ԃ!
҇୯!
213ԃ!
҇୯!
214ԃ!
҇୯!
215ԃ!
Ε!ଏр!Ε!ଏр!Ε!ଏр!Ε!ଏр!Ε!ଏр! ృ!
Ε!
ᕴ ी! 2.61 2.38 2.27 2.18 2.34 2.21 2.51 2.35 2.33 2.23 0.10 π ߐ! 2.52 2.35 2.17 2.11 2.23 2.12 2.28 2.16 2.01 1.98 0.03
Ϸ β ҡ ௦ ڗ ! 1.29 1.11 0.99 1.59 1.12 1.53 1.45 1.21 0.97 1.12 -0.15 ᇙ ! 2.51 2.33 2.11 2.07 2.11 2.00 2.19 2.03 1.93 1.90 0.03
ႝ Κ Ϸ ᐯ ٮ ᔈ ! 0.50 0.29 0.45 0.40 0.36 0.44 0.51 0.55 0.82 0.52 0.30 Ҕ Н ٮ ᔈ Ϸ Ԧ ࢉ ݯ ! 1.80 1.65 1.66 1.60 1.65 1.30 1.65 1.73 1.65 1.60 0.05 ᔼ ! 2.76 2.67 2.66 2.55 3.11 2.97 3.01 3.02 2.61 2.57 0.04
ܺ ୍ ߐ! 2.70 2.41 2.36 2.22 2.42 2.28 2.68 2.51 2.57 2.42 0.15 ץ ว Ϸ ႟ ୧ ! 2.45 2.19 2.29 2.15 2.30 2.19 2.52 2.40 2.36 2.25 0.11 ၮ ᒡ Ϸ ঊ ᓯ ! 1.76 1.55 1.97 1.87 2.17 2.03 2.15 1.98 2.08 1.91 0.17 Ր எ Ϸ ᓓ ! 4.89 4.19 3.51 3.10 3.94 3.65 4.90 4.54 4.79 4.45 0.34
ၗ ૻ Ϸ ೯ ૻ ኞ ! 2.40 2.12 2.07 1.92 1.93 1.80 2.05 1.95 2.17 1.87 0.30 ߎ ᑼ Ϸ ߥ ᓀ ! 1.62 1.47 1.31 1.31 1.35 1.32 1.36 1.23 1.45 1.33 0.12 ό ౢ ! 2.97 2.42 2.68 2.49 2.84 2.42 3.00 2.61 2.78 2.89 -0.11
ǵ ࣽ Ꮲ Ϸ מ ೌ ܺ ୍ ! 2.18 1.80 1.84 1.74 1.84 1.62 1.96 1.81 1.91 1.75 0.16 Ѝ ජ ܺ ୍ ! 4.94 4.73 4.05 4.06 4.20 4.10 4.75 4.47 4.39 4.29 0.10
௲ ػ ܺ ୍ ! 2.62 2.44 1.84 1.95 2.05 2.03 2.11 2.03 2.11 2.02 0.09 ᙴ ᕍ ߥ ଼ ܺ ୍ ! 1.70 1.48 1.66 1.40 1.51 1.22 1.59 1.35 1.50 1.31 0.19
᛬ ೌ ǵ ু Ϸ Ҷ ໕ ܺ ୍ ! 4.27 4.02 3.50 3.71 4.12 3.92 4.22 4.45 4.05 3.85 0.20 ځ д ܺ ୍ ! 2.00 1.89 1.96 2.06 2.03 1.91 2.17 2.06 1.94 1.89 0.05
ຏ;ӕ߄2Ƕ!!
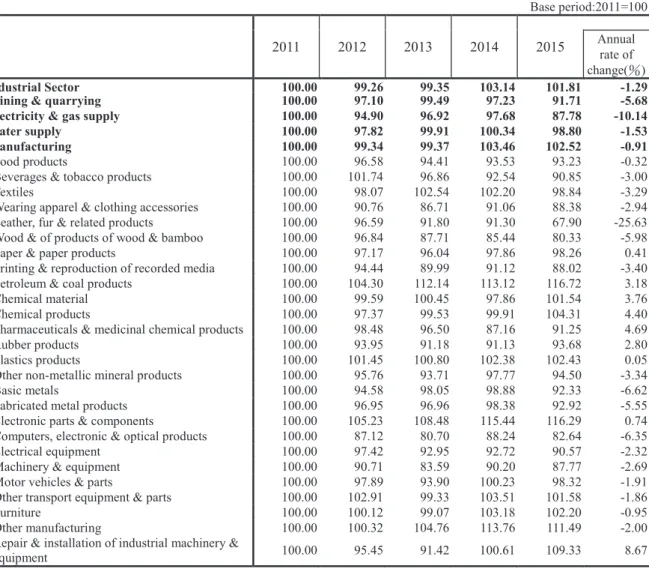
ɇπ)ό֖ᔼ*!മғౢΚࡰ!ኧၨԃΠफ़2/3:ʘǶ!
215ԃπߐȐό֖ᔼȑമғౢΚࡰኧࣁ212/92Ȑ211ԃɨ211ȑǴӢ πғౢࡰኧȐό֖ᔼȑၨԃ෧Ͽ2/96ʘǴଯܭڙႿޣᕴΕπਔ෧൯1/68 ʘǴठമғౢΚࡰኧၨԃΠफ़2/3:ʘǴځύаႝΚϷᐯٮᔈΠफ़21/25 ʘۚ२ǴϷβҡ௦ڗΠफ़6/79ʘԛϐǶ!
ڙΠъԃඳեቹៜǴᇙғౢރݩ෧Ǵӄԃғౢࡰኧၨԃ෧Ͽ 2/5: ʘ Ǵ ଯ ܭ ڙ Ⴟ ޣ ᕴ Ε π ਔ ෧ ൯ 1/6: ʘ Ǵ ठ ᇙ മ ғ ౢ Κ ࡰ ኧ ࣁ 213/63)211ԃɨ211*ǴၨԃΠफ़1/:2ʘǶ൩ӚᇙύՉᢀჸǴമғౢΚ
ࡰኧၨԃΠफ़൯ࡋаҜॠǵЛҜϷځᇙࠔᇙϐ36/74ʘനଯǴ୷ҁߎឦᇙ
ϐ7/73ʘԛϐǴႝတǵႝηౢࠔϷӀᏢᇙࠔᇙϐ7/46ʘۚಃΟǹԶമ
ғౢΚࡰኧၨԃϲ൯ࡋ߾аౢҔᐒఓഢᆢঅϷӼး9/78ʘࣁനଯǴᛰ ࠔϷᙴҔϯᏢᇙࠔᇙ5/7:ʘԛϐǶ!
߄ˣ! π)ό֖ᔼ*!ڙႿޣമғౢΚࡰኧ
!
୷යǺ҇୯211ԃɨ211!
! ҇୯!
211ԃ!
҇୯!
212ԃ!
҇୯!
213ԃ!
҇୯!
214ԃ!
҇୯!
215ԃ!
!
ԃቚ
)ʘ*
!
π !
100.00 99.26 99.35 103.14 101.81 -1.29 Ϸ β ҡ ௦ ڗ !
100.00 97.10 99.49 97.23 91.71 -5.68ႝ Κ Ϸ ᐯ ٮ ᔈ !
100.00 94.90 96.92 97.68 87.78 -10.14Ҕ Н ٮ ᔈ !
100.00 97.82 99.91 100.34 98.80 -1.53ᇙ !
100.00 99.34 99.37 103.46 102.52 -0.91१ ࠔ ᇙ ! 100.00 96.58 94.41 93.53 93.23 -0.32
Ϸ ᇙ ! 100.00 101.74 96.86 92.54 90.85 -3.00
ત ᙃ ! 100.00 98.07 102.54 102.20 98.84 -3.29
ԋ Պ Ϸ ܺ Ⴌ ࠔ ᇙ ! 100.00 90.76 86.71 91.06 88.38 -2.94 Ҝ ॠ ǵ Л Ҝ Ϸ ځ ᇙ ࠔ ᇙ ! 100.00 96.59 91.80 91.30 67.90 -25.63 Е Ԯ ᇙ ࠔ ᇙ ! 100.00 96.84 87.71 85.44 80.33 -5.98 ર ዀ ǵ ર Ϸ ર ᇙ ࠔ ᇙ ! 100.00 97.17 96.04 97.86 98.26 0.41 ӑ ڇ Ϸ ၗ ᓯ Ӹ ൞ ᡏ ፄ ᇙ ! 100.00 94.44 89.99 91.12 88.02 -3.40 ҡ ݨ Ϸ ྡ ᇙ ࠔ ᇙ ! 100.00 104.30 112.14 113.12 116.72 3.18 ϯ Ꮲ ᇙ ! 100.00 99.59 100.45 97.86 101.54 3.76 ϯ Ꮲ ᇙ ࠔ ᇙ ! 100.00 97.37 99.53 99.91 104.31 4.40
ᛰ ࠔ Ϸ ᙴ Ҕ ϯ Ꮲ ᇙ ࠔ ᇙ ! 100.00 98.48 96.50 87.16 91.25 4.69 ᐎ ጤ ᇙ ࠔ ᇙ ! 100.00 93.95 91.18 91.13 93.68 2.80
༟ ጤ ᇙ ࠔ ᇙ ! 100.00 101.45 100.80 102.38 102.43 0.05 ߚ ߎ ឦ ނ ᇙ ࠔ ᇙ ! 100.00 95.76 93.71 97.77 94.50 -3.34
୷ ҁ ߎ ឦ ᇙ ! 100.00 94.58 98.05 98.88 92.33 -6.62 ߎ ឦ ᇙ ࠔ ᇙ ! 100.00 96.95 96.96 98.38 92.92 -5.55
ႝ η ႟ ಔ ҹ ᇙ ! 100.00 105.23 108.48 115.44 116.29 0.74
ႝတǵႝηౢࠔϷӀᏢᇙࠔᇙ! 100.00 87.12 80.70 88.24 82.64 -6.35
ႝ Κ ഢ ᇙ ! 100.00 97.42 92.95 92.72 90.57 -2.32 ᐒ ఓ ഢ ᇙ ! 100.00 90.71 83.59 90.20 87.77 -2.69
ؓ ً Ϸ ځ ႟ ҹ ᇙ ! 100.00 97.89 93.90 100.23 98.32 -1.91 ځ д ၮ ᒡ π ڀ Ϸ ځ ႟ ҹ ᇙ ! 100.00 102.91 99.33 103.51 101.58 -1.86 ৎ ڀ ᇙ ! 100.00 100.12 99.07 103.18 102.20 -0.95 ځ д ᇙ ! 100.00 100.32 104.76 113.76 111.49 -2.00
ౢ Ҕ ᐒ ఓ ഢ ᆢ অ Ϸ Ӽ း 100.00 95.45 91.42 100.61 109.33 8.67
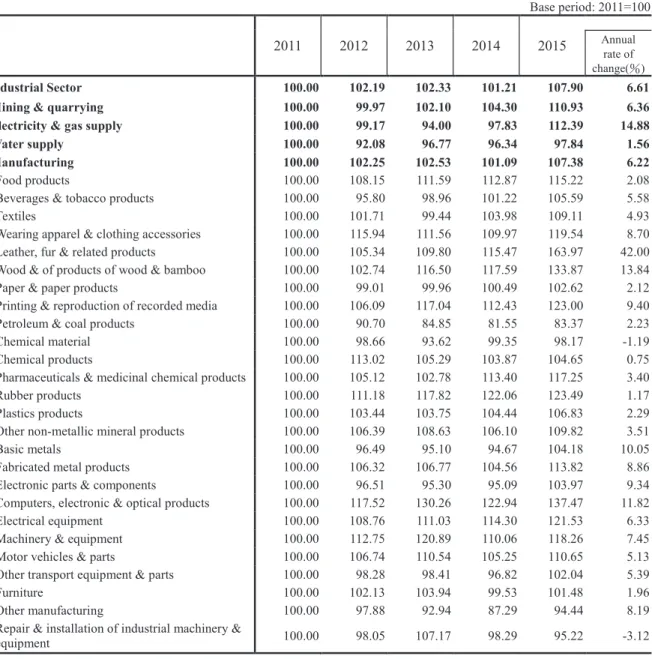
βҡ௦ڗϲ7/47ʘԛϐǶ!
ᇙൂՏౢрമԋҁࡰኧࣁ218/49)211ԃɨ211*ǴӢӄԃғౢၨԃ෧ Ͽ2/5:ʘǴԶڙႿޣᕴᖒၗቚ൯5/75ʘǴठᇙൂՏౢрമԋҁࡰኧၨԃ
ϲ7/33ʘǶӚύՉύǴନౢҔᐒఓഢᆢঅϷӼးᆶϯᏢᇙϩ ձၨԃΠफ़4/23ʘᆶ2/2:ʘѦǴځᎩӚ֡ၨԃϲǴځύаҜॠǵЛҜϷ ځᇙࠔᇙϲ53/11ʘനࣁᡉǴЕԮᇙࠔᇙϲ24/95ʘԛϐǶ!
!
߄ˤ! π)ό֖ᔼ*!ڙႿޣൂՏౢрമԋҁࡰኧ
!
୷යǺ҇୯211ԃɨ211
!
! ҇୯!
211ԃ!
҇୯!
212ԃ!
҇୯!
213ԃ!
҇୯!
214ԃ!
҇୯!
215ԃ!
!
ԃቚ
)ʘ*
!
π !
100.00 102.19 102.33 101.21 107.90 6.61 Ϸ β ҡ ௦ ڗ !
100.00 99.97 102.10 104.30 110.93 6.36ႝ Κ Ϸ ᐯ ٮ ᔈ !
100.00 99.17 94.00 97.83 112.39 14.88Ҕ Н ٮ ᔈ !
100.00 92.08 96.77 96.34 97.84 1.56ᇙ !
100.00 102.25 102.53 101.09 107.38 6.22१ ࠔ ᇙ ! 100.00 108.15 111.59 112.87 115.22 2.08
Ϸ ᇙ ! 100.00 95.80 98.96 101.22 105.59 5.58
ત ᙃ ! 100.00 101.71 99.44 103.98 109.11 4.93
ԋ Պ Ϸ ܺ Ⴌ ࠔ ᇙ ! 100.00 115.94 111.56 109.97 119.54 8.70 Ҝ ॠ ǵ Л Ҝ Ϸ ځ ᇙ ࠔ ᇙ ! 100.00 105.34 109.80 115.47 163.97 42.00 Е Ԯ ᇙ ࠔ ᇙ ! 100.00 102.74 116.50 117.59 133.87 13.84 ર ዀ ǵ ર Ϸ ર ᇙ ࠔ ᇙ ! 100.00 99.01 99.96 100.49 102.62 2.12 ӑ ڇ Ϸ ၗ ᓯ Ӹ ൞ ᡏ ፄ ᇙ ! 100.00 106.09 117.04 112.43 123.00 9.40 ҡ ݨ Ϸ ྡ ᇙ ࠔ ᇙ ! 100.00 90.70 84.85 81.55 83.37 2.23 ϯ Ꮲ ᇙ ! 100.00 98.66 93.62 99.35 98.17 -1.19 ϯ Ꮲ ᇙ ࠔ ᇙ ! 100.00 113.02 105.29 103.87 104.65 0.75
ᛰ ࠔ Ϸ ᙴ Ҕ ϯ Ꮲ ᇙ ࠔ ᇙ ! 100.00 105.12 102.78 113.40 117.25 3.40 ᐎ ጤ ᇙ ࠔ ᇙ ! 100.00 111.18 117.82 122.06 123.49 1.17
༟ ጤ ᇙ ࠔ ᇙ ! 100.00 103.44 103.75 104.44 106.83 2.29 ߚ ߎ ឦ ނ ᇙ ࠔ ᇙ ! 100.00 106.39 108.63 106.10 109.82 3.51
୷ ҁ ߎ ឦ ᇙ ! 100.00 96.49 95.10 94.67 104.18 10.05 ߎ ឦ ᇙ ࠔ ᇙ ! 100.00 106.32 106.77 104.56 113.82 8.86
ႝ η ႟ ಔ ҹ ᇙ ! 100.00 96.51 95.30 95.09 103.97 9.34
ႝတǵႝηౢࠔϷӀᏢᇙࠔᇙ! 100.00 117.52 130.26 122.94 137.47 11.82
ႝ Κ ഢ ᇙ ! 100.00 108.76 111.03 114.30 121.53 6.33 ᐒ ఓ ഢ ᇙ ! 100.00 112.75 120.89 110.06 118.26 7.45
ؓ ً Ϸ ځ ႟ ҹ ᇙ ! 100.00 106.74 110.54 105.25 110.65 5.13 ځ д ၮ ᒡ π ڀ Ϸ ځ ႟ ҹ ᇙ ! 100.00 98.28 98.41 96.82 102.04 5.39 ৎ ڀ ᇙ ! 100.00 102.13 103.94 99.53 101.48 1.96
ځ д ᇙ 100.00 97.88 92.94 87.29 94.44 8.19
ౢ Ҕ ᐒ ఓ ഢ ᆢ অ Ϸ Ӽ း 100.00 98.05 107.17 98.29 95.22 -3.12
!
1.Number of employees
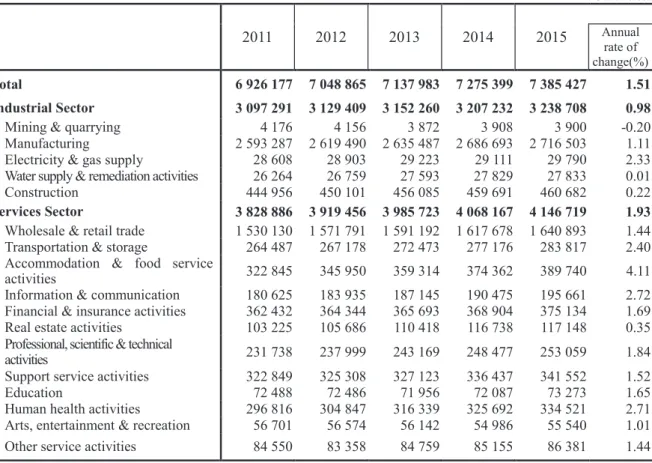
The number of employees in the industrial and services sectors was 110 thousand or 1.51% more than the previous year.
As the economic cycle slowed down and the corporate demand for labor cooled during the second half of 2015, the number of employees in the industrial and services sectors was 7,385 thousand year-round on average, which can be translated to an increase of 110 thousand or 1.51% over the previous year. This was a scale and extent of increase lower than those of last year. Judging from the activity level, the ratio of employees was 43.85% in the industrial sector and 56.15% in the services sector.
The number of employees in the industrial sector was 3,239 thousand year-round, representing an increase of 32 thousand or 0.98% over the previous year, with the highest growth of 30 thousand in the manufacturing. In the services sector, an increase of 79 thousand or 1.93% over the previous year occurred and brought the number to 4,147 thousand, with the most gain of 23 thousand and 16 thousand people from the wholesale & retail trade industry and accommodation & food service activities respectively.
On average, the number of employees in the manufacturing was 2,717 thousand, which was an increase of 30 thousand or 1.11% over the previous year, with the top growers of 3.44% in the other manufacturing, 2.84% in the other transport equipment & parts, and 2.74% in the machinery &
equipment. On the other hand, the most severe reductions were 2.84% in the petroleum & coal products, 2.29% in the chemical products, and 1.13% in the wearing apparel & clothing accessories.
Table 1 Number of employees in all industries
Unit: Person
2011 2012 2013 2014 2015
!
Annual rate of change(%)
Total 6 926 177 7 048 865 7 137 983 7 275 399 7 385 427 1.51
Industrial Sector 3 097 291 3 129 409 3 152 260 3 207 232 3 238 708 0.98
Mining & quarrying 4 176 4 156 3 872 3 908 3 900 -0.20 Manufacturing 2 593 287 2 619 490 2 635 487 2 686 693 2 716 503 1.11 Electricity & gas supply 28 608 28 903 29 223 29 111 29 790 2.33 Water supply & remediation activities 26 264 26 759 27 593 27 829 27 833 0.01 Construction 444 956 450 101 456 085 459 691 460 682 0.22
Services Sector 3 828 886 3 919 456 3 985 723 4 068 167 4 146 719 1.93Wholesale & retail trade 1 530 130 1 571 791 1 591 192 1 617 678 1 640 893 1.44 Transportation & storage 264 487 267 178 272 473 277 176 283 817 2.40 Accommodation & food service
activities 322 845 345 950 359 314 374 362 389 740 4.11
Information & communication 180 625 183 935 187 145 190 475 195 661 2.72 Financial & insurance activities 362 432 364 344 365 693 368 904 375 134 1.69 Real estate activities 103 225 105 686 110 418 116 738 117 148 0.35 Professional, scientific & technical
activities 231 738 237 999 243 169 248 477 253 059 1.84 Support service activities 322 849 325 308 327 123 336 437 341 552 1.52
Education 72 488 72 486 71 956 72 087 73 273 1.65
Human health activities 296 816 304 847 316 339 325 692 334 521 2.71
Arts, entertainment & recreation 56 701 56 574 56 142 54 986 55 540 1.01
Other service activities 84 550 83 358 84 759 85 155 86 381 1.44
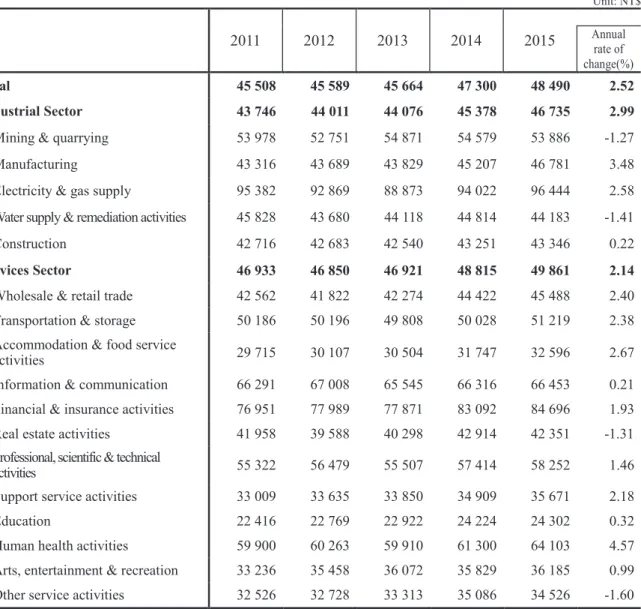
Note: Education (only Other education and Educational support activities included).increase of 2.52% over the previous year. The primary drivers behind this were increased year-end bonus and performance bonus.
In the industrial sector, the monthly earnings per employee was averaged at NT$46,735, which was 2.99% more than the previous year, with the highest increase of 3.48% in the manufacturing, 2.58% in the electricity & gas supply, and 0.22% in the construction. Nevertheless, a reduction of 1.41% and 1.27% were found in the water supply & remediation activities and mining & quarrying.
In the services sector, the monthly earnings per employee were averaged at NT$49,861, which showed an increase of 2.14% over the previous year. Except for the reduction of 1.60% and 1.31%
over the previous year in the other service activities and real estate activities, the rest of the sector had experienced an increase, among which human health activities saw the highest growth of 4.57%, the accommodation & food service activities 2.67%, and the wholesale & retail trade 2.40%.
Table 2 Average Monthly Earnings of Employees by Industry
Unit: NT$
2011 2012 2013 2014 2015
!
Annual rate of change(%)
Total 45 508 45 589 45 664 47 300 48 490 2.52
Industrial Sector 43 746 44 011 44 076 45 378 46 735 2.99
Mining & quarrying 53 978 52 751 54 871 54 579 53 886 -1.27
Manufacturing 43 316 43 689 43 829 45 207 46 781 3.48
Electricity & gas supply 95 382 92 869 88 873 94 022 96 444 2.58 Water supply & remediation activities 45 828 43 680 44 118 44 814 44 183 -1.41
Construction 42 716 42 683 42 540 43 251 43 346 0.22
Services Sector 46 933 46 850 46 921 48 815 49 861 2.14
Wholesale & retail trade 42 562 41 822 42 274 44 422 45 488 2.40 Transportation & storage 50 186 50 196 49 808 50 028 51 219 2.38 Accommodation & food service
activities 29 715 30 107 30 504 31 747 32 596 2.67
Information & communication 66 291 67 008 65 545 66 316 66 453 0.21 Financial & insurance activities 76 951 77 989 77 871 83 092 84 696 1.93 Real estate activities 41 958 39 588 40 298 42 914 42 351 -1.31 Professional, scientific & technical
activities 55 322 56 479 55 507 57 414 58 252 1.46
Support service activities 33 009 33 635 33 850 34 909 35 671 2.18
Education 22 416 22 769 22 922 24 224 24 302 0.32
Human health activities 59 900 60 263 59 910 61 300 64 103 4.57
Arts, entertainment & recreation 33 236 35 458 36 072 35 829 36 185 0.99
Other service activities 32 526 32 728 33 313 35 086 34 526 -1.60
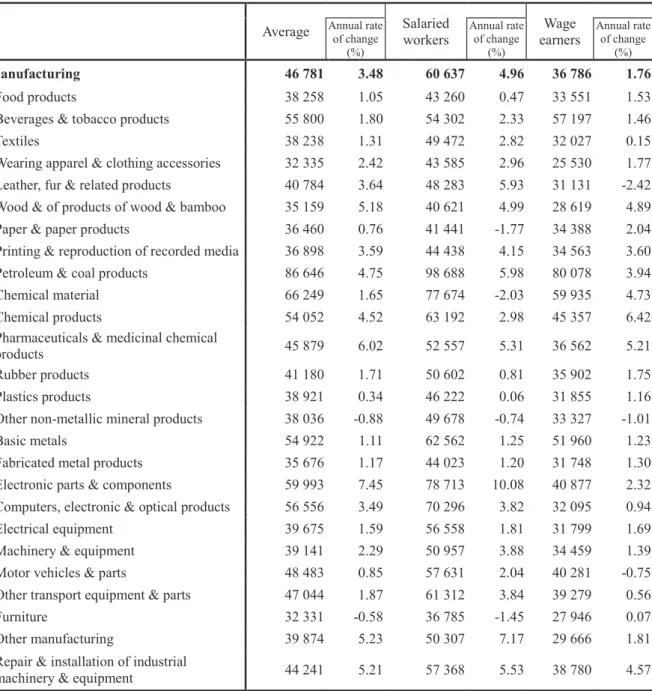
Note: Same as Table 1.equivalent to an increase of 3.48% over the previous year.
In 2015, the monthly earnings per employee were averaged at NT$46,781 in the manufacturing, where it was NT$60,637 for staff and 36,786 for workers on average, indicating a 3.48% growth over the previous year.
On the activity level, the highest monthly earnings per employee were NT$86,646 in the petroleum & coal products, followed by NT$66,249 in the chemical material and NT$59,993 in the electronic parts & components. Those with lower earnings were labor intensive activities, in the order of NT$35,159 in the wood & of products of wood & bamboo, NT$32,335 in the wearing apparel &
clothing accessories industry, and NT$32,331 in the furniture.
Table 3 Average Monthly Earnings of Manufacturing Employees in 2015
! ! ! ! ! ! ! ! ! ! ! ! ! ! ! ! ! ! ! ! ! ! ! ! !! !! ! !
Unit: NT$! Average Salaried
workers
Wage earners
Annual rate of change
(%)!
Annual rate of change
(%)!
Annual rate of change
(%)!
Manufacturing 46 781 3.48 60 637 4.96 36 786 1.76
Food products 38 258 1.05 43 260 0.47 33 551 1.53
Beverages & tobacco products 55 800 1.80 54 302 2.33 57 197 1.46
Textiles 38 238 1.31 49 472 2.82 32 027 0.15
Wearing apparel & clothing accessories 32 335 2.42 43 585 2.96 25 530 1.77 Leather, fur & related products 40 784 3.64 48 283 5.93 31 131 -2.42 Wood & of products of wood & bamboo 35 159 5.18 40 621 4.99 28 619 4.89 Paper & paper products 36 460 0.76 41 441 -1.77 34 388 2.04 Printing & reproduction of recorded media 36 898 3.59 44 438 4.15 34 563 3.60 Petroleum & coal products 86 646 4.75 98 688 5.98 80 078 3.94
Chemical material 66 249 1.65 77 674 -2.03 59 935 4.73
Chemical products 54 052 4.52 63 192 2.98 45 357 6.42
Pharmaceuticals & medicinal chemical
products 45 879 6.02 52 557 5.31 36 562 5.21
Rubber products 41 180 1.71 50 602 0.81 35 902 1.75
Plastics products 38 921 0.34 46 222 0.06 31 855 1.16
Other non-metallic mineral products 38 036 -0.88 49 678 -0.74 33 327 -1.01
Basic metals 54 922 1.11 62 562 1.25 51 960 1.23
Fabricated metal products 35 676 1.17 44 023 1.20 31 748 1.30 Electronic parts & components 59 993 7.45 78 713 10.08 40 877 2.32 Computers, electronic & optical products 56 556 3.49 70 296 3.82 32 095 0.94
Electrical equipment 39 675 1.59 56 558 1.81 31 799 1.69
Machinery & equipment 39 141 2.29 50 957 3.88 34 459 1.39 Motor vehicles & parts 48 483 0.85 57 631 2.04 40 281 -0.75 Other transport equipment & parts 47 044 1.87 61 312 3.84 39 279 0.56
Furniture 32 331 -0.58 36 785 -1.45 27 946 0.07
Other manufacturing 39 874 5.23 50 307 7.17 29 666 1.81
Repair & installation of industrial
machinery & equipment 44 241 5.21 57 368 5.53 38 780 4.57
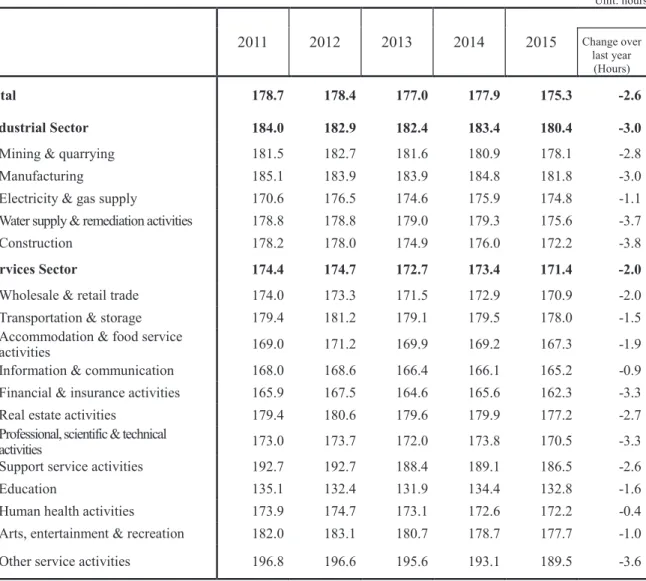
of 3.0 hours occurred that decreased the working hours to 180.4 hours. Though a reduction of working hours was common in this sector, the construction and water supply & remediation activities triumphed with a reduction of 3.8 and 3.7 hours. The services sector had also seen a reduction of 2.0 hours to 171.4 hours with the other service activities taking the lead with 3.6 hours, followed by 3.3 hours in both the financial & insurance activities and professional, scientific & technical activities.
On the activity level, the top 10 activities with longer working hours were security and investigation activities (222.2 hours), motor bus transportation (204.6 hours), hairdressing and other beauty treatment (200.5 hours), textiles (191.7 hours), rubber products (189.9 hours), wood & of products of wood & bamboo (188.9 hours), other personal service activities (188.0 hours), paper &
paper products (187.7 hours), other non-metallic mineral products (185.9 hours) as well as printing &
reproduction of recorded media (184.9 hours).
Table 4 Average Monthly Working Hours of Employees by Industry
Unit: hours
! 2011 2012 2013 2014 2015
!
Change over last year
(Hours)!
Total 178.7 178.4 177.0 177.9 175.3 -2.6
Industrial Sector 184.0 182.9 182.4 183.4 180.4 -3.0
Mining & quarrying 181.5 182.7 181.6 180.9 178.1 -2.8
Manufacturing 185.1 183.9 183.9 184.8 181.8 -3.0
Electricity & gas supply 170.6 176.5 174.6 175.9 174.8 -1.1 Water supply & remediation activities 178.8 178.8 179.0 179.3 175.6 -3.7
Construction 178.2 178.0 174.9 176.0 172.2 -3.8
Services Sector 174.4 174.7 172.7 173.4 171.4 -2.0
Wholesale & retail trade 174.0 173.3 171.5 172.9 170.9 -2.0 Transportation & storage 179.4 181.2 179.1 179.5 178.0 -1.5 Accommodation & food service
activities 169.0 171.2 169.9 169.2 167.3 -1.9
Information & communication 168.0 168.6 166.4 166.1 165.2 -0.9 Financial & insurance activities 165.9 167.5 164.6 165.6 162.3 -3.3 Real estate activities 179.4 180.6 179.6 179.9 177.2 -2.7 Professional, scientific & technical
activities 173.0 173.7 172.0 173.8 170.5 -3.3
Support service activities 192.7 192.7 188.4 189.1 186.5 -2.6
Education 135.1 132.4 131.9 134.4 132.8 -1.6
Human health activities 173.9 174.7 173.1 172.6 172.2 -0.4 Arts, entertainment & recreation 182.0 183.1 180.7 178.7 177.7 -1.0 Other service activities 196.8 196.6 195.6 193.1 189.5 -3.6
Note: Same as Table 1/!!
!
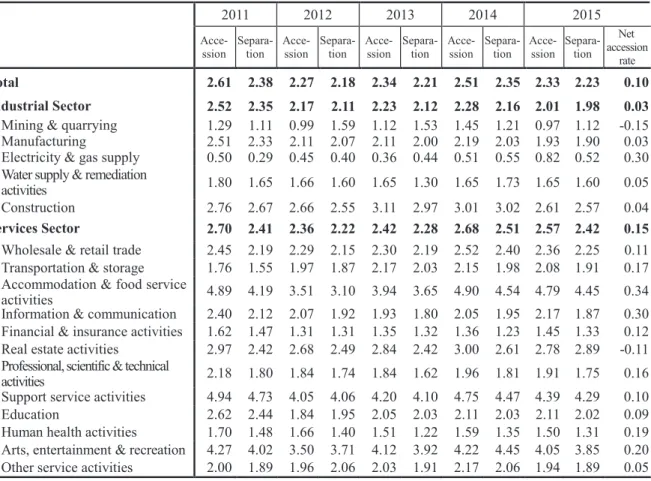
The accession rate of employees was 2.33%, which was slightly higher than the separation rate of 2.23%.
In 2015, the average accession and separation rate for the employees in the industrial and services sectors was 2.33% and 2.23%, representing a net accession rate (accession rate minus separation rate) of 0.10%. Influenced by the slow economic cycle in the second half of the year, the level of corporate recruitment and employment transfer dropped in comparison with the previous year, resulting in an average year-round turnover rate of 2.28% [(accession rate + separation rate)/2], a reduction of 0.15%
compared with the rate of 2.43% last year.
In the industrial sector, the net accession rate is 0.03%, with the highest rate of 0.30% in the electricity & gas supply and 0.05% in the water supply & remediation activities, whereas the mining &
quarrying exhibited a net separation rate of 0.15%. In the services sector, the net accession rate was 0.15%. Except for net separation experienced by the real estate activities, net accession was common to this sector, among which the accommodation & food service activities showed the highest rate of 0.34% and the information & communication of 0.30%.
On the activity level, the highest accession rate occurred in the accommodation & food service activities with a rate of 4.79%, followed by 4.39% in the support service activities, 4.05% in the arts, entertainment & recreation, and 0.82% in the electricity & gas supply. As to the separation rate, the highest being the 4.45% in the accommodation & food service activities, followed by 4.29% in the support service activities, 3.85% in the arts, entertainment & recreation, and 0.52% in the electricity &
gas supply.
Table 5 Labor Turnover Rates by Industry
!Unit: %
!
2011 2012 2013 2014 2015
Acce- ssion
Separa- tion
Acce- ssion
Separa- tion
Acce- ssion
Separa- tion
Acce- ssion
Separa- tion
Acce- ssion
Separa- tion
Net accession
rate
Total 2.61 2.38 2.27 2.18 2.34 2.21 2.51 2.35 2.33 2.23 0.10 Industrial Sector 2.52 2.35 2.17 2.11 2.23 2.12 2.28 2.16 2.01 1.98 0.03