碩 士 論 文
Mining Apps Usage Patterns for Mobile Apps Prediction
Mining Apps Usage Patterns for Mobile Apps Prediction
Student Yi-Chin Pan
Advisor Wen-Chih Peng
A Thesis
Submitted to Institute of Network Engineering College of Computer Science
National Chiao Tung University in partial Fulfillment of the Requirements
for the Degree of Master
in
Computer Science August 2012
Mining Apps Usage Patterns for Mobile Apps Prediction
Student Yi-Chin Pan Advisors Dr. Wen-Chih Peng
Institute of Computer Science National Chiao Tung University
ABSTRACT
Due to the proliferation of mobile applications (abbreviated as Apps) on mobile devices, users can download and execute Apps to facilitate their life. Clearly, Apps usage logs on mobile devices reflect users’ behavior. Given Apps usage logs, we intend to mine Apps usage patterns, which refers how and when Apps are used. To save the energy consumption for Apps usage logs generation, Apps usage logs usually record when Apps are executed. In other words, only temporal information is collected in Apps usage logs. With only temporal information is available in Apps usage logs, for each App, its usage pattern consists of three features: global-frequency, temporal-frequency, and periodicity. Explicitly, the global frequency of Apps refers the number of executions from the global view of Apps usages, the temporal-frequency of Apps is used to capture the execution distribution of Apps within a pre-defined time slot, and the periodicity is to identify whether Apps is periodically executed or not. In light of the three features of Apps, we address the mobile Apps usage prediction problem. Given a query time and the number of Apps, denoted as K, the top K Apps that are likely to be executed at the query time are generated. Based on Apps usage patterns, we propose two prediction algorithms: naive prediction algorithm and adaptive prediction
Contents
1 Introduction 1 2 Related Work 5 3 System Overview 7 3.1 Preliminaries . . . 7 3.2 Architecture . . . 94 Apps usage pattern Discovery 10 4.1 Global-frequency . . . 10
4.2 Temporal-frequency . . . 11
4.3 Periodicity . . . 11
4.3.1 Period Detection . . . 12
4.3.2 Specific Time Discovery . . . 14
5 Apps Usage Pattern Based Prediction 16 5.1 Apps Usage Probability Model . . . 16
5.1.1 Global-frequency Probability Measurement . . . 16
5.1.2 Temporal-frequency Probability Measurement . . . 17
5.1.3 Periodicity Probability Measurement . . . 18
6.1 Dataset . . . 24
6.2 Evaluation measurement . . . 25
6.3 Competitors . . . 25
6.4 Parameters . . . 26
6.5 Evaluation Results . . . 27
6.5.1 Prediction accuracy comparison . . . 27
6.5.2 Sensitivity Analysis . . . 30
List of Figures
1.1 The usage logs of the Alarm, Calories Burned Calculator and Wireless App for 12
days . . . 4
3.1 System overview . . . 9
4.1 An example of periodicity detection . . . 12
4.2 An example of behavior clustering . . . 13
4.3 An example of specific time interval discovery . . . 15
5.1 An example of round-robin prediction for top K Apps . . . 19
5.2 An example of adaptive prediction for top K Apps . . . 21
6.1 Prediction accuracy comparison on HTC dataset . . . 27
6.2 Prediction accuracy comparison on Nokia dataset . . . 28
6.3 Prediction accuracy comparison under synthetic dataset with different usage features 29 6.4 MRR for different feature selection ordering . . . 30
6.5 Parameter analysis for Apps usage pattern discovery . . . 31
Chapter 1
Introduction
The recent years have witnessed a considerable increase in the number of mobile devices. With the improvement in mobile devices technologies, mobile applications (Apps) have been developed rapidly to satisfy users’ requirements. The functionality of Apps is becoming more diverse and powerful that users use mobile devices not only for calling but also for web browsing, shopping and socializing. Apps also can be easily download on mobile devices through the online Apps stores. With the increasing number of Apps, the Apps usage logs increase as well. Due to users’ daily Apps usage are recored by the Apps usage logs, we aim at discovering Apps usage patterns hidden in Apps usage logs.
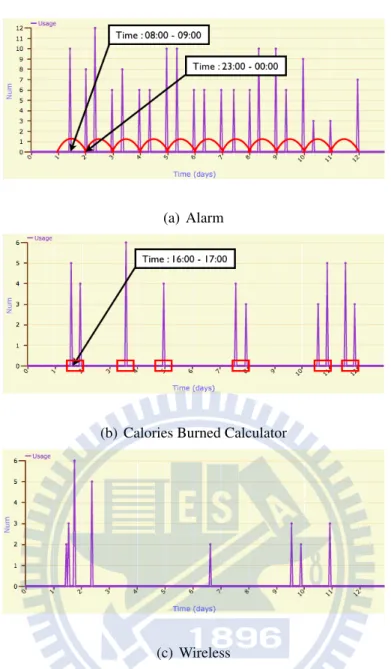
To save the energy consumption for Apps usage logs generation, Apps usage logs usually record when Apps are executed. In other words, only temporal information is collected in Apps usage logs. By analyzing the Apps usage logs, we observe three features of Apps usage patterns. First, some Apps are used periodically, as Figure 1.1(a) shown, the Alarm App is used every day so that it has the usage period, i.e. 24 hours. Second, some Apps are not used periodically but used frequently at some duration of time, as Figure 1.1(b) shown, although the Calories Burned Calculator App is not used periodically, it is used frequently at some duration time, i.e. 16:00 to 17:00. Third, some Apps are used randomly that are not related to time. For example, as shown in Figure 1.1(c) the Wireless App is used randomly because it is not related to time, instead of location. According to above observations, we define three features of Apps usage behaviors as periodicity, temporal-frequency, and general-frequency. Based on these features, we propose the Apps usage pattern to capture the
Apps usage behaviors. The Apps usage pattern consists of the three features. In this paper, we present how to discover Apps usage patterns from a user’s App usage logs and then exploit them to predict the user’s App usage.
Mining Apps usage patterns could be used in predicting Apps usage, analyzing user behaviors and optimizing resource usage, such as power and memory, in mobile devices. For Apps usage prediction task, we formulate mobile Apps prediction problem. Given a query time and one user-defined threshold K, a list of top K Apps that are likely to be used at the query time is generated. There are many applications related to the mobile Apps prediction. For example, with an increasing amount of Apps installed in smart phones, sometimes, users need more time to find their Apps for execution. With mobile Apps usage prediction, one could provide an Apps widget that could predict top K Apps when users use their mobile phones. Another example is that by exploring mobile Apps usage patterns, one could optimize the power and memory usages in mobile phones. Explicitly, if mobile Apps will not be used recently, one could stop the execution of mobile Apps to save the energy and free memory usage. By utilizing mobile Apps usage prediction, a more smarter resource management is designed.
For mobile Apps usage prediction, Android mobile operation system and some Apps provides a list of recent top K Apps. We claim that for some recent Apps, since users already use these Apps to finish their tasks, these recent Apps may not be used in the near future. Since Apps usage patterns infer Apps usage behavior, one could utilize Apps usage patterns for mobile Apps usage prediction. Note that in Apps usage patterns, each Apps will have three features: general-frequency, temporal-frequency and periodicity. These features capture Apps usage behaviors in terms of global Apps usage, time-sensitive and periodicity perspectives. Consequently, how to utilize these features for inferring the usage probabilities of Apps is an challenge issue. The other challenge issue is that given a set of Apps, each of which has their own features, how to select the top K Apps is another challenge issue.
In this paper, we first propose methods to derive three features in Apps usage patterns. Then, for each feature in Apps usage patterns, we derive the usage probabilities of Apps. Note that the usage
AUP-AP) to generate K Apps. A set of Apps with their features, represented as usage probabilities, is modeled as Apps usage probability matrix and called Apps usage probability model. The number of rows is the number of Apps and the columns represent the corresponding usage probabilities derived by three features. Given such an Apps usage probability model, algorithm AUP-NP is designed according to the concept of round-robin selection. In each round of naive prediction algorithm, AUP-NP selects the Apps that has the maximal usage probability in the Apps usage probability matrix until the top K Apps are extracted. On the other hand, AUP-AP first evaluates and selects the possible Apps from the App usage probabilities matrix, and then, a probability value pv is used to control the selection of Apps. Those Apps that have their usage probabilities larger than pv is selected. If the number of Apps selected is not equal to K, we decrease the pv and then selects some Apps until the K Apps is selected. To evaluate our proposed methods for mining Apps usage patterns and two proposed prediction algorithms, two real mobile Apps usage datasets are used. The experiment results show that our proposed methods can discover the Apps usage patterns effectively and our proposed prediction algorithms are able to accurately predict the Apps, and demonstrate the advantage of using Apps usage patterns for mobile Apps prediction.
To the best of our knowledge, this is the first work to investigate this problem. The extensive experiments show that the proposed methods predict the Apps usage intensions accurately and effi-ciently. The main contributions of this paper are summarized below.
• By observing the Apps usage logs, we define the Apps usage pattern which consists of three features, including periodicity, temporal-frequency and general-frequency.
• We present the methods of the corresponding feature to discover the Apps usage pattern from the Apps usage logs.
• According to the Apps usage pattern, we propose the Apps usage pattern based prediction method (AUP) for Apps prediction. In AUP, we present the Apps usage probability model to derive the probabilities of each feature, and then we propose two prediction algorithms, naive prediction and adaptive prediction to generate a list of top K Apps at the query time.
• Comprehensive experiments are conducted over two real datasets. The experimental results show that our proposed method is able to predict the Apps usage accurately and efficiently. The remainder of this paper is organized as follows: Chapter II presents some related works.
(a) Alarm
(b) Calories Burned Calculator
(c) Wireless
Figure 1.1: The usage logs of the Alarm, Calories Burned Calculator and Wireless App for 12 days Chapter III describes the preliminaries and our proposed system architecture. In Chapter IV, we discover Apps usage patterns consisting of three features. The Apps usage pattern based prediction algorithms are proposed in Chapter V. Chapter VI presents the comprehensive experimental results and Chapter VII concludes with this paper.
Chapter 2
Related Work
With the popularity of mobile devices and smart phone, our location, communication, movement trajectory and even the usage of mobile applications are able to continuously captured in our daily life. These mobile data may carry the user’s behavior and social interaction, and has attracted many researches pay attention on mining many interesting and useful knowledge from mobile data [1, 2, 3, 4, 5, 6, 7]. [1] used the apriori-like approach to mine the associations between user interactions and contexts from mobile context logs to characterize the habits of mobile users, and [2] discovered the habits of mobile users to find the similar mobile users. In [3, 4, 5], the authors all focused on the mobile search which allowed users to search, locate and access web information on mobile devices, and [7] used the collaborative filtering technique to recommend the places where the mobile user might be interested. There are some research works on analysis of mobile Apps. The authors in [8] took a study on the privacy and risk security of mobile Apps. To analyze the smartphone usage behaviors, [9] presented two contextual variables which are places and social context, and observed the relations between smart phone usage and the two contextual. In [10], the authors presented a probabilistic framework to mine patterns of mobile phone usage logs, but they only considered the day time of usage. For example, in the afternoon of a day, users used the camera and photo gallery. However, our work observes the features of Apps usage behaviors from the Apps usage logs, and we aim at mining the mobile Apps usage patterns based on the features to predict the users’ Apps usage intentions.
emerg-ing studies and application for prediction, includemerg-ing the buyemerg-ing trends, supply demands, future event, social influence, and location prediction [11, 12, 13, 3, 14, 15]. For the location prediction [11, 12], Jeung et al. [11] explored the association rules to represent the trajectory patterns and proposed a hybrid prediction model that combined the trajectory patterns with the motion function to predict the future location of a moving object, and [12] used the Trajectory Patterns, which extracted from the previous movement patterns, to train and then built the T-pattern Tree for predicting the next location. [3] presented a data-drive methods to analyze the local search queries and then proposed a location-aware features for local search click prediction. [14] proposed a hybrid method based on the probabilistic and the time-series model to predict the future events. [15] focused on predicting social influence by formulating the prediction problem as a user-post matrix and then proposed a hy-brid algorithm Hyhy-brid Factor Non-negative Matrix Factorization (HF-NMF) to solve the problem. In our work, we can not use the existing methods of prediction, such as classification and regression, to solve the Apps usage intentions prediction problem. Since the Apps usage behaviors of a user are different with time, and the features should be determined to consider individually or collectively at the query time. Therefore, we propose an Apps usage pattern based prediction algorithm that discover a user’s Apps usage patterns by considering multiple features and utilize these patterns to predict the Apps are likely used by the user at query time.
The recommendation problems is similar to the prediction problems, and there are also many recommendation systems have been developed in a variety of areas, such as text documents [16], movies [17], TVs [18], web pages [19], digital libraries [20], online marketing [21], online videos [22] and so on. However, the recommender system is to estimate the ratings for unseen items by a user. In summary, the main theme of our work is to discover Apps usage patterns and exploit the Apps usage patterns for Apps prediction.
Chapter 3
System Overview
In this section, we first present some terms used in this paper, and describe the Apps usage prediction problem, and then briefly introduce the architecture of our system.
3.1 Preliminaries
To analyze the Apps usage behavior of users, the usage logs of each App are first transformed into App-history. The purpose of the transformation is to collect all usage logs of an App and records the number of usage in each time slot for analyzing the features of Apps usage behaviors and later processing.
The App usage logs and the App-history are formally defined as follows:
Definition 1. App usage logs: A usage log is a tuple (app, t), where an App app is used at time t.
Definition 2. App-history: Given a starting time of collection ts and the length of time slot ⌧,
the App-history of App app is defined as AH(app) =< n1, n2, ... >, where ni denotes the number of usage logs of App app at the i-th time slot.
From the App-history, we observe three features of Apps usage behaviors. First, some Apps are used periodically. As shown in Figure 1.1(a), the Alarm App is used in every morning when the user wakes up (08:00 to 09:00) to turn off the alarm and in every evening (23:00 to 00:00) the user set the alarm before going to bed. In other words, the Alarm Apps has the usage period of 24
hours and under this period exists some specific times. Second, although some Apps were not used periodically, they are used frequently at some certain duration of time. As an example shown in Figures 1.1(b), the Calories Burned App is used frequently at the certain duration of time (16:00 to 17:00). We investigate that, in one real dataset collected, the user uses the Calories Burned App as they exercising, and he does not exercise everyday but always at certain duration of time. Finally, some Apps are used randomly and they were not related to time, such as the Wireless App, as shown in Figure 1.1(c). We define these features of Apps usage behaviors as periodicity, temporal-frequency and general-temporal-frequency respectively. Periodicity means the usage of the App occurs in a certain period repeatedly. Temporal-frequency means the App is used frequently at the certain duration of time. General-frequency represents the usage of the App is not related to time but the overall usage frequency.
Based on the features of Apps usage behaviors, we then propose the Apps usage pattern which is defined by the three features. The Apps usage pattern is formally defined as follows:
Definition 3. Apps usage pattern: The Apps usage pattern of an App appi is defined as
AU P (appi) = {fgf, ftf, fp} where fgf is denoted as the feature of general f requency and
represented by fgf =< u >, the u is the overall usage frequency, and ftf is denoted as the feature of temporal f requency and represented by ftf =< ub1, ub2, ub3, ..., ubn >, the ubi is the usage
frequency in the i-th temporal bucket which is predefined duration in temporal domain, and fp is
denoted as the feature of periodicity and represented by fp =< p, st1, st2, ..., stn >, the p is the usage period and in the period exists the number of n specific times st.
Given a query time, we attempt to predict the a user’s Apps usage based on the user’s Apps usage behaviors, i.e, Apps usage patterns, and generate a top K list of Apps to represent the user’s Apps usage intention at query time. The Apps usage prediction problem can be defined formally as follows:
Apps usage prediction problem: Given the Apps usage logs of a user, a query time qt and a user-defined threshold K, the list of top K Apps which are likely to be used at the query time is generated.
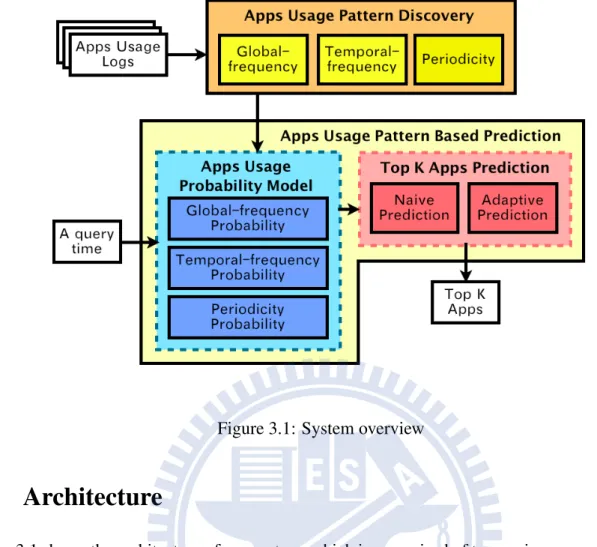
Figure 3.1: System overview
3.2 Architecture
Figure 3.1 shows the architecture of our system, which is comprised of two main components: Apps usage pattern discovery and Apps usage pattern based prediction. The first component operates offline to discover a users’ Apps usage patterns from their Apps usage logs. The second component is the key part of our system, and is conducted online based on the query time. In Apps usage pattern discovery, there are three methods of corresponding feature to discover the features of Apps usage patterns from the Apps usage logs. According to the discovered Apps usage patterns and the query time, Apps usage pattern based prediction first formulate the features of these patterns as probabilities of Apps execution and transformed into the Apps usage probability model for the top K Apps prediction. Then, to generate the top K Apps, there are two Apps usage prediction algorithms, naive prediction and adaptive prediction, which are designed to predict the Apps that are likely to be executed at the query time.
Chapter 4
Apps usage pattern Discovery
Based on the discovered features, we define the Apps usage pattern in section 3, which is described by the features as global-frequency, temporal-frequency, and periodicity respectively. In this section, we present the methods to discover the Apps usage patterns for Apps usage prediction.
4.1 Global-frequency
To discover the feature of global f requency of the Apps usage pattern, fg =< ug >, where the
ug is the overall usage frequency in the duration of Apps usage logs. In other words, the usage
frequency is the number of times for using the App. As the App usage behavior of a user is not related to time, the statistics of the Apps usage frequency is counted to capture the feature of global f requency. The Apps usage logs of a user are considered and then the statistics of usage frequency
are counted from the Apps usage logs. Given the Apps usage logs of a user for m days, the ug of an
App appiis defined as follows:
Time Complexity: Discovering global f requency of the Apps usage pattern takes O(m), where m is the number of days for collecting the Apps usage logs.
4.2 Temporal-frequency
The feature of temporal f requency means the App is used frequently at the certain duration
of time so that we first need to define the certain duration of time and then count the cumulative usage frequency of the App in the duration. As above mentioned, the usage frequency is the number
of times for using the App. For the feature of temporal f requency of the Apps usage pattern,
ft =< ub1, ub2, ub3, ..., ubn >, where the ubj is the usage frequency in the j-th temporal bucket,
which is predefined duration in temporal domain. The cumulative usage frequency of the App in each temporal bucket is counted, and given the size of the temporal bucket bks(minutes), the number of bucket n can be computed by 1440/bks which is the total minutes of a day divided by the bks. After computing the number of bucket, each temporal bucket should be determined. Given the Apps usage logs of a user for m days, the ubj of the App appi is defined as follows:
ubj(appi) =
f reqbj(appi)
m (2)
where the freqbj is the cumulative usage frequency of the App appiin the j-th temporal-bucket.
For example, given the Apps usage logs of a user for 30 days and the bucket size is 60 minutes, there are number of 24 temporal buckets due to one day is divided by 60 minutes. For the Gmail App, if it is used 50 times during 10:00 to 11:00 in the Apps usage logs of 30 days, then for the 10th
temporal-bucket ub10(Gmail)is 50/30 = 1.66.
Time Complexity: Discovering temporal frequency of the Apps usage pattern takes O(nm), where n is the number of temporal bucket and m is the number of days for collecting the Apps usage logs.
4.3 Periodicity
For discovering the feature of periodicity of the Apps usage pattern, fp =< p, st1, st2, ..., stn >, we first detect the usage period of the App and then discover the specific times under the period.
0 1 2 3 0 144 288 432 576 Usage Time (hours) (a) 99.8 P1 P2 P3 P4 (b) P2 P1 P3 P4 27 54 0 81 108 0 100 200 300 Period (hours/time) ACF (c)
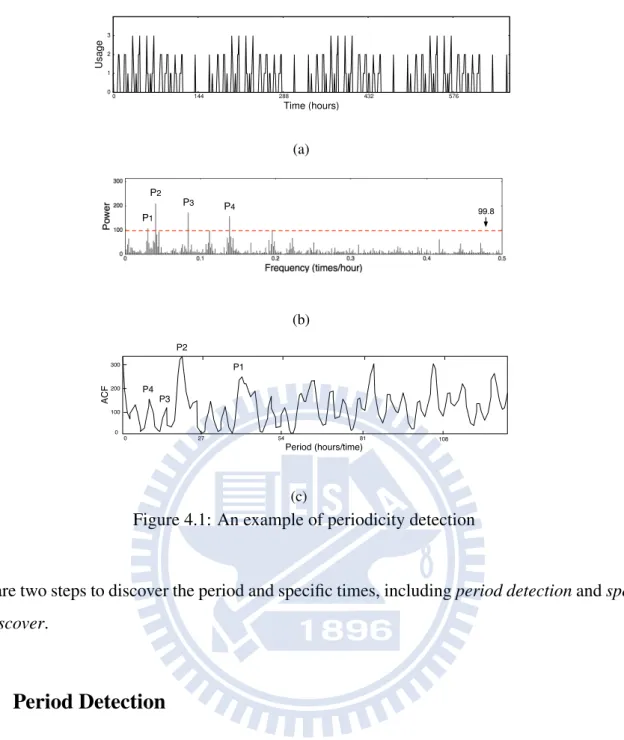
Figure 4.1: An example of periodicity detection
There are two steps to discover the period and specific times, including period detection and specific time discover.
4.3.1 Period Detection
Given the App-history of an App, the goal of this step is to detect the period of the App, and the Apps without periodicity will be eliminated. We adopt Discrete Fourier Transform (DFT) to find all possible periods, and the dynamic cut approach [23] the most significant period, and then the autocorrelation is to prevent the problem that DFT cannot find the significant period in the low
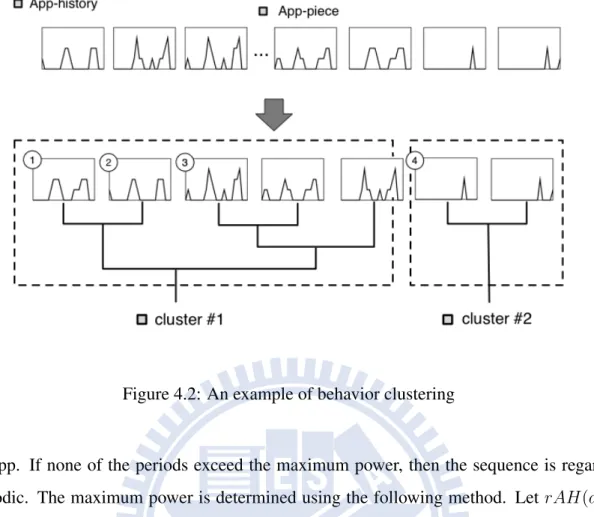
Figure 4.2: An example of behavior clustering
of this App. If none of the periods exceed the maximum power, then the sequence is regarded as non-periodic. The maximum power is determined using the following method. Let rAH(app) be a sequence which is the outcome of a random permutation on the elements of AH(app). Because of the scramblingprocess, rAH(app) does not exhibit any pattern or period, so that we record the maximum power as pmax which FTgram [23] of rAH(app) exhibits at any period. Only the period in AH(app) that has higher power than pmax may considered as a real period. In Figure 4.1(b), the red dashed line is the maximum power of shuffled sequence. Since the maximum power, P , is higher than the red dashed line, this App is recognized as having period and the frequency is P . Finally, in Figure 4.1(c), the frequency is mapped to the period on the autocorrelation curve, and we can see that the mapped period is corresponding to 24 hours, as shown at P2.
Time Complexity: DFT can be executed in O(nlogn) time using Fast Fourier Transform al-gorithm (FFT). Since autocorrelation is a formal convolution which can also be solved by FFT, its complexity is also O(nlogn). Thus, the overall time complexity of period detection is O(nlogn).
4.3.2 Specific Time Discovery
After the period detection step, for an App with its period D, this step first identifies multiple usage behaviors under the period D and then discover the specific times. Since different usage behaviors may share the same period, we have to separate them to discover the specific times. For example, a user may use an App at different times in weekday and weekend, but their period are both one day.
Given the period D and the App-history of an App, the App-history is first decomposed into several subsequences, called pieces, and then the pieces are clustered so that the App-pieces in the same cluster represent the same usage behavior. The App-App-pieces can be formally defined as follows :
Definition 4. App-pieces : The i-th App-piece is defined as AP S(i) = {xj|xj = Ntwhere i =
bt
Dc and j = b
t mod Dc}, where is the length of time slot and Ntdenotes the number of usage logs
of the App app at time t.
For example, time slot = 6, consider the App-history of an App app from 2010-01-01 to
2010-01-02 is AH(app) =< 0, 3, 0, 0, 1, 1, 0, 0 >. Given D = 24 hours, the App-history can be decomposed into two App-pieces: AP S(1) = {0, 3, 0, 0} and AP S(2) = {1, 1, 0, 0}. To identify the multiple usage behaviors, we perform the hierarchical clustering. Figure 4.2 shows an example of behavior identification where we first decompose the App-history into several App-pieces, and then we utilize EDR [24] to calculate the distance of two pieces.
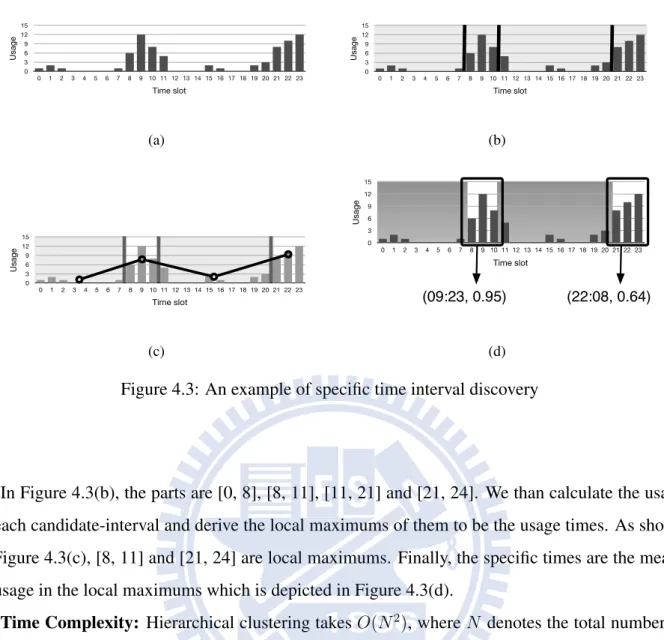
For each group, we discover the specific times under the period D. We use the concept in [25] to identify the specific times. Figure 4.3(a) shows the cumulative usage in 24 hours which is derived by the period detection step. We first separate the temporal domain into several candidate-intervals that the variance of usage in each interval could be minimized. Given a cumulative App-piece,
the candidate-interval S = {s1, s2, ...} can be minimized by argminSP|S| 1i=1 V ar(si, si+1) and
var(si, si+2) > var for each i. The objective can be formulated as a recurrence: let n be the
number of time slots in the cumulative App-piece and MV (i, j) be the minimum variance sum from
0 3 6 9 12 15 0 1 2 3 4 5 6 7 8 9 10 11 12 13 14 15 16 17 18 19 20 21 22 23 Usage Time slot (a) 0 3 6 9 12 15 0 1 2 3 4 5 6 7 8 9 10 11 12 13 14 15 16 17 18 19 20 21 22 23 Usage Time slot (b) 0 3 6 9 12 15 0 1 2 3 4 5 6 7 8 9 10 11 12 13 14 15 16 17 18 19 20 21 22 23 Usage Time slot (c) 0 3 6 9 12 15 0 1 2 3 4 5 6 7 8 9 10 11 12 13 14 15 16 17 18 19 20 21 22 23 Usage Time slot (09:23, 0.95) (22:08, 0.64) (d)
Figure 4.3: An example of specific time interval discovery
In Figure 4.3(b), the parts are [0, 8], [8, 11], [11, 21] and [21, 24]. We than calculate the usage of each candidate-interval and derive the local maximums of them to be the usage times. As shown in Figure 4.3(c), [8, 11] and [21, 24] are local maximums. Finally, the specific times are the means of usage in the local maximums which is depicted in Figure 4.3(d).
Time Complexity: Hierarchical clustering takes O(N2), where N denotes the total number of
App-pieces [26], and to discover the specific times, generating the candidate-intervals takes O(n3)
because it is a recurrence which can be solved by a dynamic manner, where n denotes the number of time slots in the cumulative App-piece.
Chapter 5
Apps Usage Pattern Based Prediction
In this section, we attempt to use the Apps usage patterns for the Apps usage prediction. We propose
an Apps usage pattern based prediction method, abbreviated asAUP which predicts the top K Apps
that are likely to be executed at the query time based on the Apps usage patterns. InAUP, we first
present an Apps usage probability model to formulated the features of Apps usage patterns as the probabilities of the Apps execution, and then we propose two algorithms to derive a list of top K Apps.
5.1 Apps Usage Probability Model
For the Apps usage pattern of an App, the pattern includes three features that represent the Apps usage. To formulated the features of the Apps usage pattern as the probability of the Apps execution, there are three measurements according to the features.
the usage frequency of the App appk, and the probability of global f requency can be formulated as follows:
GF P (appk) = Pnug(appk)
j=1ug(appj)
(1)
where ug(appk)is the global f requencyof the Apps usage pattern of the App appk.
For example, given the Apps usage pattern of the Gmail App, and its feature of global
f requency, fg, the ug is 100. For all Apps usage patterns, the sum of their ug is 1000, then the
usage probability of global f requencyof the Gmail App is 100/1000 = 0.1.
5.1.2 Temporal-frequency Probability Measurement
The usage probability of temporal frequency of an App represents that, in the specific temporal bucket, the App usage frequency under all Apps usage frequency. Before formulating the probability
of temporal f requency, the query time tq need to be mapped to a temporal-bucket by following
computation.
M apping(tq) = (tq t0) mod (bks + 1) (2)
where t0 is the start time of the first temporal bucket and bks is the size of the temporal bucket defined by previous section.
For the feature ft=< ub1, ub2, ub3, ..., ubn >of the Apps usage pattern, the ubiis the cumulative
usage frequency in the i-th temporal-bucket which is determined by the above section. After the
query time and temporal-bucket mapping, the probability of temporal f requency of the App
appkin the i-th temporal-bucket can be formulated as follows:
T F P (appk) = Pnubi(appk)
j=1ubi(appj)
(3)
where ubi(appk)is the temporal f requencyof the Apps usage pattern of the appkin the i-th
temporal-bucket.
For example, given the Apps usage pattern of the Gmail App and a query time, if the query
time is mapped to 10th temporal-bucket by the mapping, the temporal f requency of the Apps
temporal f requency of the Apps usage pattern in 10th bucket of the Gmail App is 50 and the sum of other Apps is 100, then the probability of temporal frequency of the Gmail App is 50/100 = 0.5 at the query time.
5.1.3 Periodicity Probability Measurement
For the periodicity of the Apps usage pattern, the period and the specific times are discovered. If the Apps usage pattern of an App exist the feature of periodicity, then the period of this App is discovered. However, we can not use the usage period for formulating the probability of periodicity, because for the usage period may exists more than one specific times and the periodicity does not exist at any time under the period.
To formulate the probability of periodicity, we present the time distance matching between the query time and the specific times. The closer specific time is considered for the probability of
periodicity computation. The specific time st of the App appkis defined as appk.st. Given a query
time qt, the inverted value of differences between qt and the specific time st are computed by the
time distance function T D(appk.st, qt). The T D(appk.st, qt)is defined as follows:
T D(appk.st, qt) = 8 > < > : 1 for t = appk.st (4) 1
| t appk.st| for qt 6= appk
.st (5)
For example, if Gmail App usage has two specific times, 08:23 and 22:15 under the period. Given a query time 09:30, the query time is matched to the specific time 08:23, because the time distance between query time and the first specific time is 1 / | 09:30 - 08:23 | (minutes) which is closer than the second specific time 1 / | 09:30 - 22:15 | .
The probability of periodicity represents that the time distance between the specific times and
the query time of an App under all Apps. For the periodicity of the Apps usage pattern, fp =<
Figure 5.1: An example of round-robin prediction for top K Apps
00:15, and Calendar has one specific time 10:50. Given the query time 09:30, the time distance of Gmail is 1/58, Alarm is 1/120 and Calendar is 1/80. Thus, the usage probability of periodicity of Gmail App is (1/58) / (1/58 + 1/120 + 1/80).
5.2 Top K Apps Prediction
The goal of top K Apps prediction is to predict the Apps which are likely used by the user at the query time from a set of Apps usage patterns with multiple features. We propose two algorithms to derive a list of top K Apps. One is the naive prediction and another one is adaptive prediction.
5.2.1 Naive Prediction Algorithm
Due to a user’s Apps usage patterns may include various features, round-robin selection is a naive approach to generate a list of top K Apps from Apps usage probability model with multiple features. A round robin is an arrangement of choosing all elements in a group equally in some rational order. The naive prediction algorithm is designed by the concept of round-robin selection. In each round of naive prediction algorithm, we select Apps according to the probability of each feature
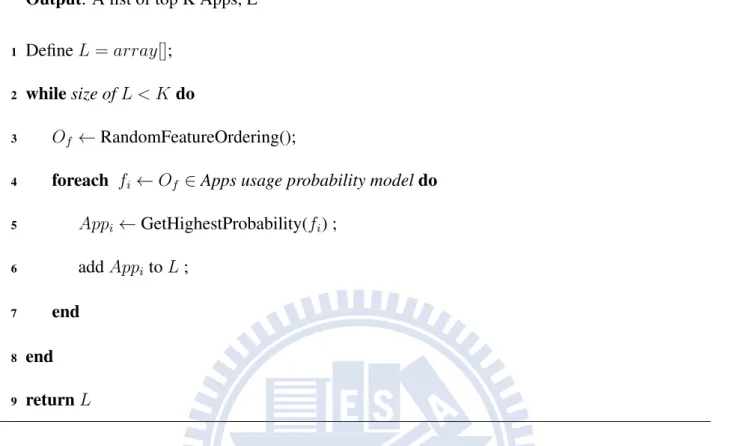
sequen-Algorithm 1: Naive Prediction
Input: Apps usage probability model, K Output: A list of top K Apps, L
Define L = array[]; 1 while size of L < K do 2 Of RandomFeatureOrdering(); 3
foreach fi Of 2 Apps usage probability model do
4 Appi GetHighestProbability(fi) ; 5 add Appito L ; 6 end 7 end 8 return L 9
tially and equally. Given a set of a user’s Apps usage patterns which formulated as the Apps usage probability model, the naive prediction algorithm generates the top K list of Apps by selecting one Apps based on the probabilities of each feature sequentially until the top K Apps are extracted. The naive prediction algorithm is shown in Algorithm 1.
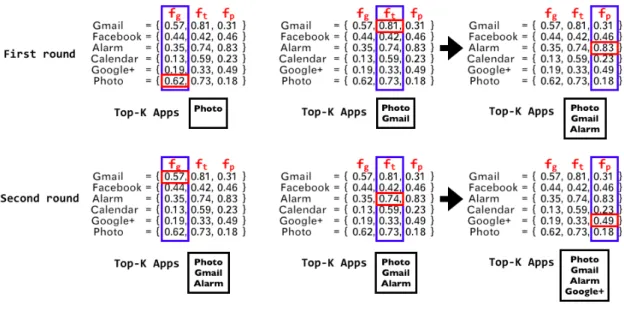
Figure 5.1 shows an example of the naive prediction algorithm. First of all, the feature selection
order is randomly determined as fg-ft-fp. In the first round, the App with the highest probability
is selected from the global f requency, fg, which is the Phone App, and then the App with the
highest probability is selected from the temporal frequency, ft, which is the Gmail App. Finally, the App with the highest probability is selected from the periodicity, fp, which is the Alarm App. In the second round, we start selecting the Apps with second highest probability from each feature
Figure 5.2: An example of adaptive prediction for top K Apps
should be considered to improve the prediction accuracy. In our prediction problem, we attempt to predict a user’s App usage at the query time, i.e., what Apps may be likely used by the user at a specific time from the user’s App usage probability model. The App usage probability model
includes three App usage features: global f requency, temporal f requency, and periodicity.
Global f requency represents the overall usage frequency of the App. T emporal f requency
means the App is used frequently at the certain duration of time. P eriodicity indicates the usage of the App occurs in a certain period repeatedly and under the period exists the specific times. For a prediction at the specific query time, we suppose that the periodicity has the greatest predictive
influence than others and temporal f requency has greater influence than global f requency.
In our experiment, we will verify that this feature selection ordering is the optimal combination for prediction accuracy. Based on the concept of feature selection ordering, we propose an adaptive prediction algorithm.
5.2.2 Adaptive Prediction Algorithm
In adaptive prediction algorithm, we first evaluate and extract the possible Apps from the App usage probability model, and then, we present a probability value, pv, to constrain the usage probability for the list of top K Apps generation, and a decreasing factor, df, to decrease the pv when the number of Apps is not reach to K. To generate the number of K ranking Apps, there is one or more
Algorithm 2: Adaptive Prediction
Input: Apps usage probability model, K, pv and df Output: A list of top K Apps, L
Define L = array[]; 1
Set p = user defined pv; 2
while size of L < K do 3
foreach fi fp - ft- fg 2 Apps usage probability model do
4
foreach Appi 2 fido
5
if probability of Appi >= p and size of L < K then ; 6 add Appito L; 7 end 8 end 9 p = p⇤ df 10 end 11 return L 12
than one round to select the Apps. In the first round, the adaptive prediction algorithm selects the Apps of which the usage probability of periodicity is larger or equal than pv, and then selects the
Apps of which the usage probability of temporal f requency is also larger or equal than pv, and
finally selects the global f requency as the same way until picks number of K Apps. If there is
no probability of Apps larger or equal than pv or the number of Apps does not reach to K, the pv is decreased by multiplying the decreasing factor df and goes to the next round to pick Apps until
our experimental results for the high accuracy. Second, a set of candidate Apps are extracted from Apps usage probability model, as shown in line 4 to 5. Third, an ordering list of Apps is generated by adaptive prediction under pv, as shown in line 6 to 7. Last, if the number of Apps does not reach to K, the pv is decreased by the decreasing factor df, as shown in line 11, and then repeat to the second step. As the selected Apps reach to K, the adaptive prediction algorithm ends and returns the top K Apps list.
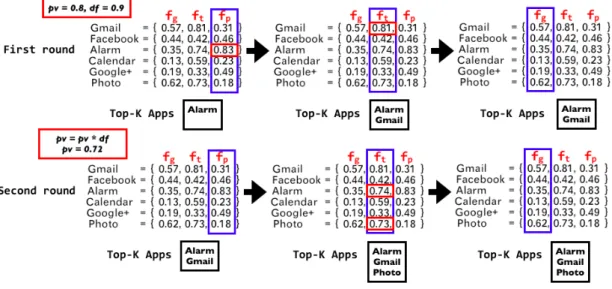
Figure 5.2 shows an example of the adaptive prediction algorithm. Given the pv as 0.8 and the df as 0.9, in the first round, the Apps of which probabilities are higher than pv are selected from the periodicity, fp, which is the Alarm App, and then the Apps of which probabilities are higher than
pv are selected from the temporal f requency, ft, which is the Gmail App. Lastly, the Apps of
which probabilities are higher than pv are selected from the global frequency, fp, but there is no Apps of which probabilities are higher than pv. Since the number of Apps is not reach to the user defined K, the adaptive prediction goes to the second round and the pv is decreased by the df and continue selecting the Apps under the pv until the number of Apps reaches to K.
Chapter 6
Experiments
In this section, we evaluate our proposed methods for Apps usage patterns and the prediction algo-rithms. All algorithms in our system are implemented in the Java and PHP language on a Linux operating system computer with Intel Xeon Core 4 CPU (2.66GHz) and 8GB memory.
6.1 Dataset
To evaluate our proposed methods for Apps usage pattern based prediction, we conduct extensive experiments on real datasets and synthetic datasets. In real datasets, there are two Apps usage logs dataset, one is HTC dataset and another is Nokia dataset. For HTC dataset, we collect 15 participants’ usage logs from July to December in 2010 by installing a monitoring program in their mobiles. For Nokia dataset, the data was conducted by the Nokia Research Center and the data was collected almost 80 participants from October 2009 to February 2011. Both usage logs datasets are used 60% for training data and 40% for testing data. Table I shows the statistical information of Apps for our real datasets. Moreover, for evaluating the effectiveness of feature detection for Apps usage pattern discovery, we generate the synthetic datasets from real data. Each synthetic dataset
6.2 Evaluation measurement
To evaluate the accuracy and effectiveness of our proposed method, we use precision and mean reciprocal rank MRR [27] for our evaluation measures. P recision is to evaluate how many times of Apps prediction predicts correctly. In other words, precision represents the hit rate for prediction, and it is defined as follows:
P recision = | clicked |
| prediction | (1)
M RRis used to evaluate the ranking of Apps. The App with high usage probability should be
ranked highly. The reciprocal rank of an App is the inverse rank in top K Apps list and the mean reciprocal rank is the average of the reciprocal ranks. The value of MRR is computed as follows, where Q is the number of query and rank is the rank of the predicting App.
M RR = 1 | Q | |Q| X i=1 1 ranki (2)
P recision can be seen as a measure for the accuracy of fidelity, and MRR is a measure for
effectiveness of a predictive App.
6.3 Competitors
To evaluate our proposed prediction algorithm, we compare our proposed algorithm, adaptive pre-diction and naive prepre-diction of Apps usage pattern based prepre-diction method(AUP), which are ab-breviated as AUP-AP and AUP-NP with other methods in our experiments. Table II lists all the
HTC Nokia
No. of Avg. Usages of a User 3492 2918
No. of Avg. Apps of a User 53 41
No. of Avg. Daily Apps of a User 21 16
competitors in our experiments. PP is the method that only consider the probability of periodicity
for prediction. TFP is the method that consider the probability of temporal f requency and GFP
uses the probability of global frequency for prediction. Besides, RUP is the existing solution for Apps prediction, which uses the recent used Apps for prediction.
Abbreviation Method
PP Periodicity based Prediction
TFP Temporal-frequency based Prediction
GFP Global-frequency based Prediction
RUP Recent used Prediction
Table II: Statistics information of our real dataset
6.4 Parameters
Table III lists all the parameters used throughout the experiments. All the parameters are set to be the default values unless specified explicitly. In Apps usage pattern discovery, the parameters bks, clus, and var are used: bks is the size of the temporal bucket for temporal-frequency feature discovery,
clus and var are the clustering threshold and the value of the periodgram partition for periodicity
feature discovery. Moreover, in our proposed Apps usage pattern based prediction method, AUP, the probability value pv and the decreasing df need to be given for the adaptive prediction, which
pv is to constrain the probability of Apps to select the top K Apps and df decrease the pv when then
number of Apps is not reaching to K. In our experiments, these parameters are analyzed for effective prediction.
Abbreviation Explanation Default value
bks the size of the temporal bucket 60
clus the threshold of the hierarchal clustering 20
var the partition of the periodgram 50
pv the probability value 0.8
df the decreasing factor 0.9
Table III: Parameter Settings
(a) Precision (b) MRR
Figure 6.1: Prediction accuracy comparison on HTC dataset
6.5 Evaluation Results
6.5.1 Prediction accuracy comparison
First, we investigate the Apps prediction on the real datasets with comprehensive features, HTC and Nokia datasets. Figure 6.1 is the prediction comparison of different methods for HTC dataset. Figure 6.1(a) shows the prediction results by the precision varying with K. In general, the precision increases as K increasing. The experimental result shows that the PP, TFP, GFP, and RU can not predict Apps precisely even the larger K. In addition, AUP-NP improves the precision but it also can
(a) Precision (b) MRR
Figure 6.2: Prediction accuracy comparison on Nokia dataset
not predict the Apps very precisely because it dose not consider the feature selection ordering and the usage probability of the top K Apps for prediction. Obviously, the precision of the proposed AUP-AP is significantly improved and the precision even can get 1 when K is 7, which shows AUP-AUP-AP can capture the Apps usage behavior accurately. In addition, we evaluate the order of the predicted the list of top K Apps. Figure 6.1(b) shows the MRR results by different prediction approaches. The values of MRR are computed by the inverse rank of the Apps, and the value of the AUP-AP is much larger than other methods, because its predicting Apps of correctness are ranked high. Figure 6.2 is the prediction accuracy comparison of different approaches for the Nokia dataset. Similarly, our proposed method AUP-NP and AUP-AP outperforms other methods.
Second, we examine the effectiveness of our proposed methods for the usage feature detection of Apps usage pattern under the synthetic dataset with different usage features. The synthetic datasets are generated from real dataset with each feature of App usage behavior respectively. Figure 6.3 shows the the prediction accuracy comparison under different usage features. In Figure 6.3(a), the synthetic data is generated according to the feature of periodicity. As expected, PP has higher precision than other methods and the precision is able to reach to 0.6 even if K is 3. It shows that our
(a) Periodicity only (b) Temporal-frequency only
(c) Global-frequency only
Figure 6.3: Prediction accuracy comparison under synthetic dataset with different usage features Apps usage pattern is effective. Figure 6.3(c) shows the prediction results under the synthetic data is generated based on the feature of global frequency. As can be seen in Figure 6.3(c), our proposed
method GFP for discovering the feature of global f requency is effective as well. With different
synthetic data based on different usage features, the experimental results shows that our proposed methods can discover the features of Apps usage patterns effectively.
Third, in our proposed prediction method, AUP-AP, we address that the feature selection order-ing is critical for prediction accuracy. For the prediction at a specific query time, we suppose that the feature selection ordering is determined by first checking the specific time, then the duration of time and last the overall usage frequency, which means the ordering is periodicity, temporal
Figure 6.4: MRR for different feature selection ordering
ordering for prediction accuracy. P represents the feature of periodicity, T represents the feature of
temporal f requencyand G represents the feature of global f requency. The experimental
re-sults shown in Figure 6.4, the feature ordering for first periodicity, then temporal frequency and
last global f requency has the highest effectiveness for prediction. Therefore, the experimental
results prove that our supposed feature selection order P-T-G is the optimal and effective selection order for AUP-AP algorithm.
6.5.2 Sensitivity Analysis
We study the effect of the parameters in the Apps usage pattern discovery and AUP-AP for predic-tion. First, we analyze the effect of the parameters on the Apps usage pattern discovery. To discover the feature of temporal frequency in the Apps usage pattern, the size of the temporal bucket, bks, needs to be given. We analyze the effect of various bks on prediction accuracy. Figure 6.5(a) shows the experimental results as the precision varies with bks. When bks is 60 minutes, TFP, AUP-NP and AUP-AP all result in the highest precision. We also observe that when bks is 30 minutes, they also have high precision. As a result, setting bks as 30 minutes to 60 minutes has better prediction
(a) Bucket size (bks) (b) Clustering threshold (clus)
(c) Partition threshold (var)
Figure 6.5: Parameter analysis for Apps usage pattern discovery
small to capture enough behavior information among few App-pieces in the later process. From the experimental result, when clus is 20, it is a reasonable setting for high precision. To discover the specific times of the App, the value of the periodgram partition, var, is the control parameter. The value of var 50 means that the two partitions should be merged if the variance is smaller than 50 after merging. As Figure 6.5(c), when the value is set to 0 which means no partition, the precision is the worst (about 40%). As setting var to 50 is the best precision in our datasets.
Second, in our proposed Apps usage pattern based prediction method, adaptive prediction (AUP-AP), the probability value pv and df need to be given. Figure 6.6 shows the prediction precision varies with pv and df in AUP-AP. In Figure 6.6(a), the precision increases before pv as 0.8. After pv as 0.8, the precision almost close to the gentle. Setting the initial pv should be high. The reason is
(a) Probability value (b) Decreasing factor
Figure 6.6: Parameter analysis for CAP
that, for the first round picking in AUP-AP, the pv needs to constrain the usage probabilities of the top K Apps, and for next round, the pv decreases by the df. For df, in Figure 6.6(b), the pv is set as 0.9 is the most effective for prediction. Since the df can not decrease the pv too much, when pv as 0.8 and df as 0.5 for the first round, the next round pv will be 0.8*0.5 = 0.45 so that pv can not constrain the probability of Apps for each features. We observe that when df as 0.9, the pv decrease gently. For example, when pv as 0.8 and df as 0.9 for the first round, the second round pv will be 0.8*0.9 = 0.72, and the third round pv will be 0.72*0.9 = 0.64. Due to df as 0.9, the pv can constrain the probability of Apps precisely and pv does not decrease abruptly. If we set the df as 1, the pv does not decrease anymore. Therefore, in AUP-AP, we suggest that the pv and df are set as 0.8 and 0.9 to result in the highest precision for our datasets.
6.6 Conclusion
In this paper, we present a novel approach to predict users’ Apps usage intentions at the query time. By observing the Apps usage logs, we define the Apps usage pattern which consists of three
usage features, including global f requency, temporal f requency and periodicity. We also
propose the methods for discovering users Apps usage patterns from their Apps usage logs for Apps prediction. Moreover, we propose an Apps usage pattern based prediction method, AUP, which first formulate a user’s Apps usage patterns as probabilities of execution Apps for our presented Apps usage probability model, and then we propose two prediction algorithm, naive prediction and adaptive prediction, which select adequately the Apps from the three features of Apps usage probability model for top K Apps prediction. Our comprehensive experiments demonstrate that our techniques are accurate and efficient for the App usage prediction.
Bibliography
[1] H. Ma, H. Cao, Q. Yang, E. Chen, and J. Tian, “A habit mining approach for discovering similar mobile users,” in Proc. of WWW, 2012, pp. 231–240.
[2] H. Cao, T. Bao, Q. Yang, E. Chen, and J. Tian, “An effective approach for mining mobile user habits,” in Proc. of CIKM, 2010, pp. 1677–1680.
[3] D. Lymberopoulos, P. Zhao, A. C. K¨onig, K. Berberich, and J. Liu, “Location-aware click prediction in mobile local search,” in Proc. of CIKM, 2011, pp. 413–422.
[4] J. Yi, F. Maghoul, and J. O. Pedersen, “Deciphering mobile search patterns: A study of yahoo! mobile search queries,” in Proc. of WWW, 2008, pp. 257–266.
[5] J. Yi and F. Maghoul, “Mobile search pattern evolution: The trend and the impact of voice queries,” in Proc. of WWW, 2011, pp. 165–166.
[6] D. Choujaa and N. Dulay, “Predicting human behavior from selected mobile phone data points,” in Proc. of UbiComp, 2010, pp. 105–108.
[7] V. W. Zheng, B. Cao, Y. Zheng, X. Xie, and Q. Yang, “Collaborative filtering meets mobile recommendation: A user-centered approach,” in Proc. of AAAI, 2010.
[8] P. H. Chia, Y. Yamamoto, and N. Asokan, “Is this app safe?: A large scale study on application permissions and risk signals,” in Proc. of WWW, 2012, pp. 311–320.
[11] H. Jeung, Q. Liu, H. T. Shen, and X. Zhou, “A hybrid prediction model for moving objects,” in Proc. of ICDE, 2008, pp. 70–79.
[12] A. Monreale, F. Pinelli, R. Trasarti, and F. Giannotti, “Wherenext: A location predictor on trajectory pattern mining,” in Proc. of KDD, 2009, pp. 637–646.
[13] D.-A. Chiang, Y.-H. Wang, and S.-P. Chen, “Analysis on repeat-buying patterns,” Knowledge-Based Systems, vol. 23, no. 8, pp. 757–768, 2010.
[14] G. Amodeo, R. Blanco, and U. Brefeld, “Hybrid models for future event prediction,” in Proc. of CIKM, 2011, pp. 1981–1984.
[15] P. Cui, F. Wang, S. Liu, M. Ou, S. Yang, and L. Sun, “Who should share what?: Item-level social influence prediction for users and posts ranking,” in Proc. of SIGIR, 2011, pp. 185–194. [16] D. Zhou, S. Zhu, K. Yu, X. Song, B. L. Tseng, H. Zha, and C. L. Giles, “Learning multiple
graphs for document recommendations,” in Proc. of WWW, 2008, pp. 141–150.
[17] C. Christakou, S. Vrettos, and A. Stafylopatis, “A hybrid movie recommender system based on neural networks,” International Journal on Artificial Intelligence Tools, vol. 16, no. 5, pp. 771–792, 2007.
[18] M. van Setten, M. Veenstra, A. Nijholt, and B. van Dijk, “Prediction strategies in a tv recom-mender system - method and experiments,” in Proc. of IADIS, 2003, pp. 203–210.
[19] M. Balabanovic, “Exploring versus exploiting when learning user models for text recommen-dation,” User Modeling and User-Adapted Interaction, vol. 8, no. 1-2, pp. 71–102, 1998. [20] J. Bollen, M. L. Nelson, R. Araujo, and G. Geisler, “Video recommendations for the open
video project,” in Proc. of JCDL, 2005, p. 369.
[21] Y. Z. Wei, L. Moreau, and N. R. Jennings, “Learning users’ interests by quality classification in market-based recommender systems,” IEEE Transaction on Knowledge and Data Engineering, vol. 17, no. 12, pp. 1678–1688, 2005.
[22] S. Baluja, R. Seth, D. Sivakumar, Y. Jing, J. Yagnik, S. Kumar, D. Ravichandran, and M. Aly, “Video suggestion and discovery for youtube: Taking random walks through the view graph,” in Proc. of WWW, 2008, pp. 895–904.
[23] M. Vlachos, P. Yu, and V. Castelli, “On periodicity detection and structural periodic similarity,” in Proc. of SDM, 2005.
[24] L. Chen, M. T. ¨Ozsu, and V. Oria, “Robust and fast similarity search for moving object trajec-tories,” in Proc. of SIGMOD, 2005, pp. 491–502.
[25] J. Yuan, Y. Zheng, X. Xie, and G. Sun, “T-drive: Enhancing driving directions with taxi drivers’ intelligence,” IEEE Transactions on Knowledge and Data Engineering, 2011.
[26] C. D. Manning, P. Raghavan, and H. Sch¨utze, Introduction to Information Retrieval. Cam-bridge University Press, 2008.
[27] D. R. Radev, H. Qi, H. Wu, and W. Fan, “Evaluating web-based question answering systems,” in Proc. of LREC, 2002.