A method for measuring the complex refractive index of
a turbid medium
Zhi-Cheng Jian
a, Jiun-You Lin
b, Po-Jen Hsieh
a,Huei-Wen Chen
a, and Der-Chin Su*
a aInstitute of Electro-Optical Engineering, National Chiao Tung University,
1001 Ta-Hsueh Road, Hsin-Chu 30050, Taiwan, R.O.C.
b
Department of Mechatronic Engineering, National Changhua University of Education,
No. 2, Shi-Da Road, Changhua City 20056, Taiwan, ROC.
ABSTRACTBased on the heterodyne interferometry and Fresnel equations, an alternative method for measuring the complex refractive index of a turbid medium. A light beam is incident on the boundary between a right-angle prism and a turbid medium. The phase difference between s- and p- polarizations of the reflected light occurs. The phase difference depends on then incident angle and the complex refractive index of a turbid medium; their relation can be derived from Fresnel equations. The phase difference can be measured accurately with the heterodyne interferometry. Because there are two unknown parameters to be estimated, at least the phase differences under two different conditions should be measured. Then, these measured data are substituted into the derived relation, and a set simultaneous equation is obtained. If the simultaneous equation is solved, the complex refractive index can be estimated. Because the reflected light from the boundary is measured, the scattering noises coming from the turbidity of the tested medium can be greatly reduced. In addition, this method has some merits such as simple optical setup, high sensitivity, high stability, and suitability for a little amount of the tested medium in its native state (without dilution).
Keyword: heterodyne interferometry, complex refractive index, turbid medium.
1. INTRODUCTION
A turbid medium is an important biochemical medium. Its complex refractive index is not only related with concentration, temperature, pressure, and wavelength, but also depends strongly on its quality. For example, there is an obvious complex refractive index difference between normal and abnormal tissues, which might be caused by the diseases1,2. Hence the measurement of complex refractive index can be used as an alternative method to judge the quality of a turbid medium. There are several methods for measuring the complex refractive index such as R-versus-θ method
(reflectance versus incident angle method)3, critical angle method4,5, and ellipsometry6. In those methods, the reflectances at several incident angles are measured, they are substituted into Fresnel equations7 to calculate the complex refractive index. Because the scattering property8 of a turbid medium, those methods are difficult to measure a turbid medium accurately.
To overcome the drawback, an alternative method for measuring the complex refractive index of a turbid medium is presented in this paper based on the heterodyne interferometric technique and Fresnel equations. As a light beam is incident on the boundary between a high refractive index prism and the tested turbid medium, the phase difference between the s- and p- polarization components of the reflected light occurs. It can be measured accurately with the heterodyne interferometric technique. Because there are two unknown parameters, two phase differences at two different incident angles should be measured. If these data are substituted into the special equation derived from Fresnel equations, then the complex refractive index can be obtained. Compared with the general biological assay9, this method needs not to add any extra reagent to dilute the tested turbid medium for testing. So this method can avoid damaging the property of the sample. In addition, this method has several merits, including a simple optical setup, easy operation, high stability, high measurement accuracy, and rapid measurement. We demonstrate its feasibility.
2. PRINCIPLE
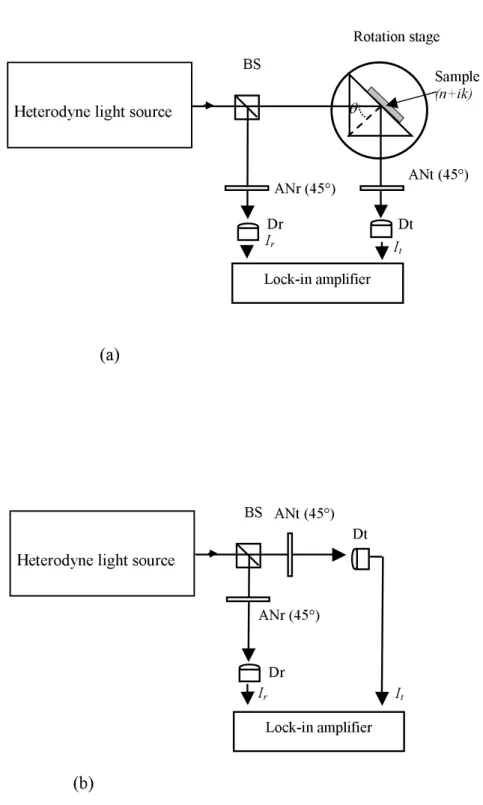
Fig. 1 Schematic diagrams for measuring the phase differences owing to the reflections at (a) the boundary between a prism and a turbid medium, and (b) BS. BS: beam-splitter; AN: analyzer; D: photo detector.
(a) Sample (n+ik) Rotation stage Lock-in amplifier BS θ ANr (45°) ANt (45°) Dr Dt Ir It
Heterodyne light source
(b) BS Lock-in amplifier ANr (45°) ANt (45°) Dr Dt Ir It
The schematic diagram of this method is shown in Fig. 1(a). A light beam coming from a heterodyne light source is incident on a beam-splitter BS and divided two parts: the transmitted light and the reflected light. The transmitted light is incident at θ on the boundary between a high refractive index prism and the tested turbid medium. Both of them are
located on a rotation stage. The light beam reflected from the boundary passes through an analyzer ANt and enters a photo detector Dt. If the amplitude of the light detected by Dt is Et, then the intensity measured by Dt is I =t Et 2. Here, It acts as a test signal. On the other hand, the reflected light at BS passes an analyzer ANr and enters a photo detector Dr. If the amplitude of the light detected by Dr is Er, then the intensity measured by Dr is I =r Er 2. Here, Ir acts as a reference signal. Finally, these two signals are sent to a lock-in amplifier and the phase difference between them can be measured.
2.1 Heterodyne light source
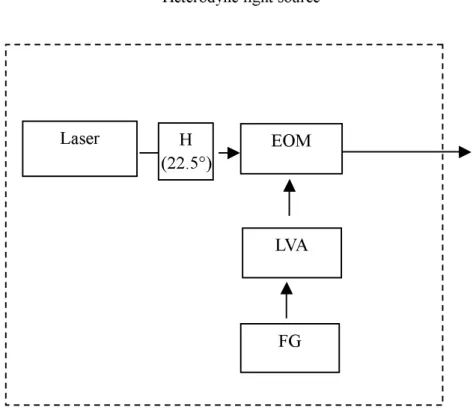
The heterodyne light source consists of a linearly polarized laser light source, a half-wave plate H, and an electro-optic modulator EOM as shown in Fig. 2. EOM is driven by an external saw tooth voltage signal with angular frequency ω and
amplitude
2 λ
V , the half-voltage of EOM. That signal comes from a function generator FG and a linear voltage amplifier LVA. For convenience, the +z-axis is chosen to be along the light propagation direction and the x-axis is along the direction perpendicular to the paper plane. Let the laser light be horizontally linearly polarized, the fast axis of EOM and H be 45° and 22.5° with respect to the x-axis, respectively.
Fig. 2 Schematic diagram for the heterodyne light source. EOM: electro-optic modulator; LVA: linear voltage amplifier; FG: function generator.
Laser EOM
FG
Heterodyne light source
LVA H
2.2 Phase-difference between s- and p-polarizations of reflected light
Fig. 3 The reflection at the boundary between a prism and a tested medium.
A ray of light is incident atθon the base surface of a right-angle prism with refractive index ng as shown in Fig. 3. At the base surface of the right-angle prism, there is a boundary between the prism and the turbid medium. Its complex refractive index is n + ik, where n is the refractive index and k is the extinction coefficient. According to the Fresnel
equations, the amplitude reflection coefficients of s- and p- polarizations can be express as
(
)
(
)
s( )
s s cos exp cos δ θ θ i r iv u n iv u n r g g = + + + − = , (1)(
)
(
)
p( )
p 2 2 p cos exp cos δ θ θ r i iv u n N iv u n N r g g = + + + − = , (2) respectively, where(
) (
[
)
]
+ − − + − − = 2 1 2 2 2 2 2 2 2 2 2 2 2 2 sin sin 4 2 1 n k n n k n n k u g θ g θ , (3a)(
) (
[
)
]
+ − − + − − − = 2 1 2 2 2 2 2 2 2 2 2 2 2 2 sin sin 4 2 1 n k n n k n n k v g θ g θ , (3b) sδ and δp are the phase shifts of s- and p- polarizations, and they can be expressed as
− + = − θ θ δ 1 2 2 2
s tan u 2vvcoscos , (4a)
45° θ
n+ik
[
]
(
)
+ − + − − = − θ θ δ 2 2 2 2 2 2 2 2 2 1 p cos 2 cos 2 tan k n v u u k n v , (4b) respectively. Hence, the phase difference of s-polarization relative to p-polarization can be written as + − = − = − bd ac bc ad 1 p s δ tan δ φ , (5a) where
(
)
(
)
cos . , 2 cos 2 , cos , cos 2 2 2 2 2 2 2 2 2 2 2 2 2 θ θ θ k n v u d u k n v c v u b v a + − + = − − = − + = = (5b)2.3 Estimation of complex refractive index
If both the transmission axes of the analyzers ANr and ANt are located at 45° with respect to the x-axis, then we have
(
)
[
r]
r = 21 1+cosω +t φ I , (6a) and(
)
− + + = r r r r ωt φ I cos 2 2 2 1 p s 2 p 2 s t , (6b)where φr is the phase difference between s- and p- polarizations that is due to the reflection at BS. The reference signal
Ir and the test signal It are also the sinusoidal signals of a frequency difference ω. These two signals are sent to a lock-in amplifier, the phase difference
r
' φ φ
φ = − (7)
can be obtained. In the second measurement, let the transmitted light at BS enter photo detector Dtdirectly without the reflection in the right-angle prism, as shown in Fig. 1(b). The test signal still has the form of Eq. (6b) but this time with
0 =
φ . Therefore the lock-in amplifier in Fig. 1(b) represents −φr. Substituting −φr into Eq. (7), we obtain the
phase difference φ.
From Eqs.(1)~(5), it is obvious that the phase difference φ is the function of n, k, and θ , and φ can be
experimentally measured for a given θ. To evaluate the values of n and k we require two phase differences φ1 and
2
φ that correspond to two incident angles, θ1 and θ2. Hence a set of simultaneous equations
(
1)
1 1 φ , ,θ φ = n k , (8a)(
2)
2 2 φ , ,θ φ = n k . (8b)is obtained. Because θ1 and θ2 are given, the two parameters, n and k, can be estimated by using the Numerical
′ − ′ − ⋅ ∂ ∂ ∂ ∂ ∂ ∂ ∂ ∂ − = − + 2 2 1 1 1 , 2 2 1 1 1 φ φ φ φ φ φ φ φ k n m m k n k n k n k n , (8c) where m is the number of calculated times. The complex refractive index of a turbid medium can be estimated by using this analysis.
3. EXPERIMENTS AND RESULTS
material θ1 θ2 φ1 φ2 n k ∆n ∆k ° 5 . 49 50° − 929. ° −15.68° 1.3464 0.0009 0.0002 0.0007 Milk ° 50 50.5° −15.64° −19.38° 1.3465 0.0008 0.0002 0.0007 Table. 1Experimental conditions and measurement results
In order to show the feasibility of this method, we measured the complex refractive index of commercial whole milk at 25°C. The heterodyne light source consisting of a He-Ne laser with 632.8 nm wavelength and an electro-optic modulator
EOM driven by a function generator FG and a linearly voltage amplifier LVA was used. The frequency difference between p- and s- polarizations was 1 kHz. A lock-in amplifier with resolution 0.01° (Model SR850, Stanford Research
System) was used to measure the phase difference, and a personal computer was employed to record and analyze the data. A right-angle prism made of SF11 glass with refractive index ng= 1.77862 and the tested medium were mounted on a high-precision rotation stage (SGSP-160YAW, Japan Sigma Koki Ltd.) with the angular resolution of 0.0025°. The
experimental conditions and measured results are summarized in Table 1.
4. DISCUSSIONS
Because φ is the function of θ, we should choose two optimal incident angles to get better resolution. According to Ref. 11, the measured resolution is almost proportional to the integration result of the following integral
dndk k n k n S ∞ ∞
∫ ∫
∂ ∂ ∂ ∂ − ∂ ∂ ∂ ∂ = 0 0 2 2 1 1 φ φ φ φ . (9)Substituting our experimental conditions into Eq. (9), we get that when the incident angles are in the neighborhood near the critical angle θc, the high resolution measurement can be achieved. Here the critical angle θc is defined as
= − g c sin 1 nn θ . (10) In our experiments, we have θc =49.2°. Hence two conditions 49.5o
1 =
θ and θ2 =50.0o and θ1=50.0o and
o 5 . 50 2 = θ were chosen.
k n k n k k n ∂ ∂ ∂ ∂ − ∂ ∂ ∂ ∂ ∆ ∂ ∂ + ∆ ∂ ∂ ≅ ∆ 1 2 2 1 2 1 1 2 φ φ φ φ φ φ φ φ , (11a) and k n k n n n k ∂ ∂ ∂ ∂ − ∂ ∂ ∂ ∂ ∆ ∂ ∂ + ∆ ∂ ∂ ≅ ∆ 1 2 2 1 1 2 2 1 φ φ φ φ φ φ φ φ , (11b)
where ∆n and ∆k are the errors in n and k, and ∆φ1 and ∆φ2 are the errors in the phase differences φ1 and
2
φ , respectively. The angular resolution of a lock-in amplifier, second harmonic error, and polarization-mixing errors are the factors that may influence the accuracy in the phase difference errors in this method. So the total phase difference errors of ∆φ1 and ∆φ2 can be decreased to 0.03°12 in our experiments. Substituting the conditions ∆φ1 = ∆φ2 = 0.03° into Eqs. (11.a) and (11.b), the measurement errors ∆n and ∆kof this method are calculated and listed also at
the last two columns in Table 1.
In our experiments, two random incident angles were chosen firstly to obtain the approximate value of n. Secondly the
incident angles were changed to in the neighborhood near the critical angle θc derived from the approximate value of n,
the phase differences were measured again. So the measured results with high resolution can be performed. Because the reflected light from the boundary between a prism and the tested turbid medium is measured, so this method can be applied to test the opaque turbid medium with scattering property. Even a drop of the test turbid medium can be measured, too. Owing to its common path configuration and heterodyne interferometric phase measurement, it has many advantages such as high stability against air turbulence and environmental vibrations, high resolution, and rapid measurement.
5. CONCLUSION
An alternative method for measuring the complex refractive index is proposed. First, the phase difference between s- and p- polarizations of the reflected light at boundary between a prism and the tested turbid medium are measured at two different incident angles. The measured data are substituted into specially derived equation from Fresnel equations, and then the complex refractive index of turbid can be obtained. It has both merits of the common path interferometer and the heterodyne interferometer. And its feasibility was demonstrated.
6. ACKNOWLEDGEMENT
REFERENCES
1. B. B. Das, F, Liu, and R. Alfano, Rep. Prog. Phys. 60, 227 (1995).
2. G. Miller and A. Rogan, eds., Laser-Induced Interstitial Thermotherapy (SPIE Press, Bellingham, Wash., 1995). 3. R. M. A. Azzam, “Maximum minimum reflectance of parallel-polarized light at interfaces between transparent and
absorbing media”, J. Opt. Soc. Am., 73, 959-962 (1983).
4. A. Garcia-Valenzuela, M. C. Pena-Gomar, and C. Fajardo-Lira, “Measuring and sensing a complex refractive index by laser reflection near the critical angle”, Opt. Eng. 41, 1704-1716 (2002).
5. M. Saito, N. Matsumoto, and J. Nishimura, “Measurement of the complex refractive-index spectrum for birefringent and absorptive liquids”, Appl. Opt. 37,5169-5175 (1998).
6. E. Collett, “Polarized light: fundamentals and applications”, Measurement Concepts Inc., New Jersey, 515-556 (1993).
7. B. E. A. Saleh and M. C. Teich, in: Fundamentals of Photonics, Wiley, New York, 1991, p.205.
8. M. Mohammadi, “Colloidal refractometry: meaning and measurement of refractive index for dispersion; the science that time forgot”, Advances in Colloid and Interface Science., 62, 17-29 (1995.)
9. K. STOCK, R. SAILER, W. S. L. STRAUSS, M. LYTTEK, R. STEINER, and H. SCHNECKENBURGER, “Variable-angle total internal reflection fluorescence microscopy (VA-TIRFM): realization and application of a compact illumination device”, Journal of Microscopy, 211, 19-29 (2003).
10. R. L. Burden and J. D. Faires,“Numerical analysis”, PWS Publishing Company, Boston, 553-560 (1993).
11. P. C. Logofatu, D. Apostol, V. Damian, and R. Tumbar, “Optimum angles for determining the optical constants from reflectivity measurements”, Meas. Sci. Technol.7, 52-57 (1996).