國立交通大學
生物資訊及系統生物研究所
碩士論文
以系統化方法辨識出能用於標靶藥物輸送的癌症專一性細
胞膜受體
A Systematic Method for Identifying Cancer-Specific
Membrane Receptors for Targeted Drug Delivery
研究生:黃煒志
指導教授:黃憲達 博士
以系統化方法辨識出能用於標靶藥物輸送的癌症專一
性細胞膜受體
A Systematic Method for Identifying Cancer-Specific
Membrane Receptors for Targeted Drug Delivery
研 究 生:黃煒志
Student: Wei-Chih Huang
指導教授:黃憲達 博士
Advisor: Dr. Hsien-Da Huang
國立交通大學
生物資訊及系統生物研究所
碩士論文
A Thesis
Submitted to Institute of Bioinformatics and Systems Biology
College of Biological Science and Technology
National Chiao Tung University
in partial Fulfillment of the Requirements
for the Degree of
Master
in
Bioinformatics
July 2010
Hsinchu, Taiwan, Republic of China
以系統化方法辨識出能用於標靶藥物輸送的癌
以系統化方法辨識出能用於標靶藥物輸送的癌
以系統化方法辨識出能用於標靶藥物輸送的癌
以系統化方法辨識出能用於標靶藥物輸送的癌
症專一性
症專一性
症專一性
症專一性細胞膜
細胞膜
細胞膜受體
細胞膜
受體
受體
受體
學生:黃煒志 指導教授:黃憲達 博士 國立交通大學 生物資訊及系統生物研究所碩士班
中文摘要
中文摘要
中文摘要
中文摘要
癌症是世界上主要死亡原因之一,目前已研發出相當多種類的抗癌藥作為
治療手段。但是傳統的抗癌藥無法準確輸送到癌症患處,身體上其他正常
的組織會因為抗癌藥的毒性而受到傷害。抗癌藥的副作用既會影響病人的
生活品質,也降低了治療效果,故本研究的目標即為如何將抗癌藥準確送
至 癌 細 胞 。 現 在 的 新 方 法 是 可 將 抗 癌 藥 包 裹 在 免 疫 微 脂 體 中
(immuno-liposome),免疫微脂體表面的特定抗體會因為抗體-抗原親和力
(antigen-antibody affinity)的反應而與癌細胞表面的目標蛋白質結合,達到抗
癌藥對癌細胞的專一性輸送,然後抗癌藥會經由內吞作用進入癌細胞內。
我們以一系統化的方法來分析去氧核醣核酸微陣列(DNA microarray)資
料,以期能找出癌症專一性細胞膜受體(cancer-specific membrane receptor,
CSMR)作為藥物輸送的目標。我們比較了癌症專一性細胞膜受體在癌症組
織與在人體正常組織的 mRNA 表現量,希望能找出在癌症組織中為高表
現、在大部分正常組織中為低表現的癌症專一性細胞膜受體。除此之外,
我們也比較了癌症專一性細胞膜受體於數種癌症細胞株中的表現量。若癌
症專一性細胞膜受體在某癌症細胞株中的表現量與在同類癌症組織中的表
現量相似,該癌症細胞株則建議可用作實驗證明。
A Systematic Method for Identifying
Cancer-Specific Membrane Receptors for
Targeted Drug Delivery
Student: Wei-Chih Huang Advisor: Dr. Hsien-Da Huang Institute of Bioinformatics and Systems Biology,
National Chiao Tung University
Abstract
Cancer is a leading cause of death worldwide. Lots of anti-cancer drugs have
been invented for cancer therapeutics. Traditional anti-cancer drugs with serious
cytotoxicity would cause injuries of normal tissues owing to the incorrect drug
delivery. The side-effects of anti-cancer drugs would not only debase the life
quality of patients but decrease the therapeutic efficacy. The purpose of this
study is to find a way to accurately deliver anti-cancer drugs to cancer cells.
Currently, anti-cancer drugs encapsulated in the immunoliposome would be
specifically transported to cancer cells by the mechanism of antigen-antibody
affinity between the coated antibody of immunoliposome and its target protein
on the surface of cancer cell and then enter the cancer cell by endocytosis. We
propose a systematic method to identify cancer-specific membrane receptors
(CSMRs) as the delivery target by analyzing DNA microarray data. We also
compare the expression level of each CSMR in cancer tissue to that in normal
tissues of body, and expect to identify the CSMR with high expression level in
cancer but generally low expression level in all normal tissues. Besides, we
compare the expression level of each CSMR in several cancer cell-lines. If the
CSMR expression levels of cancer cell-lines are similar to that in the same type
of cancer tissue, the CSMR is recommended for experimental verification.
誌謝
在碩士班生活的這段日子裡,很高興能夠身處於一個很有活力的實驗室。
和善的學長們總是會認真回答學弟的問題,和同儕們也相處地很自在。途
中也有調適不當而使情緒陷入谷底的時候,不過很感謝實驗室各位同仁與
老師的包容,以及家人的關心和支持。
非常感謝豐茂學長給予的協助,不論是在實作過程或是論文寫作上的指導
修正。也深深感謝指導教授黃憲達老師在實作過程中提供的意見以及對於
研究的看法,還有廖光文老師在討論時根據實作情形提出的建議,使得這
份研究能夠更上一層樓。
林林總總的事情多不勝數,一併感謝天。
Contents
中文
中文
中文
中文摘要
摘要
摘要
摘要 ... i
Abstract ...ii
誌謝
誌謝
誌謝
誌謝 ...iii
Contents... iv
List of Tables ... vi
List of Figures ...vii
List of Abbreviations ...viii
1.
Introduction... 1
1.1
Cancer ... 1
1.1.1
Brief Introduction of Cancer ... 1
1.1.2
Highly-Expressed Membrane Receptors in Cancer ... 1
1.2
Microarray... 2
1.3
Targeted Drug Delivery ... 5
1.3.1
Passive and Active Targeted Drug Delivery ... 5
1.3.2
Liposome ... 6
1.4
Motivation and Specific Aims ... 7
2.
Related Studies ... 9
2.1
Integrin targeting ... 9
2.2
Folate receptor targeting ... 9
2.3
Transferrin receptor targeting... 9
3.1
Microarray Data Collection ... 11
3.1.1
Gene Expression Omnibus ... 11
3.1.2
Lung Cancer Microarray Samples... 14
3.2
Genomic Annotation ... 14
3.3
Membrane Receptor Classification... 15
3.4
Proteomic Knowledge ... 15
3.5
Pathway Information of Cellular Processes of Genes ... 16
3.6
Antibody Manufacturers... 16
4.
Method ... 17
4.1
Flowchart Overview... 17
4.2
Data Preprocessing ... 17
4.2.1
Sample Classification... 17
4.2.2
Microarray Data Normalization... 18
4.2.2.1
Robust Multi-array Analysis... 18
4.2.2.2
Data Normalization... 18
4.2.3
Classification of Membrane Receptors ... 19
4.3
Microarray Data Analysis ... 19
4.3.1
Significance Analysis of Microarrays... 20
4.3.2
False Discovery Rate... 22
4.3.5
Comparing Gene Expression of Cancer-Specific Membrane
Receptors between Cancer Tissue and Normal Tissues over Human
Body... 25
5.
Results ... 27
5.1
Statistics of identified CSMRs ... 27
5.2
Case Study: Identifying CSMRs in Lung Adenocarcinoma ... 30
5.3
Web Interface ... 60
6.
Discussions ... 62
6.1
Inconsistent expressions for probesets of the same gene... 62
6.2
Results with few or zero identified CSMRs... 62
6.3
Defining membrane receptors by GO terms ... 62
6.4
Tissue index calculation... 63
6.5
CSMR verification ... 63
7.
Conclusions ... 65
7.1
Conclusions ... 65
7.2
Future works ... 65
8.
References ... 66
9.
Appendix ... 70
List of Tables
Table 1.1 Highly-expressed membrane receptors in cancer... 2
Table 3.1 Statistics of analyzed microarray data of two platforms ... 13
Table 3.2 Statistics of analyzed microarray data... 13
Table 3.3 Microarray data of cancer cell-lines ... 13
Table 3.4 Microarray data of normal human tissues... 14
Table 3.5 Membrane receptors defined by GO terms ... 15
Table 5.1 Statistics of identified CSMRs ... 27
Table 5.2 Analyzed datasets of lung adenocarcinoma... 31
Table 5.3 Identified CSMRs in lung adenocarcinoma dataset, GSE10799,
not disseminate into bone marrow ... 32
Table 5.4 Identified CSMRs in lung cancer dataset, LCH ... 32
Table 5.5 Identified CSMRs in lung adenocarcinoma dataset, GSE7670.... 33
Table 5.6 Identified CSMRs in lung adenocarcinoma dataset, GSE10072.. 34
Table 5.7 Comparisons of identified CSMRs from different datasets ... 34
Table 5.8 Examples of selected CSMR ... 36
Table 5.9 Classification of CSMRs by tissue index ... 37
Table 5.10 Corresponding antibodies of CSMRs ... 60
Table 5.11 Statistics of related literatures of CSMRs in UniProtKB... 60
Table 9.1 NCI60 Cancer cell-lines, 9 tissues (HG-U133A) ... 70
Table 9.2 Cancer cell-lines, 6 tissues (HG-U133A Plus 2.0)... 71
Table 9.3 74 Normal tissues (HG-U133A) ... 74
Table 9.4 65 Normal tissues (HG-U133A Plus 2.0)... 75
Table 9.5 Analyzed datasets and samples (HG-U133A)... 77
List of Figures
Figure 1.1 Hybridization principle of microarray ... 3
Figure 1.2 Affymetrix GeneChip array... 4
Figure 1.3 Graphics of targeted delivery ... 5
Figure 3.1 Statistics of classified cancer datasets ... 12
Figure 3.2 Statistics of microarray samples... 12
Figure 4.1 Workflow for identifying cancer-specific membrane receptors . 17
Figure 4.2 Classification of analyzed microarray datasets ... 18
Figure 4.3 SAM plot ... 22
Figure 4.4 Graphics of definition of GO: Cellular Component... 24
Figure 4.5 Graphics of tissue index ... 26
Figure 5.1 Elucidation of CSMR expression plot... 38
Figure 5.2 Expression of CLDN3 (203953_s_at) in dataset LCH ... 39
Figure 5.3 Expression of CLDN3 (203954_x_at) in dataset LCH ... 40
Figure 5.4 Expression of CLDN4 (201428_at) in dataset LCH ... 41
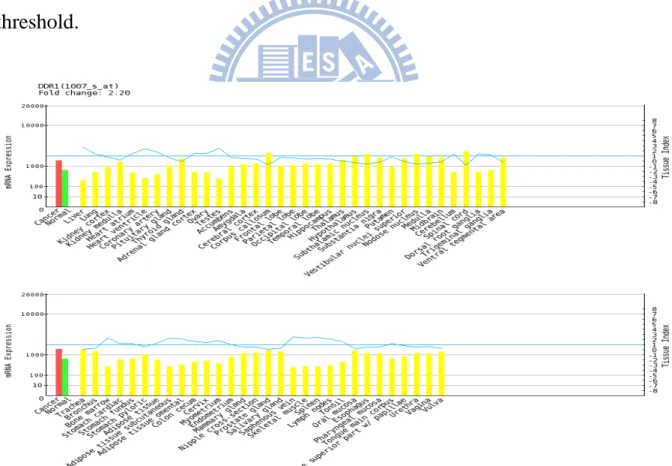
Figure 5.5 Expression of DDR1 (1007_s_at) in dataset LCH... 42
Figure 5.6 Expression of DDR1 (207169_x_at) in dataset LCH ... 43
Figure 5.7 Expression of DDR1 (208779_x_at) in dataset LCH ... 44
Figure 5.8 Expression of DDR1 (210749_x_at) in dataset LCH ... 45
Figure 5.9 Expression of EFNA4 (205107_s_at) in dataset LCH ... 46
Figure 5.10 Expression of EGFR (201983_s_at) in dataset LCH ... 47
Figure 5.11 Expression of ERBB3 (226213_at) in dataset LCH ... 48
Figure 5.12 Expression of F2RL1 (213506_at) in dataset LCH... 49
Figure 5.13 Expression of GPR110 (238689_at) in dataset LCH... 50
Figure 5.14 Expression of IGHG1 (211908_x_at) in dataset LCH ... 51
Figure 5.15 Expression of IGHM (209374_s_at) in dataset LCH... 52
Figure 5.16 Expression of IGHM (216491_x_at) in dataset LCH ... 53
Figure 5.17 Expression of LGR4 (218326_s_at) in dataset LCH... 54
Figure 5.18 Expression of LSR (208190_s_at) in dataset LCH ... 55
Figure 5.19 Expression of MET (203510_at) in dataset LCH... 56
Figure 5.20 Expression of PVRL4 (223540_at) in dataset LCH ... 57
Figure 5.21 Expression of STX1A (204729_s_at) in dataset LCH... 58
Figure 5.22 Expression of XPR1 (222581_at) in dataset LCH... 59
Figure 5.23 Web interface (1): browse from analyzed results... 61
List of Abbreviations
WHO
World Health Organization
CSMR
cancer-specific membrane receptor
NSCLC
non-small cell lung cancer
SCLC
small cell lung cancer
HNSCC
head and neck squamous cell carcinoma
DNA
deoxyribonucleic acid
RES
reticuloendothelial system
PEG
polyethyleneglycol
GEO
Gene Expression Omnibus
NCBI
National Center for Biotechnology Information
LCH
lung cancer microarray dataset, Huang
GO
Gene Ontology
HPMR database
Human Plasma Membrane Receptome database
GPCR
G protein-coupled receptor
UniProtKB
UniProt Knowledgebase
UniProt
Universal Protein Resource
KEGG
Kyoto Encyclopedia of Genes and Genomes
MAS5.0
Microarray Suite User Guide, Version 5
RMA
Robust Multiarray Analysis
FDR
false discovery rate
FWER
family-wise error rate
DEG
differentially expressed gene
1.
Introduction
1.1
Cancer
1.1.1
Brief Introduction of Cancer
Cancer is a disease caused by accumulation of genetic and epigenetic
aberrations within a cell. The cause that normal cells transform to cancer cells is
ascribed to abnormal cell division. Under normal circumstances, cells would
undergo apoptosis if there is a mistake occurred in the cell division progress.
Cancer cells bypass the monitoring mechanism of apoptosis and continue to
increase their population.
According to the reports of WHO, cancer is the leading cause of death
worldwide. It accounts for about 13% of all deaths in 2004 [1]. Currently,
chemotherapy has been the main modality of cancer treatment. However, the
high doses of administration in order to destroy the tumors cannot be given to
patients because the overdose of chemotherapy agents would be fatal to patients.
To increase the efficacy of cancer treatment, researchers focus on targeted
cancer therapies: find genes which play an important role in carcinogenesis and
correct the abnormal mechanisms caused by those target genes. On the other
side, researchers are seeking for targeting agents to promote the efficiencies of
accurately delivering anti-cancer drugs to the tumor site.
1.1.2
Highly-Expressed Membrane Receptors in Cancer
a growth factor binds to the membrane receptor on the cell surface, cell receives
the signal and begins to grow. The abnormality of the membrane receptors in
cancer would cause uncontrolled cell growth. There are several membrane
receptors which are highly-expressed in cancer, such as EGFR in lung cancer
and ERBB2 in breast cancer (Table 1.1
1) [2].
Table 1.1 Highly-expressed membrane receptors in cancer
Gene cancer
EGFR NSCLC; lung squamous cell carcinoma; mesothelioma; breast, head and neck, stomach, colon, esophageal, prostate, bladder, renal, pancreatic, ovarian carcinoma; glioblastoma
ERBB2 breast adenocarcinoma; ovarian carcinoma ERBB3 oral squamous cell and ovarian carcinoma ERBB4 oral squamous cell carcinoma
FLT3 acute myeloid leukemia
KIT gastrointestinal stromal tumor; Ewing's sarcoma; SCLC RET papillary thyroid cancer
FGFR3 multiple myeloma; bladder, cervical carcinoma
MET endocrinal tumor, osteosarcoma, invasive breast and lung cancer
IGF1R colon cancer IL6R myeloma, HNSCC IL8RA bladder cancer
PDGFRA/B osteosarcoma, glioma PRLR breast carcinoma
VEGFR neuroblastoma; prostate cancer GRPR SCLC
1.2
Microarray
DNA microarray is amenable to the analysis of multiple samples, and it
generates a large amount of gene expression data for statistical analysis. The
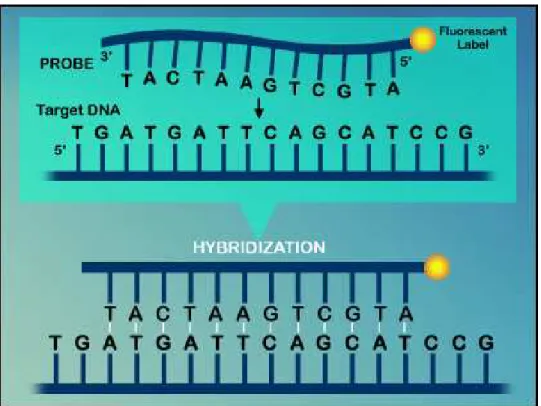
basic principle of microarray technology is complementary hybridization of
nucleotides (Figure 1.1
2). After analyzing the hybridization results and obtaining
the mRNA expression levels, researchers can undergo the advanced analysis to
extract the critical genes by bioinformatic softwares.
Figure 1.1 Hybridization principle of microarray. Target DNA would hybrid to probe by
nucleotide base pairing.
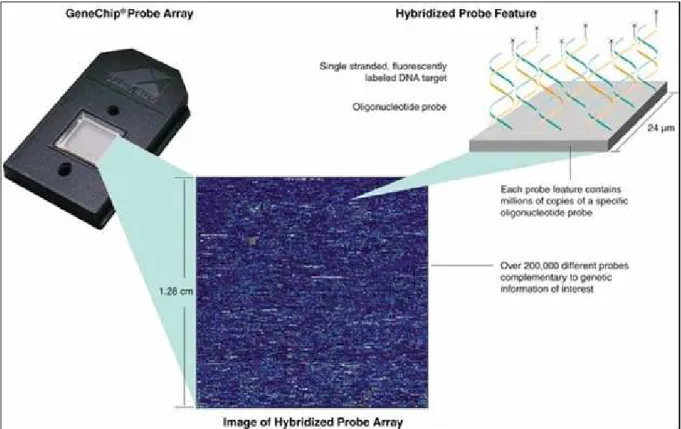
GeneChip (Affymetrix, Santa Clara, CA, USA) is one of the most popular DNA
microarrays (Figure 1.2
3). Generally, GeneChips are designed with 16 to 20,
preferably nonoverlapping 25-mers representing each gene on the array. Each
oligonucleotide on the chip is matched with an almost identical one, differing
only by a central, single-base mismatch. This mismatched oligonucleotide serves
as an internal control for hybridization specificity and allows for determination
2 retrieved from http://www.members.cox.net/amgough/FISH_olgio_hybridization-deep01_01_03.jpg 3
of the degree of non-specific binding by comparison of target binding intensity
between the two partner oligonucleotides.
Figure 1.2 Affymetrix GeneChip array. Hybridization between the sample DNA and
reference DNA allows detection of genetic variation.
The advent of DNA microarray technology provides a powerful tool in various
aspects of cancer research. Identifying altered genes related to cancer
development has been one of the central research questions in microarray data
analysis. DNA microarrays offer a possibility to compare the results of detailed
combinatory analysis of global expression profiles for normal and cancer cells at
separate experimental conditions. For example, Ye et al. used microarray to
identify significant genes in oral tongue squamous cell carcinoma [3] and Scotto
et al. identified over-expressed genes in cervical cancer progression [4].
1.3
Targeted Drug Delivery
1.3.1
Passive and Active Targeted Drug Delivery
Traditional anti-cancer drugs have been used for several decades; however, there
are serious toxic effects on normal cells due to incorrectly delivery of drugs. The
purpose of targeted drug delivery is to specifically transport the anti-cancer
drugs to the tumor sites to achieve a therapeutic effect. There are two kinds of
targeted drug delivery, passive targeted drug delivery and active targeted drug
delivery [5] (Figure 1.3
4).
Figure 1.3 Graphics of targeted delivery. Active targeted delivery (Left and Middle) and
passive targeted delivery (Right)
(
Farokhzad O. C. and Langer R., 2009)
Passive targeted drug delivery is a process that drug would reach the tumor sites
based on some biophysical properties. Cancer cell needs lots of nutrients and
4
oxygen supplied when it began to proliferate, so rapid angiogenesis occurred.
Owing to the rapid angiogenesis, there are open spaces between endothelial cells
in vasculature of tumor, that is, leaky vasculature [6-7]. The defective vascular
architecture and the loss of lymphatic drainage system [8] in cancer tissue
attribute to an enhanced permeation and retention effect (EPR effect) [9-11]. For
molecules with molecular weights larger than about 40kDa, such as liposomes,
they would accumulate more rapidly and get a longer retention in tumor than in
normal tissues by EPR effect [9,11].
The mechanism of active targeted drug delivery is based on the affinity between
antibody/ligand and target antigen. The antigen-binding sites in the light chains
of antibody recognize the epitope of antigen and bind to it. Each antibody binds
to a specific antigen, and this interaction is similar to a lock and key. For
example, antibody-conjugated liposome targets to the specific membrane
receptor on the surface of cancer cell and enter the cell by receptor-mediated
endocytosis [32,37].
1.3.2
Liposome
Liposome is an artificial microscopic vesicle consisting of an aqueous core
enclosed in one or more phospholipid layers. Liposomes have been developed
since 1965 [12], and they were suggested as drug carriers in cancer
chemotherapy by Gregoriadis et al. in 1974 [13]. When used in the delivery of
anti-cancer drugs, liposomes help to shield healthy cells from the toxicity of
(RES) limits the application of plain liposomes as drug carriers [7,14].
Liposomes were recognized as successful drug delivery carriers when it was
discovered that the polyethyleneglycol (PEG) coated liposomes had significantly
increased the circulation time [15-17]. For example, PEGylated liposomal
doxorubicin [18] (with brand names of Doxil in the US and Caelyx in Europe)
has been shown to significantly improve the therapeutic index of doxorubicin
both in preclinical [19-21] and clinical [22-24] studies.
Long circulating liposomes would accumulate significantly in tumors by EPR
effect. However, vascular permeability in tumors is heterogeneous with respect
to tumor type and tumor microenvironment. It is essential to obtain a higher
degree of liposome accumulation by active targeting. Site-specific targeted
delivery can be achieved by coating the liposomes with ligands or antibodies
that target over-expressed membrane receptors on the surface of tumor [26-27].
It can avoid the non-selective toxic effects of the carried drug at other normal
human tissues or organs. With the advantages of long circulation time, long
retention time in tumor and tumor specificity, PEGylated immunoliposome has
proven most successful [28-29].
1.4
Motivation and Specific Aims
Because of the non-specific delivery of anti-cancer drugs, parts of drugs reached
the tumor site and the side-effects owing to incorrect delivery occurred in other
normal tissues. To achieve the optimal therapeutic effects, the overall dosage
should increase but the toxicity accompanied high dosage is fatal. On the other
hand, the side-effects of anti-cancer drugs cause severe harm on patients’ body
and mind. Although practical anti-cancer drugs have been developed, the
problems of side-effects are less improved. Rather than giving analgesics to
patients undergoing chemotherapy, we should seek for new methods to increase
targeting specificity of anti-cancer drugs to tumor and thus achieve high
bioavailability with low dosage.
We propose a systematic method to identify cancer-specific membrane receptors
(CSMRs) which are differentially-expressed between cancer tissue and
corresponding normal tissue. Besides, the expression of identified CSMRs in
cancer tissue is compared with the expressions in normal tissues of human body
in order to identify ‘good’ CSMRs which are lowly-expressed in other normal
tissues of human body. Those ‘good’ CSMRs can serve as cancer targeted
antigens with a little or without the adverse effects in targeted drug delivery. In
addition, expression profiles of several cancer cell-lines are provided so that the
expression level in cancer tissue and cancer cell-lines are available for
cross-comparison and those CSMR whose expressions are similar in cancer
tissue and cancer cell-lines are recommended for biological validation.
2.
Related Studies
2.1
Integrin targeting
Integrins are surface receptors that interact with the extracellular matrix and
regulate the cell signaling. Integrins are highly-expressed in the new blood
vessels during the tumor angiogenesis, and targeting to integrins by small
peptides sequences selected from phage display library was investigated [30].
Doxorubicin encapsulated within PEG-liposomes that conjugated with
integrin-targeting peptides could target the endothelial cells of C26 colon cancer
xenograft model and showed a better result when compared to non-targeting
PEGylated liposomes [31].
2.2
Folate receptor targeting
Folic acid is a vitamin that is essential for the biosynthesis of nucleotides and it
is especially important during periods of rapid cell division and growth. Folic
acid is a ligand with high affinity for folate receptor. Folate receptor is
over-expressed on tumor cells frequently [32]. PEGylated liposomes coated with
folate would target to cancer cells and be internalized by endocytosis [33].
Doxorubicin encapsulated within folate-coated liposomes has shown effective in
both in vitro [34] and in vivo experiments [35-36].
2.3
Transferrin receptor targeting
Transferrins are blood plasma proteins and their principal biological function is
thought to be related to iron binding properties. Transferrin receptor is a carrier
protein for transferring and is mediated by intracellular iron concentration.
Transferrin receptor 1 is over-expressed on cancer cells [37] and transferrins
may facilitate proliferation of tumor cells [38]. Doxorubicin encapsulated within
transferring-coated liposomes showed an enhanced uptake in the C6 glioma cells
via the receptor-mediated mechanism in contrast with free doxorubicin [39].
3.
Material
3.1
Microarray Data Collection
3.1.1
Gene Expression Omnibus
Gene Expression Omnibus (GEO) in NCBI is currently the largest public
genomic data repository [40]. Currently, GEO preserves about half a million
microarray expression profiles which is freely to be used.
In this research, the analyzed microarray data are the expression profiles from
Affymetrix platform. The collected microarray data with raw CEL files consist
of three parts: (1) microarray datasets which contain both the cancer microarray
samples and the corresponding normal microarray samples for identifying the
cancer-specific membrane receptors, (2) microarray samples of several kinds of
cancer cell-lines for comparing the mRNA expressions of membrane receptors
in cancer tissue with those in cancer cell-lines, (3) microarray samples of normal
human tissues for comparing the mRNA expressions of membrane receptors in
cancer to those in normal human tissues for indicating the putatively occurred
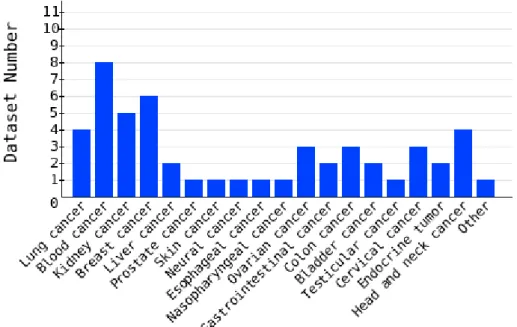
side-effects in targeted drug delivery (Table 3.1 – Table 3.4; Figure 3.1, 3.2).
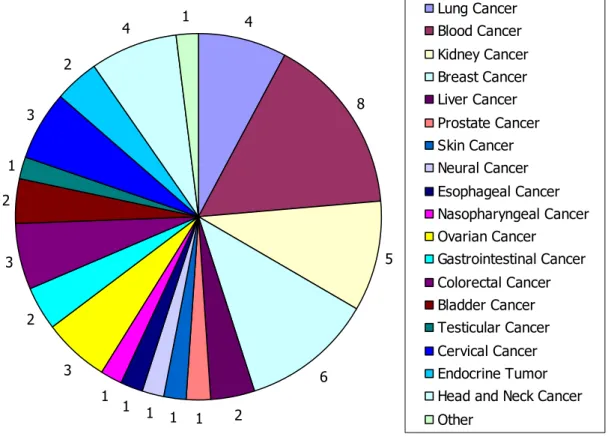
Figure 3.1 Statistics of classified cancer datasets. There are total fifty datasets for twenty
groups.
Table 3.1 Statistics of analyzed microarray data of two platforms
Microarray Platform Dataset Sample Affymetrix HG-U133A 21 1081 Affymetrix HG-U133A Plus 2.0 29 1402
Table 3.2 Statistics of analyzed microarray data
Cancer Type Dataset Number Sample Number Lung Cancer 4 242 Blood Cancer 8 572 Kidney Cancer 5 179 Breast Cancer 6 397 Liver Cancer 2 88 Prostate Cancer 1 19 Skin Cancer 1 87 Neural Cancer 1 25 Esophageal Cancer 1 24 Nasopharyngeal Cancer 1 41 Ovarian Cancer 3 157 Gastrointestinal Cancer 2 81 Colorectal Cancer 3 83 Bladder Cancer 2 72 Testicular Cancer 1 107 Cervical Cancer 3* 135 Endocrine Tumor 2 32 Head and Neck Cancer 4* 126
Other 1 16
*
Dataset GSE6791 are classified into two cancer types
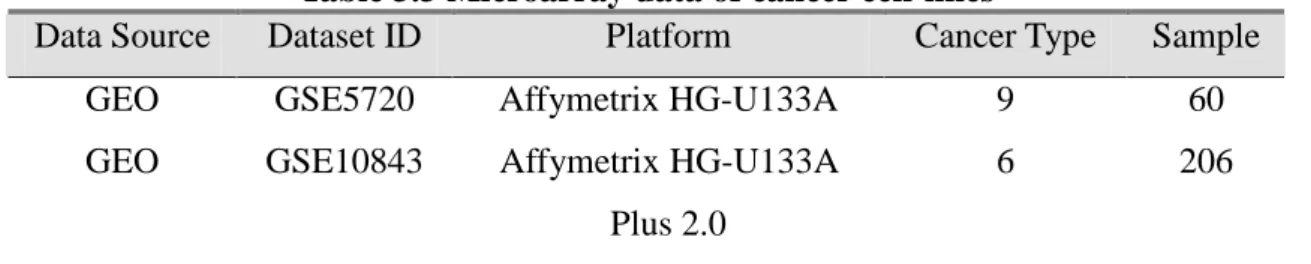
Table 3.3 Microarray data of cancer cell-lines
Data Source Dataset ID Platform Cancer Type Sample GEO GSE5720 Affymetrix HG-U133A 9 60 GEO GSE10843 Affymetrix HG-U133A
Plus 2.0
Table 3.4 Microarray data of normal human tissues
Data Source Dataset ID Platform Tissue Type Sample GEO GSE1133 Affymetrix HG-U133A 73* 146* GEO GSE3526 Affymetrix HG-U133A
Plus 2.0
65 353
*
Remove the samples not belong to normal tissues
3.1.2
Lung Cancer Microarray Samples
The lung cancer microarray dataset (LCH) with twenty five pairs microarray
samples of lung adenocarcinoma provided by Dr. Chi-Ying F. Huang,
inaugurated as professor in National Yang Ming University. The lung
adenocarcinoma samples are analyzed for identifying the differentially
expressed membrane receptors and validating the analyzed results of other lung
cancer datasets from GEO.
3.2
Genomic Annotation
Gene Ontology (GO) database provides a controlled vocabulary to describe gene
and gene product features [41]. The descriptions are divided into three types:
cellular component, biological process and molecular function.
We use the GO terms as the filtering condition to select the cancer-specific
membrane receptors from differentially expressed gene list of each analyzed
microarray dataset.
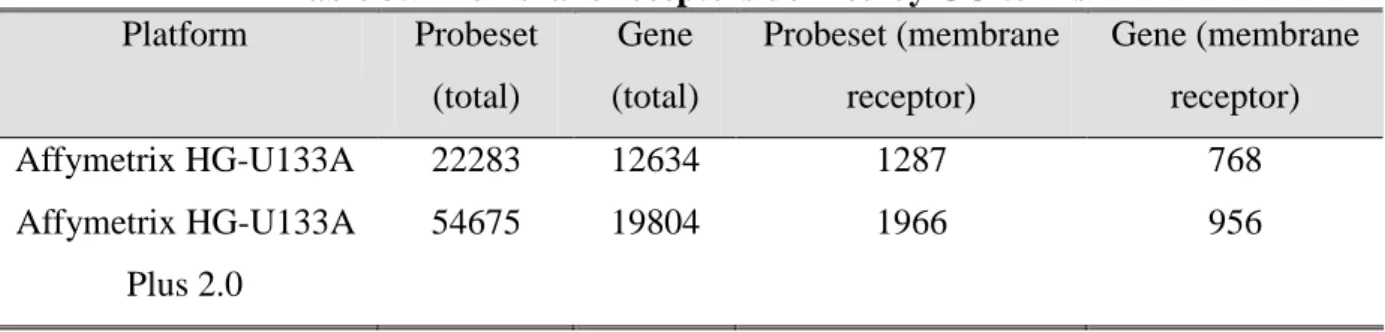
Table 3.5 Membrane receptors defined by GO terms Platform Probeset (total) Gene (total) Probeset (membrane receptor) Gene (membrane receptor) Affymetrix HG-U133A 22283 12634 1287 768 Affymetrix HG-U133A Plus 2.0 54675 19804 1966 956
3.3
Membrane Receptor Classification
Based on structural and functional similarities, we divide membrane receptors
into three main classes: the ion channel-linked receptor, the protein
kinase-linked receptor and G protein-coupled receptor.
Membrane receptor classification is based on the information of Human Plasma
Membrane Receptome database and IUPHAR database. The Human Plasma
Membrane Receptome (HPMR) database stores the information of human
membrane receptor families involved in signal transduction [42]. The IUPHAR
database incorporates pharmacological, functional and pathophysiological
information on the G protein-coupled receptors (GPCRs), voltage-gated and
ligand-gated ion channels of human, mouse and rat [43].
3.4
Proteomic Knowledge
We use the information in UniProtKB/Swiss-Prot section to annotate the
membrane receptors. The detailed information in UniProtKB/Swiss-Prot would
make researchers comprehensively realize the membrane receptors.
The UniProt Knowledgebase (UniProtKB) collects lots of functional
information on proteins, with accurate, consistent and rich annotation [44].
UniProtKB consists of two sections: one contained manually-annotated records
with information extracted from literature and curator-evaluated computational
analysis and another contained computationally analyzed records that await full
manual annotation. The two sections are referred to as "UniProtKB/Swiss-Prot"
(reviewed, manually annotated) and "UniProtKB/TrEMBL" (unreviewed,
automatically annotated), respectively.
3.5
Pathway Information of Cellular Processes of Genes
The information in KEGG PATHWAY is used to annotate the involved pathways
of membrane receptors. Once knowing the involved pathways of membrane
receptors, researchers would select those which are appropriate for verification.
The Kyoto Encyclopedia of Genes and Genomes (KEGG) knowledgebase
provides systematic analysis of gene functions, linking genomic information
with higher order functional information [45]. In the KEGG PATHWAY
database, it displayed the graphical representations of various cellular processes
and involved genes.
3.6
Antibody Manufacturers
The identified cancer-specific membrane receptors should be verify by
biological experiments or clinical tests, and there is a need for the corresponding
antibodies. We collect and provide the information of anti-CSMR antibodies
from some well-known commercial antibody manufacturers, such as Abnova
[46], Abcam [47], Invitrogen [48], Millipore [49] and Novus Biologicals [50].
4.
Method
4.1
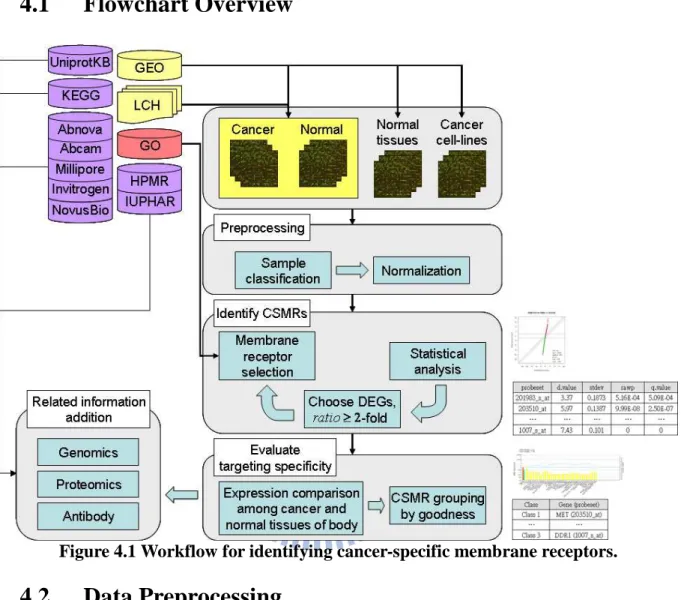
Flowchart Overview
Figure 4.1 Workflow for identifying cancer-specific membrane receptors.
4.2
Data Preprocessing
4.2.1
Sample Classification
The analyzed microarray datasets are classified into several groups according to
different cancer types (Figure 4.2). There are nineteen classified groups, and
each group includes one to several datasets.
4 8 5 6 2 1 1 1 1 1 3 2 3 2 1 3 2 4 1 Lung Cancer Blood Cancer Kidney Cancer Breast Cancer Liver Cancer Prostate Cancer Skin Cancer Neural Cancer Esophageal Cancer Nasopharyngeal Cancer Ovarian Cancer Gastrointestinal Cancer Colorectal Cancer Bladder Cancer Testicular Cancer Cervical Cancer Endocrine Tumor Head and Neck Cancer Other
Figure 4.2 Classification of analyzed microarray datasets. There are total twenty groups.
4.2.2
Microarray Data Normalization
4.2.2.1
Robust Multi-array Analysis
The non-biological variances within microarray should be removed before
analyzing the results of multiple microarray data. There are some widely-used
methods, such as MAS 5.0 [51], dChip [52], and RMA [53-55].
Robust Multi-array Analysis (RMA) is proposed by Irizarry et al. in 2003. RMA
can adjust background intensity and normalize the intensity in probe level. It is a
widely-used method for microarray data normalization because of its high
sensitivity and specificity in detecting differentially expressed genes [55].
When comparing the results of multiple high density oligonucleotide arrays, it is
important to remove sources of variation between arrays of non-biological origin,
such as unequal quantities of starting RNA, differences in labeling or detection
efficiencies between the fluorescent dyes used, and systematic biases in the
measured expression levels. The purpose of normalization is to adjust the
non-biological effects which come from variation in the microarray technology
so that meaningful biological comparisons can be made [56].
The microarray samples within each analyzed microarray dataset and those
samples belonging to cancer cell-lines and normal human tissues are normalized
by RMA method. We use the “affy” package from Bioconductor [57] and do the
normalization with function rma in R software [58].
4.2.3
Classification of Membrane Receptors
In order to realize whether there is any commonality among the identified
cancer-specific membrane receptors, the membrane receptors are classified into
several types: kinase, G-protein coupled receptors, ion channels, other and
uncertain.
If the membrane receptor is recorded in HPMR database or IUPHAR database
but it does not belong to any one group of kinase, GPCR or ion channel, it is
classified “other”. If the membrane receptor has no record in HPMR database or
IUPHAR database, it is classified “uncertain”.
4.3.1
Significance Analysis of Microarrays
Generally, the purpose of microarray analysis is to identify differentially
expressed genes between test group (e.g. cancer tissue) and control group (e.g.
normal tissue). There are many developed methods for identifying statistically
significant genes, such as t test, Mann-Whitney U test, SAM [59], MaxT [60],
and Rank Products [61-62]. It is often the case that small pergene variances can
make small fold-changes statistically significant in the t-statistic results. Tusher
et al. in 2001 proposed the SAM (Significance Analysis of Microarrays) method
to deal with this problem. In SAM, there is a “fudge factor” adding to the
denominator of the test statistic for eliminating the small variances. The fudge
factor is calculated from the sum of the global standard error of the genes.
Besides, repeated permutations of the data are used to determine if the
expression of any gene is significant related to the response.
In SAM, each gene is assigned a score d(i), “relative difference”, based on its
gene expression change relative to the standard deviation of repeated
measurements for that gene.
xI( )
iand
xU( )
iare defined as the average levels
of expression for gene i in states I and U respectively.
( )
( )
( )
0)
(
s
i
s
i
x
i
x
i
d
I U+
−
=
(1)
“gene-specific scatter” s(i) is the standard deviation of repeated expression
measurements:
( )
i
=
a
{
∑
m[
x
m( ) ( )
i
−
x
Ii
]
+
∑
n[
x
n( )
i
−
x
U( )
i
]
}
s
2 2(2)
where
∑
mand
∑
nare summations of the expression measurements in states I
and U, respectively,
a=(
1n1+1n2) (
n1+n2 −2)
, and n
1and n
2are the numbers of
measurements in states I and U.
To find significant changes in gene expression, genes were ranked by magnitude
of their d(i) values, so that d(1) was the largest relative difference, d(2) was the
second largest relative difference, and d(i) was the ith largest relative difference.
For each of the p balanced permutations, relative differences d
p(i) were also
calculated, and the genes were again ranked such that d
p(i) was the ith largest
relative difference for permutation p. The expected relative difference, d
E(i), was
defined as the average over the p balanced permutations,
dE( )
i =∑
pdp( )
i p.
To identify potentially significant changes in expression, a scatter plot of the
observed relative difference d(i) vs. the expected relative difference d
E(i) is used
(Figure 4.3). The genes were called “significant” when the value of
d( )
i −dE( )
ior
dE( ) ( )
i −d iexceeded the threshold
∆.
In the problem of multiple testing in microarray analysis, SAM provides an
estimate of the FDR for each value of the tuning parameter
∆. The estimated
FDR is computed from permutations of the data and hence assumes that all null
hypotheses are true, allowing for the possibility of dependent tests.
Figure 4.3 SAM plot. The “significant” genes are marked by red and green. Red dots
means the differentially expressed genes is highly-expressed in cancer tissue; green dots means the differentially expressed genes is highly-expressed in normal tissue.
4.3.2
False Discovery Rate
The DNA microarray is a powerful tool for studying expressions of thousands of
genes simultaneously so that microarray experiments generate large multiple
testing problems. The family-wise error rate (FWER) [63] and false discovery
rate (FDR) [64] are two common error measures for choosing a significant
threshold in multiple testing.
The FWER is the probability of at least one false positive over the collection of
tests, regardless of how many genes are tested. The simplest FWER method is
the Bonferroni correction, which divides the conventional α-level by the number
of tested genes m as a significance level for each individual gene test. The
FWER approach could present a problem in the analysis as the analysis tends to
screen out all but a handful of genes that show extreme differential expression if
m is large.
The FDR considers the probability of false rejections (discoveries) among the
rejections as a false-positive error measure. That is, FDR considers the
probability of false selections among the selected genes.
One common objective in microarray experiments is to identify a subset of
genes that are differentially expressed among different experimental conditions.
The FWER approach seems to be unnecessarily stringent because falsely
selecting a small number of genes may not be a serious problem. The FDR
approach may be more desirable because it controls the proportion of falsely
differentially expressed genes.
4.3.3
Defining Membrane Receptor Genes by GO Terms
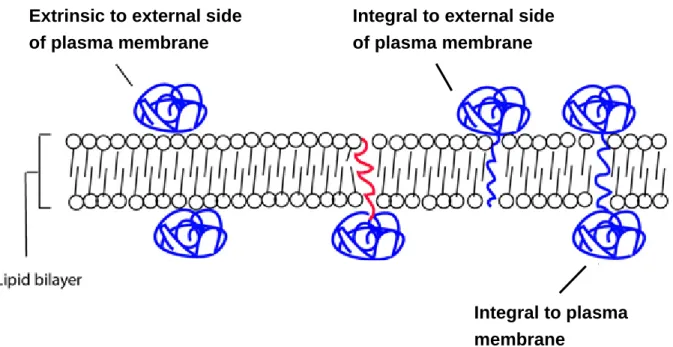
The criteria for defining membrane receptors are described as below: One gene
is thought as a membrane receptor gene when (1) its GO term of biological
function contain “receptor activity” and (2) its GO term of cellular component
contain (a) “integral to plasma membrane” or (b) “integral to the external side of
plasma membrane” or (c) “extrinsic to external side of plasma membrane” or (d)
“integral to membrane” and “plasma membrane” (Figure 4.4
5).
Figure 4.4 Graphics of definition of GO: Cellular Component. Three conditions in Rule 2
are showed.
4.3.4
Identifying Cancer-Specific Membrane Receptors
After normalization, differentially expressed genes (DEGs) with statistically
significant differences between cancer and normal tissue are extracted by SAM
method. SAM was applied using the “siggenes” package for Bioconductor in R.
Permutations of the measurements are used to estimate the false discovery rate.
For each result, the significance level was chosen not to exceed 5%
(
p
value
≤
0
.
05
) and the level of false positive rate was set not to exceed 1%,
5%, or 10% (
FDR ≤0.01or
0.01< FDR ≤0.05or
0.05< FDR ≤0.1), based
on the number of significant genes respectively. The identified differentially
Extrinsic to external side of plasma membrane
Integral to external side of plasma membrane
Integral to plasma membrane
expressed genes must satisfy these two criteria above and required at least a
2-fold expression ratio. Cancer-specific membrane receptors are extracted from
the identified differentially expressed genes by selecting genes with GO terms
conformed to the criteria for defining membrane receptors.
4.3.5
Comparing Gene Expression of Cancer-Specific
Membrane Receptors between Cancer Tissue and
Normal Tissues over Human Body
In targeted drug delivery, if the expressions of CSMR are highly-expressed in
normal tissues, tissue injuries may occur. We make comparison among the
expression of CSMR in cancer tissue and normal human tissues and calculate
the tissue index for each normal tissue in order to be aware of the adverse effects
would come up in which tissue in advance.
We supposed C
iis the expression of the ith CSMR in a cancer,
i=1,...,I, and N
ijis
the expression of ith CSMR in the jth normal tissue,
j=1,...,J. Tissue index, T
ij,
is the log2 ratio of C
iover N
ijfor the ith CSMR.
=
ij i ijN
C
T
log
2(3)
The threshold of T
ijis set to one, and it means that the expression of the ith
CSMR in a cancer is higher than that in the jth normal tissue by two fold.
The numbers of tissues indexes which pass the threshold for a CSMR are
counted and CSMR classification is based on the counted number. Some normal
tissues are regarded as important tissues (See Appendix), e.g. neural-related
tissues (brain, spinal cord, dorsal root ganglion, etc), heart-related tissues
(atrium, ventricle, coronary artery, etc), blood-related tissues (blood cells), and
some large tissues (lung, liver, kidney, endocrine gland, etc), and the tissue
indexes of these tissues are weighted heavily.
For ith CSMR in a cancer, it belongs to class 1 CSMR if all the T
ijpass the
threshold; it belongs to class 2 CSMR if all the T
ijof important tissues pass the
threshold but at least one T
ijof other tissues does not pass the threshold; it
belongs to class 3 CSMR if at least one T
ijof important tissues does not pass the
threshold.
Figure 4.5 Graphics of tissue index. Example of Class 3 CSMR. For Class 3 CSMR, there
is at least one important normal tissue of body whose expression level is not lower than that in cancer tissue by 2-fold.
5.
Results
5.1
Statistics of identified CSMRs
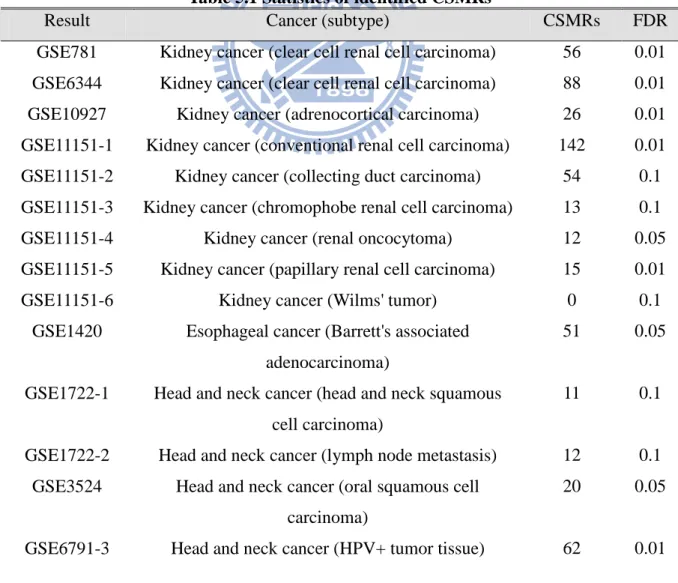
For the analyzed results, the lower threshold of false discovery rate is 1% and
the upper threshold of false discovery rate is 10%. The number of genes
identified by SAM would change along with the FDR value. The threshold of
FDR value which is set to 0.01, 0.05 or 0.1 depends on that the numbers of
identified genes exceed one thousand under the condition. Smaller FDR value is
preferred. There is no identified CSMR in some results.
Table 5.1 Statistics of identified CSMRs
Result Cancer (subtype) CSMRs FDR GSE781 Kidney cancer (clear cell renal cell carcinoma) 56 0.01 GSE6344 Kidney cancer (clear cell renal cell carcinoma) 88 0.01 GSE10927 Kidney cancer (adrenocortical carcinoma) 26 0.01 GSE11151-1 Kidney cancer (conventional renal cell carcinoma) 142 0.01 GSE11151-2 Kidney cancer (collecting duct carcinoma) 54 0.1 GSE11151-3 Kidney cancer (chromophobe renal cell carcinoma) 13 0.1 GSE11151-4 Kidney cancer (renal oncocytoma) 12 0.05 GSE11151-5 Kidney cancer (papillary renal cell carcinoma) 15 0.01 GSE11151-6 Kidney cancer (Wilms' tumor) 0 0.1
GSE1420 Esophageal cancer (Barrett's associated adenocarcinoma)
51 0.05 GSE1722-1 Head and neck cancer (head and neck squamous
cell carcinoma)
11 0.1 GSE1722-2 Head and neck cancer (lymph node metastasis) 12 0.1
GSE3524 Head and neck cancer (oral squamous cell carcinoma)
20 0.05 GSE6791-3 Head and neck cancer (HPV+ tumor tissue) 62 0.01
GSE6791-4 Head and neck cancer (HPV- tumor tissue) 49 0.01 GSE9844 Head and neck cancer (oral tongue squamous cell
carcinoma)
16 0.01 GSE3167-1 Bladder cancer (without carcinoma in situ) 33 0.01 GSE3167-2 Bladder cancer (carcinoma in situ) 54 0.01 GSE3167-3 Bladder cancer (invasive carcinoma) 49 0.01 GSE7476-1 Bladder cancer (low grade superficial tumor) 34 0.1 GSE7476-2 Bladder cancer (high grade superficial tumor) 9 0.1 GSE7476-3 Bladder cancer (invasive tumor) 26 0.1
GSE3218 Testicular cancer (17 seminomas, 15 pure EC, 15 pure T, 10 pure YS, 2 pure CC, and 42 NSGCT
with mixed histologies)
114 0.01
GSE5788 Blood cancer (T-cell prolymphocytic leukemia) 1 0.05 GSE6477-1 Blood cancer (relapsed multiple myeloma) 6 0.01 GSE6477-2 Blood cancer (monoclonal gammopathy of
undetermined significance multiple myeloma)
1 0.01 GSE6477-3 Blood cancer (new multiple myeloma) 12 0.01 GSE6477-4 Blood cancer (smoldering multiple myeloma) 5 0.01 GSE6691-1 Blood cancer (chronic lymphocytic leukemia) 10 0.01 GSE6691-2 Blood cancer (multiple myeloma) 28 0.01 GSE6691-3 Blood cancer (Waldenström's macroglobulinemia,
B-lymphocyte)
6 0.05 GSE6691-4 Blood cancer (Waldenström's macroglobulinemia,
plasma cell)
30 0.01 GSE8835-1 Blood cancer (chronic lymphocytic leukemia,
CD4+ T cell)
17 0.01 GSE8835-2 Blood cancer (chronic lymphocytic leukemia,
CD8+ T cell)
4 0.01 GSE9476 Blood cancer (acute myeloid leukemia) 4 0.01 GSE6338-1 Blood cancer (peripheral T-cell lymphoma
unspecified)
131 0.01 GSE6338-2 Blood cancer (angioimmunoblastic lymphoma) 80 0.01 GSE6338-3 Blood cancer (anaplastic large cell lymphoma) 101 0.01 GSE12195 Blood cancer (diffuse large B-cell lymphoma) 186 0.01 GSE12453-1 Blood cancer (classical Hodgkin's lymphoma) 84 0.01 GSE12453-2 Blood cancer (nodular lymphocte-predominant
Hodgkin's lymphoma)
60 0.01 GSE12453-3 Blood cancer (T-cell rich B-cell lymphoma) 45 0.05
GSE12453-4 Blood cancer (follicular lymphoma) 19 0.05 GSE12453-5 Blood cancer (Burkitt's lymphoma) 19 0.01 GSE12453-6 Blood cancer (diffuse large B-cell lymphoma) 52 0.01 GSE6008-1 Ovarian cancer (endometrioid carcinoma) 53 0.01 GSE6008-2 Ovarian cancer (serous carcinoma) 59 0.01 GSE6008-3 Ovarian cancer (mucinous carcinoma) 57 0.01 GSE6008-4 Ovarian cancer (clear cell carcinoma) 44 0.01 GSE10971 Ovarian cancer (adnexal serous carcinoma) 39 0.01 GSE15578 Ovarian cancer (ovarian epithelial carcinoma) 15 0.1 GSE6883-1 Breast cancer (tumorigenic cell) 12 0.1 GSE6883-2 Breast cancer (non-tumorigenic cell) 3 0.1 GSE9574 Breast cancer 0 0.1 GSE3744 Breast cancer (basal-like cancer of breast
carcinoma)
22 0.01 GSE7904-1 Breast cancer (basal-like cancer of breast
carcinoma)
30 0.01 GSE7904-2 Breast cancer (non-basal-like cancer of breast
carcinoma)
19 0.01 GSE8977 Breast cancer (stroma of invasive ductal
carcinoma)
50 0.01 GSE10780 Breast cancer (invasive ductal breast carcinoma) 19 0.01
GSE7670 Lung cancer (lung adenocarcinoma 26 pairs and large cell lung cancer 1 pair)
7 0.01 GSE10072 Lung cancer (lung adenocarcinoma) 8 0.01 GSE10799-1 Lung cancer (lung adenocarcinoma, disseminate
into bone marrow)
14 0.1 GSE10799-2 Lung cancer (lung adenocarcinoma, not
disseminate into bone marrow)
27 0.05 LCH Lung cancer (lung adenocarcinoma) 42 0.01 GSE7803 Cervical cancer (invasive cervical squamous cell
carcinoma)
3 0.01 GSE9750 Cervical cancer (cervical squamous cell carcinoma) 17 0.01 GSE6791-1 Cervical cancer (HPV+ tumor tissue) 133 0.01
GSE6791-2 Cervical cancer (HPV- tumor tissue) 33 0.01 GSE12907 Neural cancer (juvenile pilocytic astrocytoma) 73 0.05 GSE3325-1 Prostate cancer (primary tumor) 12 0.05 GSE3325-2 Prostate cancer (metastasis) 4 0.1 GSE3678 Endocrine tumor (papillary thyroid carcinoma) 17 0.01 GSE6004 Endocrine tumor (papillary thyroid carcinoma) 27 0.05 GSE4107 Colon cancer (early onset colorectal carcinoma) 30 0.01 GSE4183 Colon cancer (colorectal carcinoma) 35 0.01 GSE13471 Colon cancer (colorectal carcinoma) 19 0.1 GSE6222-1 Liver cancer (hepatocellular carcinoma, stage 1) 0 0.1 GSE6222-2 Liver cancer (hepatocellular carcinoma, stage 3) 0 0.1 GSE6764-1 Liver cancer (hepatocellular carcinoma, HCV
infection, early)
16 0.01 GSE6764-2 Liver cancer (hepatocellular carcinoma, HCV
infection, advanced)
15 0.01 GSE7553-1 Skin cancer (basal cell carcinoma) 56 0.01 GSE7553-2 Skin cancer (primary melanoma) 28 0.05 GSE7553-3 Skin cancer (melanoma in situ) 0 0.1 GSE7553-4 Skin cancer (metastatic melanoma) 72 0.01 GSE7553-5 Skin cancer (squamous cell carcinoma) 20 0.05 GSE9576-1 Gastrointestinal cancer (midgut carcinoid primary
tumor)
27 0.01 GSE9576-2 Gastrointestinal cancer (midgut carinoid liver
metastasis)
21 0.05 GSE13911 Gastrointestinal cancer (gastric carcinoma) 27 0.01 GSE12452 Nasopharyngeal cancer (nasopharyngeal
carcinoma)
28 0.01 GSE13433 Other (alveolar soft-part sarcoma) 33 0.01
5.2
Case Study: Identifying CSMRs in Lung Adenocarcinoma
are two main types of lung cancer: small cell lung cancer and non-small cell
lung cancer. Lung adenocarcinoma is one of the main types of non-small cell
lung cancer. Lung adenocarcinoma is the commonest type of lung cancer in
non-smokers [65] and accounts for about forty percent of all cases of lung
cancer [66]. The 5-year survival rate of non-small cell lung cancer is about 15
percent [67]. The currently used anti-cancer drugs, such as cisplatin or
carboplatin, would cause severe side-effects. Researchers are seeking for an
effective targeting molecule so that anti-cancer drugs could be specifically
delivered to cancer cells, and decreasing the chance of occurred side-effects.
We analyze four microarray datasets of lung adenocarcinoma and try identifying
cancer-specific membrane receptors (CSMRs) for use in targeted drug delivery.
The basic information of analyzed datasets and the results are listed below
(Table 5.2 – Table 5.6).
Table 5.2 Analyzed datasets of lung adenocarcinoma
Dataset ID Microarray platform
Cancer tissue Cancer samples
Normal tissue Normal samples GSE10799 Affymetrix HG-U133A Plus 2.0 Lung adenocarcinoma 16 Normal bronchial epithelial tissue 3 Lung cancer dataset (LCH) Affymetrix HG-U133A Plus 2.0 Lung adenocarcinoma 25 Adjacent normal lung tissue 25 GSE7670 Affymetrix HG-U133A Lung adenocarcinoma 27 Adjacent normal lung tissue 27 GSE10072 Affymetrix HG-U133A Lung adenocarcinoma 58 Normal lung tissue 49
Table 5.3 Identified CSMRs in lung adenocarcinoma dataset, GSE10799, not disseminate into bone marrow
SAM Analysis for the Two-Class Unpaired Case Assuming Unequal Variances s0 = 0.1889 (The 15 % quantile of the s values.)
Number of permutations: 220 (complete permutation) Delta: 1.108049
cutlow: -1.865 cutup: 2.216 p0: 0.5 FDR: 0.05
Identified Genes (using Delta = 1.108049):
Probeset Gene ID Gene Symbol d.value stdev rawp q.value 203954_x_at 1365 CLDN3 2.34 0.3203 0.011634 0.03218 201428_at 1364 CLDN4 2.47 0.2555 0.008761 0.02765 1007_s_at 780 DDR1 2.79 0.1856 0.004539 0.01823 207169_x_at 780 DDR1 2.49 0.2351 0.008383 0.02694 208779_x_at 780 DDR1 2.64 0.2856 0.006127 0.02203 210749_x_at 780 DDR1 3.18 0.2097 0.002083 0.01196 205107_s_at 1945 EFNA4 4.39 0.1302 0.000294 0.0046 226213_at 2065 ERBB3 2.99 0.2515 0.003001 0.01437 224404_s_at 83416 FCRL5 2.51 0.4322 0.00808 0.02623 235988_at 266977 GPR110 3.91 0.6297 0.000585 0.00633 238689_at 266977 GPR110 2.9 0.5442 0.003542 0.01576 210473_s_at 166647 GPR125 2.24 0.2325 0.014822 0.03682 209631_s_at 2861 GPR37 2.37 0.639 0.011098 0.03129 229105_at 2863 GPR39 5.01 0.3346 0.000142 0.00339 219936_s_at 53836 GPR87 2.91 0.5867 0.003465 0.01562 213831_at 3117 HLA-DQA1 3.27 0.9784 0.001749 0.01079 236203_at 3117 HLA-DQA1 2.83 0.6874 0.004138 0.01723 209480_at 3119 HLA-DQB1 3.2 0.9685 0.001999 0.01163 242517_at 84634 KISS1R 2.8 0.6798 0.004462 0.01803 218326_s_at 55366 LGR4 5.45 0.2874 9.42E-05 0.00306 205282_at 7804 LRP8 2.79 0.3302 0.004548 0.01824 208190_s_at 51599 LSR 3.29 0.251 0.001683 0.01062 203510_at 4233 MET 2.41 0.5399 0.010003 0.02939 223540_at 81607 PVRL4 2.44 0.2598 0.009521 0.02879 204729_s_at 6804 STX1A 3.17 0.258 0.002098 0.01198 212800_at 10228 STX6 4.1 0.1982 0.000432 0.00552 222581_at 9213 XPR1 2.44 0.196 0.009519 0.02879
Table 5.4 Identified CSMRs in lung cancer dataset, LCH
SAM Analysis for the Two-Class Paired Case s0 = 0.0446 (The 0 % quantile of the s values.) Number of permutations: 1000
Delta: 1.819148 cutlow: -2.042 cutup: 2.335
FDR: 0.00999
Identified Genes (using Delta = 1.819148):
Probeset Gene ID Gene Symbol d.value stdev rawp q.value 1555779_a_at 973 CD79A 3.09 0.2104 0.001137 0.001029
203953_s_at 1365 CLDN3 6.98 0.27 0 0 203954_x_at 1365 CLDN3 6.29 0.2546 9.99E-08 2.50E-07
201428_at 1364 CLDN4 7.65 0.1553 0 0 1007_s_at 780 DDR1 7.43 0.101 0 0 207169_x_at 780 DDR1 7.31 0.123 0 0 208779_x_at 780 DDR1 7.27 0.1093 0 0 210749_x_at 780 DDR1 7.32 0.1129 0 0 205107_s_at 1945 EFNA4 9.96 0.1438 0 0 201983_s_at 1956 EGFR 3.37 0.1873 0.000516 0.000509 201984_s_at 1956 EGFR 3.53 0.1965 0.000322 0.000335 1438_at 2049 EPHB3 4.89 0.1421 3.00E-06 5.17E-06 202454_s_at 2065 ERBB3 5.46 0.1671 3.00E-07 6.39E-07 226213_at 2065 ERBB3 5.41 0.1531 3.00E-07 6.39E-07 206429_at 2150 F2RL1 5.84 0.1424 9.99E-08 2.50E-07 213506_at 2150 F2RL1 9.1 0.1643 0 0 222906_at 28982 FLVCR1 5.38 0.1387 4.00E-07 8.40E-07 238689_at 266977 GPR110 7.87 0.3125 0 0 223423_at 26996 GPR160 8.62 0.159 0 0 211633_x_at 3500 IGHG1 3.27 0.3152 0.000685 0.000654 211908_x_at 3500 IGHG1 2.76 0.3021 0.002713 0.002252 209374_s_at 3507 IGHM 3.94 0.2837 8.28E-05 9.95E-05 216491_x_at 3507 IGHM 3.1 0.3676 0.001103 0.001003 235583_at 286676 ILDR1 5.63 0.1697 2.00E-07 4.53E-07 227314_at 3673 ITGA2 5.11 0.1865 1.50E-06 2.83E-06 204989_s_at 3691 ITGB4 4.29 0.2331 2.28E-05 3.11E-05 204990_s_at 3691 ITGB4 4.65 0.1997 5.70E-06 8.95E-06 218326_s_at 55366 LGR4 9.05 0.1901 0 0 208433_s_at 7804 LRP8 5.76 0.1572 9.99E-08 2.50E-07 208190_s_at 51599 LSR 6.17 0.1717 9.99E-08 2.50E-07 203510_at 4233 MET 5.97 0.1387 9.99E-08 2.50E-07 228592_at 931 MS4A1 3.1 0.3073 0.001122 0.001018 204213_at 5284 PIGR 4.17 0.2934 3.65E-05 4.75E-05 207011_s_at 5754 PTK7 6.72 0.1074 0 0 200635_s_at 5792 PTPRF 5.82 0.1382 9.99E-08 2.50E-07 200637_s_at 5792 PTPRF 4.64 0.1688 5.90E-06 9.20E-06 223540_at 81607 PVRL4 6.02 0.1395 9.99E-08 2.50E-07 204916_at 10267 RAMP1 4.96 0.1505 2.40E-06 4.31E-06 204729_s_at 6804 STX1A 5.9 0.1352 9.99E-08 2.50E-07 219360_s_at 54795 TRPM4 3.61 0.2534 0.000248 0.000265
222581_at 9213 XPR1 7.22 0.1757 0 0 226615_at 9213 XPR1 5.04 0.1766 1.90E-06 3.50E-06
Table 5.5 Identified CSMRs in lung adenocarcinoma dataset, GSE7670
s0 = 0 Number of permutations: 1000 Delta: 2.144888 cutlow: -2.605 cutup: 3.065 p0: 0.5 FDR: 0.00993
Identified Genes (using Delta = 2.144888):
Probeset Gene ID Gene Symbol d.value stdev rawp q.value 203953_s_at 1365 CLDN3 6.6 0.2907 5.21E-07 1.80E-06 203954_x_at 1365 CLDN3 5.82 0.1741 1.56E-06 4.07E-06 201428_at 1364 CLDN4 6.3 0.1579 1.04E-06 3.18E-06 201983_s_at 1956 EGFR 4.8 0.2173 4.72E-05 8.72E-05 216491_x_at 3507 IGHM 4.2 0.2958 0.000253 0.000378 208190_s_at 51599 LSR 6.82 0.184 3.47E-07 1.28E-06 203510_at 4233 MET 3.15 0.2845 0.004049 0.004328
Table 5.6 Identified CSMRs in lung adenocarcinoma dataset, GSE10072
SAM Analysis for the Two-Class Unpaired Case Assuming Unequal Variances s0 = 0.0389 (The 0 % quantile of the s values.)
Number of permutations: 1000 Delta: 1.576606 cutlow: -1.788 cutup: 1.902 p0: 0.5 FDR: 0.01
Identified Genes (using Delta = 1.576606):
Probeset Gene ID Gene Symbol d.value stdev rawp q.value 203953_s_at 1365 CLDN3 8.75 0.1633 0 0
201428_at 1364 CLDN4 6.86 0.1349 0 0 213506_at 2150 F2RL1 7.64 0.1292 0 0 211908_x_at 3500 IGHG1 5 0.1417 0 0 209374_s_at 3507 IGHM 3.98 0.2846 2.91E-06 3.50E-06 216491_x_at 3507 IGHM 5.73 0.2475 0 0 208190_s_at 51599 LSR 8.54 0.1004 0 0
203510_at 4233 MET 3.07 0.2056 0.000128 0.000118
Table 5.7 Comparisons of identified CSMRs from different datasets
Probeset Gene Symbol GSE10799 LCH GSE7670 GSE10072 1555779_a_at CD79A o X X
203953_s_at CLDN3 o o o 203954_x_at CLDN3 o o o
207169_x_at DDR1 o o 208779_x_at DDR1 o o 210749_x_at DDR1 o o 205107_s_at EFNA4 o o 201983_s_at EGFR o o 201984_s_at EGFR o 1438_at EPHB3 o 202454_s_at ERBB3 o 226213_at ERBB3 o o X X 206429_at F2RL1 o 213506_at F2RL1 o o 224404_s_at FCRL5 o X X 222906_at FLVCR1 o X X 235988_at GPR110 o X X 238689_at GPR110 o o X X 210473_s_at GPR125 o 223423_at GPR160 o X X 209631_s_at GPR37 o 229105_at GPR39 o X X 219936_s_at GPR87 o 213831_at HLA-DQA1 o 236203_at HLA-DQA1 o X X 209480_at HLA-DQB1 o 211633_x_at IGHG1 o 211908_x_at IGHG1 o o 209374_s_at IGHM o o 216491_x_at IGHM o o o 235583_at ILDR1 o X X 227314_at ITGA2 o X X 204989_s_at ITGB4 o 204990_s_at ITGB4 o 242517_at KISS1R o X X 218326_s_at LGR4 o o 205282_at LRP8 o 208433_s_at LRP8 o 208190_s_at LSR o o o o 203510_at MET o o o o 228592_at MS4A1 o X X
204213_at PIGR o 207011_s_at PTK7 o 200635_s_at PTPRF o 200637_s_at PTPRF o 223540_at PVRL4 o o X X 204916_at RAMP1 o 204729_s_at STX1A o o 212800_at STX6 o 219360_s_at TRPM4 o 222581_at XPR1 o o X X 226615_at XPR1 o X X ’X’ means that the probeset exist in Affymetrix HG-U133A Plus 2.0 platform, but not in
Affymetrix HG-U133A platform
Table 5.8 Examples of selected CSMR
Probeset Gene Symbol GSE10799 LCH GSE7670 GSE10072 203953_s_at CLDN3 o o o 203954_x_at CLDN3 o o o 201428_at CLDN4 o o o o 1007_s_at DDR1 o o 207169_x_at DDR1 o o 208779_x_at DDR1 o o 210749_x_at DDR1 o o 205107_s_at EFNA4 o o 201983_s_at EGFR o o 226213_at ERBB3 o o X X 213506_at F2RL1 o o 238689_at GPR110 o o X X 211908_x_at IGHG1 o o 209374_s_at IGHM o o 216491_x_at IGHM o o o 218326_s_at LGR4 o o 208190_s_at LSR o o o o 203510_at MET o o o o 223540_at PVRL4 o o X X 204729_s_at STX1A o o 222581_at XPR1 o o X X ’X’ means that the probeset exist in Affymetrix HG-U133A Plus 2.0 platform, but not in
According to the comparative result (Table 5.7), there are several CSMRs which
are identified by more than one dataset. We choose the CSMRs in the
intersection of results and use the expression profiles of LCH dataset for
demonstration (Table 5.8, Figure 5.2 – 5.22).
The gene name and fold change are marked upper-left in the figure. The red bar
means the average expression in cancer tissue, and the green bar means the
average expression in corresponding normal tissue. The blue line in the upper
two parts is the value of tissue index. In the upper two parts of figure, each
yellow bar represents the expression in a normal tissue of human body. In the
lower three parts of figure, each yellow bar represents the expression in a cancer
cell-line. (Figure 5.1)
According to the results of tissue index of gene, the sixteen chosen CSMRs are
classified (Table 5.9). The CSMRs belong to class 1 and 2 are recommended,
but the low expression of GPR110 (238689_at) and EFNA4 (205107_s_at)
should be watched out.
Table 5.9 Classification of CSMRs by tissue index
Class Gene (Probeset)
Class 1 GPR110 (238689_at), MET (203510_at), XPR1 (222581_at) Class 2 CLDN4 (201428_at), EFNA4 (205107_s_at), F2RL1 (213506_at),
IGHG1 (211908_x_at) , IGHM (209374_s_at), IGHM (216491_x_at) Class 3 CLDN3 (203953_s_at), CLDN3 (203954_x_at), DDR1 (1007_s_at),
DDR1 (207169_x_at), DDR1 (208779_x_at), DDR1 (210749_x_at), EGFR (201983_s_at), ERBB3 (226213_at), LGR4 (218326_s_at), LSR
Figure 5.1 Elucidation of CSMR expression plot. Red bar is the average expression level in
cancer tissue. Green bar is the average expression in corresponding normal tissue. Yellow bars include the average expression level in normal tissues of body (upper two parts) or in cancer
cell-lines (lower three parts).
Normal tissues of body Tissue
Indexes
Gene symbol and fold change
Cancer cell-line