Chiao Da Management Review Vol. 33 No.2, 2013
pp.l -30
員工分紅與股東股利分配之不對稱
性:淨誘因效果或是淨侵權效果?
The Asymmetric distribution between Stock Bonus and
Stock Dividends:
Net Incentives
or Entrenchments?
許文馨 1 Audrey Wen-hsin Hsu 台灣大學會計系
Department of Accounting, National Taiwan University 黃怡璇 Yi-HsuanHuang
中華民國銀行公會內部管理委員會
Internal Management Committee, Bankers Association ofR.O.C
摘要:員工分紅在文獻上一直被認為是台灣高科技產業競爭力之一大貢獻來 源 。 但是,公司法規定員工分紅與股東股利一樣,都屬盈餘分配之一種,而 且都可以用現金或股利之模式來作為分配 。 過去高科技台灣公司傾向以「股 票」分配員工紅利而以「現金」分配股東股利。很多股東抱怨這種「盈餘分 配方式不對稱現象」是一種侵害股東權益之現象;反之,公司管理階層認為 員工是公司獲利的主要動力,r 盈餘分配方式不對稱現象」走為了留住員工的 必須政策。 本文探討此「盈餘分配方式不對稱現象」是否反應管理階層的「員 工誘因理論」還是「侵權理論」。 本文發現公司的未來績效的確與公司「盈餘 分配不對稱」呈正向關條 。 本文的結果支持「盈餘分配方式不對稱現象」產 生的員工誘因效果大於對股東的侵權效果 。 關鍵詞:員工分紅;公司績效;股東股利;激勵效果;侵權效果
I Corresponding author: Department of Accounting, National Taiwan University, Taipei City, Taiw妞,Email: [email protected]
We thank Kaichuen Chang, Tsai-hsien De峙, Ya-Yi Chao, Yu-Hao Chang, Chun-Yo- Lin, Hsin品1 Yao, Yi-Zhu Chen, Men-Chuen Chi, Yi-Wen Wang, Shen-Hsiuen Cheng, Si品1, Lin, and Chiun-yi Jiang for data and case analyses. Audrey Hsu gratefully ack.nowledges the tìnancial support from the National Science Council in Taiwan (99-2410-H-002-077), and all the students participating in 也epilot study.
2 The Asymmetric distribution between Stock Bonus and Stock Dividends: Net lncentives or Entrenchments?
Abstract: Employee profit sharing stock bonus has always been regarded as the main contributor to the success of the high-tech indus仕y in Taiwan. As profit sharing bonus and shareholder dividends are determined at the same time at the shareholder meeting under the Corporation Law in Taiwan
,
and can be distributed in either cash or shares, many investors question the fairness to distribute profit sharing bonus (dividends) more (less) in stocks than in cash (Chung,
2004). This study examines whether the high stockJcash proportion in employee bonus,
relative to the proportion in shareholder dividends (i.e., asymmetric distribution) represents management's net incentive or entrenchment effects. Consistent with net incentive theo旬, the result show that firm performance, as measured by Tobin'sQ
and ROA,
can increase with the asymmetric dis仕ibution. The results infer that the incentive effect in the asymmetric distribution dominates the entrenchment effect.Keywords: Profit sharing bonus; Firm performance; Dividends; Incentives; Entrenchment
1.
Introduction
Employee profit sharing stock bonus has always been regarded as the main contributor to the success of the high-tech indus的, in Taiwan, (Guo et al., 2006;
Lin and Chen, 2009; Jeng et al., 2009). 2 It is believed that the large-scale
adoption of the employee stock ownership in the profit sharing bonus has played a crucial role in the phenomenal growth of the high-tech industry in the past two
2 The cover story
“why Taiwan matters" in Business week (May 16
, 2005) has documented the success of the high-tech industry in Taiwan, which is often regarded as Silicon Valley in the East. For example, "Asustek Computer, whose China factories spit out iPods and Mini Macs for Apple; and Quanta Computer, the No. 1 global maker of notebook PCs and a key supplier to Dell 也ELL)and Hewlett-Packard. You'll also find Taiwan Semiconductor Manufacturing Co. rn盟), the biggest chip foundry on the planet, an essential partner to U.S. companies such as Qualcomm and Nvídia (盟主DA). Dozens more companies dot the Neihu-Hsinchu corridor. There's AU Optronics (主UTO), a big supplier of liquid-crystal display panels, and Hon Hai Precision Indus仕y, which makes everything 企omPC components to Sony's 也NE)PlayStation 2, and which is a fast-rising rival to Flextronics International (FLE品,the wor1d's biggest contract manufacturer."Chiao Da Management Review均l.33 No.2, 2013 3
decades. However, many investors are concemed that many high-tech firms distribute dividends primarily in cash and distribute employee bonus primarily in stock form (Chung, 2004). They argue th剖 management's tendency to increase stockJcash proportion for employee bonus, relative to the stockJcash proportion for dividends (hereinafter
“
asymmetric distribution") is an indicator of management entrenchment because shareholders also prefer the stock dividends to cash dividends.This study examines whether asymme仕ic distribution can provide incentive effects more than entrenchment effects (i.e, net incentives), or vice versa (i.e., net entrenchments). Different from the accounting treatments in the U.S.A
,
the number of stocks for stock dividends and stock bonus are determined and recorded based on the par value of stocks rather than the market value.3 If the stock price of each share is much larger than the par value,
shareholder (or employees) can gain more than the book value if dividends (or bonuses) are paid in the form of stocks. In Taiwan, Corporation law requires firms determine employee bonus and shareholder dividends at the same time at the board of directors meeting and shareholder meeting. In the article of each corporation, a firm should specify the distribution policy for profit sharing bonus and dividends with regard to the cash/stock proportion. As companies need to draft eamings dis的bution plans before submitting for the approval at the shareholder meeting,
this raises a question whether asymmetric distribution can align the interests before shareholders and managers, and improve firm performance.On one hand, asymmetric distribution can provide incentives to employees by improving shareholders' value. Cheadle (1989) argues that when the supervisions costs are likely to be higher in professional occupations, stock bonus can provide the incentives. Since high-tech industry is a knowledge-intensive and capital-intensive industry, and its task complexity is high, 1 expect that the
3 However, after January 1, 2008, Taiwanese accounting standards require fmns to estimate the profit-sharing bonus expense in the financial statements before the actual di耐ibution in the subsequent year. In addition, if the firm chooses to distribute profit-sharing bonus to employees in the form of stocks, the new rule also requires the number of shares be determined by the fair value of the shares granted as opposed to the par value of the shares.
4 The Asymmetric distribution between Stock Bonus and Stock Dividends: Net Incentives or Entrenchments?
asymmetric distribution can enhance productivity in workplaces. In addition,
profit sharing bonus can lead to lower absenteeism and quit rates (Azfar and Danninger, 2001; Brown et al., 1999; Wilson and Peel, 1991). Thus, asymmetric distribution, which puts more weight on stock bonus than cash bonus, can accelerate the benefits of reducing quit rates among employees. Similarly
,
if profit sharing bonus can encourage mutual monitoring and peer group pressure (Bakeret al., 1987; Fitzroy and Kraft, 1986; Kruse, 1993; Levine and Tyson, 1990), 1 expect that distributing bonus more in the form of stocks than cash can speed up a cooperative culture among employees, which in turn can improve firm performance.
On the other hand, asymmetric distribution may represent managers' self-interests to entrench shareholders' value. Stock bonuses issued to managers and staff members could potential1y dilute share value and may have negative impact on shareholders' wealth. This is so-cal1ed the dilution effect. Moreover,
employees' stock bonuses significantly underestimated the real
‘
cost' of the bonuses and overestimates firms' reported net income in Taiwan before 2008. During the period, being treated as part of profit dis仕ibution, the stocks were directly taken to retained eamings, bypassing net income and being recognized with the par value (i.e. NT$lO a share) rather than market value. Chung (2004) argues that the real cost of stock bonuses was significantly underestimated because the number of stocks issued was determined at par (i.e.,
NT$10 a share) rather than market value. Since stock bonus has taken up a large sum of dilution costs, companies need to reduce the dividends in the form of stocks to avoid the di1ution costs from the stock dividends. This represents managers' entrenchment on shareholders' benefits.Because of these competing perspectives, it is ultimately an empirical question whether asymmetric distribution can represent net incentive or entrenchment effects. If the entrenchment effect outweighs the incentive effect, 的ymmetric distribution can have a negative pe.于ormance effects. Since prior studies have provided evidence in support of the positive performance effects of profit sharing bonus in Taiwan, (Guo et al., 2006; Lin and Chen, 2009; Jeng et
Chiao Da Management Review Vol. 33 No.2, 2013 5
bonus and firm performance can decrease with asymmetric distribution. Conversely
,
if the incentive effect dorninates entrenchment effect,
this study expects that the positive association between employee bonus and firm performance can rise as the asymmetric distribution increases.The data inc1udes a sample of 1
,
799 observations consisting of high-tech public1y-traded firms in Taiwan from years 1997-2007. This study measure“
asymmetric distribution" by dividing the stockJcash proportion in profit sharing bonus by the stockJcash proportion in shareholder dividends. Using market-based performance measures, TobinQ and accounting-based performance measure, ROA, to measure firm performance, the results show that“
asymmetric distribution" is positively associated with future performance. This study provides evidence that firms use stock bonus to motivate employees on innovations,
and incentive effects can dominate the dilution costs.The contributions consist of three parts. First, this study contributes to compensation and dividend literature by pointing out that executive compensation should be made concurrently with shareholder dividends. Lambert et al. (1989)
argue that dividends decrease relative to the expected level following the adoption of stock incentives because dividend payout can reduce the market value. Fenn and Liang (2001) also argue that managers with the stock incentives have the motive to alter the compositions of c。中orate payouts to address the free cash f10w problems (Fenn and Liang, 2001). All these studies focus on how managerial stock incentives inf1uence subsequent policies but neglect the possibility that
co中oratepayout and employee compensation can be deterrnined at the same time. Second, while many argues that managerial incentives can inf1uence management decisions and mitigate various agency problems, Yermack (1995) fmd that the observed executive stock options in the U.S.A are not optimal. The study provides a possibility that if compensation decisions and c。中orate payout are not determined at the same time, compensation decision rnight not be optimal. Finally, this study provides important implications for high-tech industries in Taiwan that employee profit sharing bonus is an important 世iver of shareholders' wealth. Prior studies of stock bonus, (Guo et al., 2006; Lin and Chen, 2009; Jeng et al.,
6 The Asymmetric distribution between Stock Bonus and Stock Dividends: Net /ncentives or Entrenchments?
introduce a benchmark to measure the appropriate level of stock bonus. This study benchmarks the stockJcash ratio of employee bonus against the stockJcash ratio of stock dividends, and examine whether such asymmetric distribution represents a net incentive or net entrenchment effect.
The rest of the paper is structured as follows. Section 2 describes the institutional background for profit sharing bonus in Taiwan. Section 3 presents the theoretical and hypothesis developments and section 4 describes the sample and research design. Section 5 presents the primary results and section 6 concludes the study.
2. Earnings distribution for profit sharing bonus
schemes and dividends in
Taiwan
In Taiwan, profit-sharing bonus scheme is a common practice because
provlSlon 235 of the Company Law requires that all companies retain a
percentage of net income in each year for employee profit-sharing bonus. When allocating the net profits for each fiscal year
,
the company shall first offset its losses in previous years,
set aside 10% of the net profits as the legal capitalreserve, and then set aside a percentage of the remammg balance as the
profit-sharing bonus to employees and dividends to shareholders. The profit-sharing plan should be stated clear1y in their respective company articles. The bonus can be set as a fixed percentage (e.g., 4%), a range (e.g., 5%-10%), or a threshold (e.g., no less than 2%). Both dividends and employee profit sharing bonus can be distributed either in cash, in the fonn of shares or a combination of cash and shares. The amount distributed each year should be confmned by the resolution of the shareholder meeting. More specifically
,
the directors will call for a meeting to draft an eamings distribution plan in a few months after the fiscal year-end. The proposed profit distribution plan will be effective upon the approval of shareholders at the annual shareholder meeting.For example, as of June, 2006, Au Optronics Corp specifies the following distribution policy in its article of corporation: (1) at least 5% of the eamings for profit sharing bonus to employees, (2) at most 1 % of the eamings for profit
Chiao Da Management Review Vol. 33 No.2, 2013 7
sharing remuneration to board of directors
,
and (3) all or a portion of the remainder is distributable as dividends to shareholders. The appropriation of AUO's net eamings for employee profit sharing bonus and shareholder dividends can be distributed in cash or/and stocks. The policy for dividend distribution considers factors such as the current and future investment environments, fund requirements, domestic and intemational competition, capital budgets, the benefits to shareholders and long-term financial planning.E吐lÌbit 1 Panel A illustrates AUO's appropriation 企om the distributable eamings of2005; E油ibit 1 Panel B depicts the recording of the distribution in the consolidated statements of stoc尬。lders' equity for 2006. As shareholders' meeting is usually held within 6 months after the fiscal year end
,
the dividends and profit sharing bonus for eamings in 2005 are charged directly to retained eamings in 2006 in which the annual shareholder meeting approves these payments.In the example
,
it is clear that the stock/cash ratio for dividends is 1: 1 (i.e. $1,749,164:$1,749,164) in Au Optronics, but the stock/cash ratio for profit sharing bonus reaches 2.33:1 (i.e. $886,
051:$379,
736). This exhibits a payment asymmetry in the determination of the cash/stock forms between employee profit sharing bonus and dividends. As the article of corporations in AUO Co doesn't specify the policy for the distribution methods (i.e. cash or stock) of profit sharing bonus and dividends, board of directors have high discretion on this payment choices. Since 1980s, to at仕actthe talented high-tech staff from Silicon Valley,many firms in the high-tech indus的rin Taiwan incorporate the stock ownership in the profit sharing scheme by overweighting the stock bonus relative to cash bonus (Hung
,
1997). Profit sharing bonus can induce employees to exert a greater effort and to make more commitments in accomplishing its ultirnate goals,
thereby increasing company performance (Kruse,
1996). In addition,
the use of employee ownership in the profit sharing bonus can reduce the moral hazard problem in that they have both a general interest in profit maximization,
create peer grouppressure to ensure high performance standards across the firm
,
and facilitateintellectual capital f10w within the firm (Jensen and Meckling, 1976; Kruse, 1993). Many CEOs of the high-tech firms, such as Stan Shih of Acer, believe that
8 The Asymmetric distribution between Stock Bonus and Stock Dividends: Net lncentives or Entrenchments?
Exhibit 1 Illustration of AUO's earnings distribution and corresponding
accounting treatments PanelA:
PanelB:
Ba1aDCf at J I 8 01)' 1, 2"6 AJIII(可mtiIm值 lep! lr回l!Iæ
cash di羽曲扭曲
5個ddi可ideÐdS包5lwel叫deß 15!11ll1!1[.e of也mploye量5IIJCkbO:mH ~'profi誼通E祖~曲
ltemmJera甘ØD.tD曲'I!dm98IId
量苟t!I'V15OI'S
h姐DC.eof _ shares foc lII.I!I;eJ
E呵呵"!e盟"也呵圓圓.s!ilmll!ld
from !DI!Ip!ClII'值 QDI
區扭扭I[]! ofst,缸k 加 emp切"!e s llJd甸回ø.4!l(,畫面æ E血ct ofdi單可圓白圖tI! pu出PaDøn詛詛ws臨鹽'capîbl 包正lU5e5,1I“1IØ唱“包I!d ga.iD OI Io!i!i回fÏDlocwimtrumeJIts NE盟iDCmOe MiImiry函但聽聽iDæt iDCOme of E喝喝iaòes
UmealLzed ga祖祖 IVAÏIlblec 缸 5a1e fiDaDt:ial 誼民團軍 UmealLzed lossOD cash 動w
hedges
Foreign C\ID'四叮 ttamlaôon 吋區圓圓IIS
Adju5tD:擅自伽 d當時扭曲且
mmørttym圓圓挖
Ba1aDCf at DKulber 3丸"“
IJlstnbuhon olÐmml!S
1005
Legal 時en糟 Cashdivid血d St民k divid值4 E呻loyeebon宙間一扭曲 E呻,loyeeb個區管「個ck(81 par)R.ammmuioll to directot$ a:o.d a司p crVJSOfS 1,562.699 L749.164 1,749.164 379.736 削51二仁 21 仿7 C-面:111 甜1("1: R_iDPd...曹
N1mIbec Capihl C可!àl Le~ Special
巫盒里:L..J.惶盟且一星星墮藍色一盟國監~盟且」盟巴 5,自0,543 58,305,471 針,664,】44 4~,54j 201,809 1,562,699
:~
174,1>16 1,749,164 血~605 回6 ,051 1,4神,110 14;帶1,1個 妞,957,411 1~;062 224 2,242 ~,390 (28,峭的 7.573.403 75.734.02E HO.675.618 6S1:1244 m.m:區Chiao Da Management Review 均1. 33 No.2, 2013 9
employees' bonus in stock improves the competitive ability of their firms in the global economy.4
3. Literature Review and Hypothesis Developments
In this section we review the literature related to the incentive and entrenchment effects of stock bonus, and form the hypotheses.
3.1 Literature Review
3.1.1 Incentive Effects of Profit sharing Stock Bonus
Prior studies have found that profit sharing stock bonus can have incentive effects. First
,
rewarding profit sharing in stocks can induce employees to exert a greater effort or develop innovative ways to improve organizational performance (Fitzroy and Kraft, 1987; Cable and Wilson, 1989; Wadhwani and WaU, 1990; Weitzman and Kruse, 1990; Kruse, 1993; Bhargava, 1994). High-tech industry is a knowledge-intensive and capital-intensive industry,
and its task complexity is high. Since the supervlslOns costs are likely to be higher in professionaloccupations (Cheadle
,
1989),
stock bonus can enhance productivity in workplaces where supervision of employees is costly and employee shirking is a concem. (Shih, 2002). Second, as compared with fixed cash payment, stock bonus can reduce agency problems between the owners and the employees (Blasi et al.,
1996; Kruse,
1993). It can improve employee attitude,
reduce tumover among employees (e.g., Coyle-Shapiro et al., 2002), and lead to lower absenteeism and quit rates (Azfar and Danninger, 2001; Brown et al., 1999; Wilson and Peel,1991). Jensen and Meckling (1976) believe that the agency problem reduces as management ownership rises, because of the convergence-oιinterest hypothesis. Thus
,
market value increases with management ownership. Finally,
it can also encourage mutual monitoring and peer group press叮e (Baker et al.,
1987; Fitzroy4 Shih (2002), Chairman of Acer Inc., indicated that the employee bonus plan improves the development of high-tech industry in Taiwan. Taso (2002), Chairman of United Microelectronics Corp, expressed that the UDique employee stock bonus plan in Taiwan is one of the main factors that contribute to the competitive ability of the cornpany and it could significantly improve firm's operating performance.
10 The Asymmetric distribution between Stock Bonus and Stock Dividends: Net Incentives or Entrenchments?
and Kra缸, 1986; Kruse, 1993; Levine and Tyson, 1990). This can also generate a cooperative culture among employees and enhance firm performance.
Thus, stock bonus can promote worker productivity by encouraging work effort, cooperation, and sharing of ideas (Conte and Svejnar, 1990; Kruse, 1992, 1993).
3.1.2 Entrenchment Effects of Profit Sharing Stock Bonus
As senior management has substantial inf1uence over their pay,
entrenchment effect refers to bonus being paid in excess of the level 由atwould be optimal for shareholders. Many studies provide evidence that compensation is in excess and unrelated to fmn performance. While managerial incentives can inf1uence management decisions and mitigate various agency problems, Yermack (1995) find that the observed executive stock compensation in the U.S.A are not optimal. Bertrand and Mullainathan (2001) shows that executive pay responds as much to luck as to general performance. They interpret their results as evidence in support of managers benefiting at the expense of shareholders. Bebchuk
,
Fried,
and Walker (2002) argues that the absence of stock compensation which filter out general market increases and the near-uniform use of at-the-money options in compensation is consistent with the rent extraction perspective. Baber,
Janakiraman, and Kang (1988) also argue that outside directors lack the economic incentives to curb excessive compensation (Baker, Jens凹,and Murphy, 1987). Compensation committees do not play a proper job as they usually serve at the discretion ofCEOs (Shivdasani and Yermack, 1999).
In addition, stock bonuses issued to managers and staff members could potentially dilute share value and may have negative impact on shareholders' wealth. This is so-called the dilution effect. As employees' stock bonuses were not reported in the income statement
,
Dean and Unimonen (2002) argue that the unique accounting and reporting practice could severely damage the reliabili句, and transparency of accounting information in Taiwan because Investors would have to make their own adjustments on stock bonus when valuing a firm in Taiwan. As a consequence,
it is likely that investors cannot fully understand the implicationsChiao Da Management Review Vol. 33 No.2, 2013 11
of stock bonus, resulting in stock bonus being ove中aid. Thus, stock bonus can generate entrenchment effects
,
which may be detrimental to firm performance. 3.1.3 Net Effects of Profit Sharing Stock Bonus in TaiwanIn Taiwan
,
prior studies have provided evidence in support of the positive performance effects of profit sharing bus in Taiwan,
in support of a net incentive effect, (Guo et al., 2006; Lin and Chen, 2009; Jeng et al., 2009). However, these studies do not consider the cross-sectional variations of stock bonus and do not introduce a benchmark to measure the appropriate level of stock bonus. It is likely that stock bonus has net incentive effects up to a certain level, above which the entrenchment effects can outweigh the incentive effects. Thus, to fulfill the gap,this study benchmarks the stock/cash ratio of employee bonus against the stock/cash ratio of stock dividends
,
and examine whether such asymmetric distribution represents a net incentive or net entrenchment effect.3.2 Hypothesis Developments
Since asymmetric distribution relates to the tendency of stock/cash proportion for bonus being higher than that that for dividends
,
asymmetricdis甘ibution can also have two offsetting effects on firm performance: an incentive effect and an entrenchment effect. Thus, the extent to which the net effect between incentive and entrenchment effect of asymmetric distribution affects firm performance can only be empirically tested.
As asymmetric distribution refers to the tendency to issue more stock bonus than cash bonus, relative to the corresponding ratio for dividends, it is also motivated by the incentive theory of stock bonus. Cheadle (1989) argues that when the supervisions costs are likely to be higher in professional occupations
,
stock bonus can provide the incentives. Since high-tech industry is a knowledge-intensive and capital-intensive industry,
and its 個sk complexity is high,
1 expect that the asymmetric distribution can enhance productivity in workplaces. In addition,
profit sharing bonus can lead to lower absenteeism and quit rates (Azfar and Danninger, 2001; Brown et al., 1999; Wilson and Peel,12 The Asymmetric distribution between Stock Bonus and Stock Dividends: Net Incentives or Entrenchments?
than cash bonus
,
can accelerate the benefits of reducing quit rates among employees. Similarly, if profit sharing bonus can encourage mutual monitoring and peer group pressure (Baker et al., 1987; Fitzroy and Kraft, 1986; Kruse, 1993; Levine and Tyson,
1990),
1 expect that distributing bonus more in the form of stocks than cash can speed up a cooperative culture among employees,
which in tum can improve frrm performance.On the other hand, managers may have high incentives determine asymmetric distribution by allocating the firm's resources in their own best interest
,
which may conf1ict with the interests of outside shareholders. Prior literature has found some evidence supporting management's entrenchment in dividend policy strategies (Berger et al.,
1997). Executive directors may distribute stock bonus beyond the optimal point,
in order to increase their own compensation. La porta et al. (1999) also finds that investors in poor legal protection countries cannot use their legal powers to extract dividends from firms,
and receive less dividend payouts than firms in better legal protection countries. Thus, dividend payout policy can become a vehicle for managers in high-tech
indt泌的rto maxirnize their own compensation.
Thus
,
my hypotheses are non-directional as the net effect is an empirical question. If the incentive effect of asymmetric distribution dominations the entrenchment effects, 1 expect that asymme甘ic distribution can achieve higher financial performance. Since prior studies have provided evidence in support of the positive performance effects of profit sharing bus in Taiwan, (Guo et al.,2006; Lin and Chen, 2009; Jeng et al., 2009), the positive relationship between firm performance and employee stock bonus can increase with asymmetric distribution. Thus, 1 form Hla as follows:
Hla: If the incentive 吃ffect in asymmetric distribution outweighs its
entrenchment effe呦" positive association be伽棚! firm
performance and employee stock bonus can increase with asymmetric distribution.
On the other hand, if the tendency towards stock/cash distribution reflects managers' f1exibility at the board meeting to rnisallocate eamings distributions, it
Chiao Da Management Review Vol. 33 No.2, 2013 13
is expected that firm performance for these firms should be lower than the other firms. Based on the findings in support of the positive performance effects of profit sharing bus in Taiwan, (Guo et al., 2006; Lin and Chen, 2009; Jeng et al.,
2009)
,
this study expects that the positive relationship between firm performance and employee stock bonus can decrease with asymmetric distribution if entrenchment effect dominates its incentive e宜ect. H1 b is formed as fol1ows:Hlb: If the entrenchment 吃ffect in asymmetric distribution outweighs its
incentive 宅。ects, the positive association between firm
performance and en月ployee stock bonus can decrease with
asymmetric distribution.
4. Sample and Research Design
4.1
SampleAl1 accounting and finance data for Taiwanese high-tech listed companies for the years 1997 - 2007 is col1ected 企om Taiwan Economic Journal database.
Panel A of Table 1 shows that my original selection process started with 2
,
517 observations. 531 observations are removed for firms that do not distribute employee bonus and dividends; 77 observations are deleted if firms have missing value for corporate goveIτlance and outliers for the top and bottom 1 % of each variable. This leaves a total sample size for this study of 1,799 日口n-year observations.4.2
Model Specification4.2.1 The Link between Profit Sharing Bonus and Subsequent Performance As prior studies have provided evidence in support of the positive performance effects of profit sharing bus in Taiwan, (Guo et al., 2006; Lin and Chen, 2009; Jeng et al., 2009), equation (1) and (2) are constructed to ensure my results are comparable with prior studies.
14 The Asymmetric distribution between Stock Bonus and Stock Dividends: Net lncentives or Entrenchments?
RO~= α。 +αJRO~_J + α2BONUSt-l + α3SlZEt + 的LEV+ α5即叫+吭 (2)
Panel B of Table 1 depicts the coverage of high-tech industries. The high-tech industry covers six sub-industries by the indus甘y definitions of Taiwan Stock Exchange. TSE_24 is the industry for semiconductor and IC (integrated circuits) firms; TSE _25 is the computer-related industry; TSE _26 is LCD-related indus仕y;
TSE 27 is communication industry; TSE 28 is printed circuit board (PCB) industry; TSE 29 is 3C retailing and electronic equipments; TSE_30 is
so缸ware-relatedindustry; TSE _31 is other optoelectronics industry. Table 1
Sample Selection and Distribution Panel A :Sample Selection
High-tech fmns listed on the Taiwan Stock Exchange 企omyear 1997 to year 2007.
Less: fmns that do not distribute bonus and dividends Less: fmns that have missing value for c。中orategovemance variables
Less: outliers (in the top and bottom 1 % of each variables) Total observations for the estimation
Panel B: High-tech Industry Coverage Industry Firm-year observations 2,517 (531) (77) (110) 1,799 Freq. TSE_24: [IC subs仕ate,Diodes, power supply, foundry, IC tester, RAM, IC design , IC
mask, IC lead 企ame,electric equipments] 267
TSE_25: Home appliances and computer related (notebook, pc, motherboard, graphical
bo位d,tv c訂d,post terminal, server, monitor, scanner, pc peripherials, storage
device, CDROM, case, components, modem, 3C retail) 341 TSE_26: [LED, solar cells, LCD, LCD materials, monitoring systems, camera] 215
TSE_27: Communications [Flexible print circuit, connector, network card, mobile,
comrnunication device, telecommunication, network service, satellite,
stereo/speaker] 143
TSE_28: printed circuit board, FR-4, passive components, crystal 414 TSE_29: 3C retailing, component agents and other elec仕icequipments 136
TSE 30: so食wareand system integrations 92
TSE_31: other optoelec仕onics 191
Chiao Da Management Review Vol. 33 No.2, 2013 15
Where TOBINQt is measured as the market value of common stock equity plus book value of liabilities
,
divided by the book value of total assets of the firm at the end of the fiscal year; ROAt is return on shareholders' equity at year t;BONUSt-l is the bonus ratio
,
defmed as the market value of total employee bonus divided by total distributable net income at year t; SIZEt is the natural logarithmof total assets at year t ; RDt is R&D intensity at year t , which is defined as R&D expenditures divided by net sales; LEVt is totalliabilities to total assets.
Following prior studies ( Guo et al., 2006; Lin and Chen, 2009; Jeng et al.,
2009)
,
the performance measure as measured by market-based performance(TOBINQt) and accounting-based indicator (ROA t) is regressed on employee profit sharing bonus and a set of control variables (Morck et 叫, 1988; McConnel and Servaes, 1990; Cho, 1998; Woidtke, 2002; Yeh et al., 2001). To control for the sub-industry impacts
,
1 separate TOBINQ (ROA) into an industry component based on the median indust可 TOBINQ (ROA) and a fmn-specific component (i.e., ATOBINQt (AROAt)) and use firm-specific performance as the measure for firm performance. Further,
the coefficient on BONUSt_1 is the variable of interestswhich captures the sensitivity of profit sharing bonus to firm performance. Finally
,
several commonly used con仕01 variables are inc1uded. Firm performance in the previous year is inc1uded to address the causality issue and expect a positive relationship between RDt and firm performance,
because R&D proxies for a firm's investment (Morck et al., 1988; Woidtke, 2002; Yeh et al., 2001). 1 also expect a positive association between size and firm performance as larger firms have better disc1osure, more liquid trading, and more diversified activities leading to lower risks (Morck et al., 1988; Woidtke, 2002; Yeh et al., 2001). Following Yermack (1995),
fixed effect model is used to control for fmn effects as characteristics such as management skill. Finally, TobinQ and ROA in year t+ 1 are also examined because the future performance effects are likely to take some time to realize.16 The Asymmetric distribution between Stock Bonus and Stock Dividends: Net lncentives or Entrenchments?
4.2.2 The Association between Asymmetric Distribution and Subsequent Performance
This study first develops the measure of “the asymmetric distribution"
(ASYM-l).
R尺 stockbonus 'ya~_l /cash bonus•I
ASYM. , = 一」二一一
門 DSt_1 stock dividends 'ya~_l /cash dividends叫
Where ASYM-l is measured by the ratio of stock/cash proportion in
employee bonus relative to stock/cash proportion in dividends; BSt-1 is the
stock/cash proportion in employee bonus; DSt-1 is the stock/cash proportion in
dividends.
ASYM-l is interacted with BONUSt_l in equation (1) and (2). Equation (3) and (4) 的 forrnedas follows:
TOBINQ = 的 +αJTOBINQ_J+ α'ßOM底 +α3D1SP,_J + α DISP,_J X BONUSt-J + α SIZE
1(3)
+ρ LEY+ α RD.~.*ε
ROA1 = α。+禹 δAI一Iiα'jI1VfJ'us1_J + α DISP . +的DISP,_JX BONUS1_J + α SIZE 1(4)
+α6LEV+ α7RÐI_JI +81
Note 也別 the variable of interests in equation (3) and (4) is
DISp'一JxBONUS叫﹒ If the asymmetric distribution rep時sents a net incentive
effect, the coefficient on DISP,_J x BONUS叫 should be positive; conversely, if
the asymmetric distribution represents an entrenchment effect, the coefficient on
DIS
p,
_l x BONUS,叫 is negative.5.
Empirical Results5.1
Descriptive StatisticsTable 2 reports descriptive statistics of main variables. The mean (median)
values for TOBINQt. is 1.564 (1.298) respectively and the mean (median) values
for ROAt. is 0.122 (0.109) respectively. ATOBINQt and AROAt is the
industry-adjusted perforrnance measure at year t
,
calculated as the differencebetween TOBINQt (ROA t ) and the median value for the industry. BONUSt-l is
bonus ratio, calculated as the market value of profit sharing bonus divided by total
distributable net income at year t-1. The mean (median) value for BONUSt_1 is
Chiao Da Management Review Vo/. 33 No.2, 2013 17
BSt-1 (DSt-l ) is the proportion of stock bonus (stock dividends) to cash
bonus (cash dividends) at ye缸 t and the mean and median values for BSt-1 (DSt-l )
is 0.722 (0.546) and 0.80 (0.50), respectively. ASYU-I is the ratio of BSt-1 and
variable N Table 2 Descriptive Statistics mean std p25 p50 p75 TOBINQt 1,799 1.564 0.954 0.967 1.298 l.815 ATOBINQt 1,799 0.269 0.889 -0.276 0.037 0.506 ROAt 1,799 0.122 0.071 0.072 0.109 0.155 AROAt 1,799 0.02 0.071 -0.03 0.007 0.055 BONUSt_1 1,799 0.254 0.243 0.118 0.197 0.317 BSt_1 1,799 0.72 0.31 0.5 0.8 DSt_1 1,799 0.546 0.304 0.286 0.5 0.8 ASYMt_1 1,799 2.138 2.652 1.243 2 RDt 1,799 0.036 0.04 0.01 0.024 0.045 SIZEt 1,799 15.177 l.26 14.289 14.952 15.779 LEVt 1,799 0.364 0.14 0.256 0.363 0.47 FMDMt_1 1,799 0.216 0.412 0 0 0 BDSZ叫 1 ,799 6.468 1.55 5 7 7 BDSHt_1 1,799 0.223 0.11 0.143 0.201 0.287 BLKSH叫 1,799 0.14 0.09 0.073 0.129 0.19 INDSTt_1 1,799 0.152 0.164 0 0 0.286 INSTt_1 1,799 0.019 0.03 0 0.005 0.027 FINSTt_1 1,799 0.001 0.005 0 0 0 DUALt_1 1,799 0.354 0.478 0 0 扎1GR SHAREt_1 1,799 0.023 0.032 0.002 0.009 0.032
Note: a All fmns are listed on the Taiwan Stock Exchange from 1997 to 2007 and all the data are ∞llected 企omthe Taiwan Economic Journal (TEJ) database.
b TOBINQt is profitability at year t, defmed as the sum of market value of common stock,也e
liquidation value of preferred stock and total debts divided by total assets; ATOBINQt is indus的r-adjusted TOBI1'時,calculated as the difference between TOBINQ and the median value for indus仕y TOBINQ. ROAt is retum on shareholders' assets at year t; AROAt is indus昀r-adjusted ROA, the difference between ROA and the median value for ROA. BONUSt_1 is the bonus ratio, defmed as market value of total employee bonus divided by
total distributable net income at year t-l; Assetst is total assets at year t in New Taiwan Dollars. SIZEt is the natural logarithm of total assets at year t; LEVt is total liabilities to total assets; RDt is R&D intensity at year t, defmed as R&D expenditures divided by net sales; ASYMt_1 is asymmetric distribution of stock/cash distribution as measured by the
ratio of stock/cash proportion in employee bonus relative to stock/cash proportion in dividends; BSt_1 is 也e stock/cash proportion in employee bonus; DSt_1 is the stock/cash
proportion in dividends. Fl\位)Mt﹒1 equals to one if the fmn is a family-controlled firm, and zero otherwise; BDSZt_1 is board size in seat number; BDSHt_1 is the shareholding by board
18 The Asymmetric distribution between Stock Bonus and Stock Dividends: Net Incentives or Entrenchments? of directors; BLKSHt_1 is outside blockholder shareholding; 到DSTt_1 is the percentage of independent board member; INSTt_1 indicates the percentage of stocks by domestic fmancial institutions; FINSTt_1 is the percentage of stocks by foreign fmancial institutions; DUALt_1 equals to one when the CEO serves as chair of the board and zero otherwise; MGR_SHARE t_1 is the shareholdings by managers.
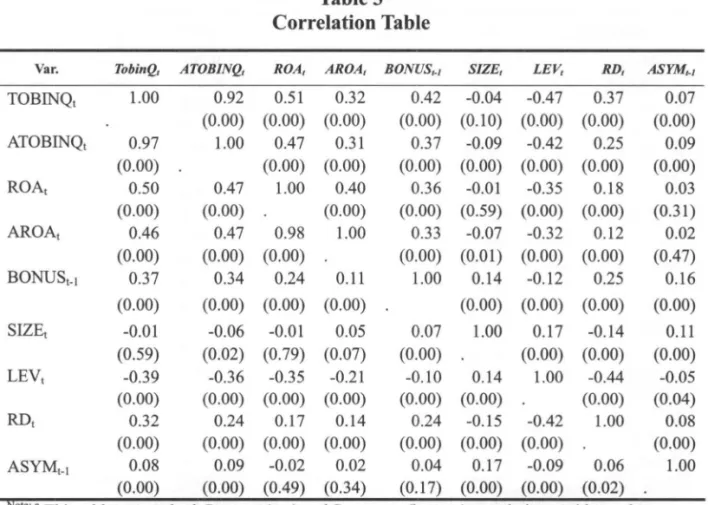
Table 3 Correlation Table
Var. Tob的。 ATOBINQ, ROA, AROA, BONUS,叫 SIZE, LEV, RD, ASYM叫
TOBINQt 1.00 0.92 0.51 0.32 0.42 -0.04 -0.47 0.37 0.07 (0.00) (0.00) (0.00) (0.00) (0.10) (0.00) (0.00) (0.00) ATOBll、~Qt 0.97 1.00 0.47 0.31 0.37 -0.09 -0.42 0.25 0.09 (0.00) (0.00) (0.00) (0.00) (0.00) (0.00) (0.00) (0.00) ROAt 0.50 0.47 1.00 0.40 0.36 -0.01 -0.35 0.18 0.03 (0.00) (0.00) (0.00) (0.00) (0.59) (0.00) (0.00) (0.31) AROAt 0.46 0.47 0.98 1.00 0.33 -0.07 -0.32 0.12 0.02 (0.00) (0.00) (0.00) (0.00) (0.01) (0.00) (0.00) (0.47) BONUSt_1 0.37 0.34 0.24 0.11 1.00 0.14 -0.12 0.25 0.16 (0.00) (0.00) (0.00) (0.00) (0.00) (0.00) (0.00) (0.00) SIZEt -0.01 -0.06 -0.01 0.05 0.07 1.00 0.17 -0.14 0.11 (0.59) (0.02) (0.79) (0.07) (0.00) (0.00) (0.00) (0.00) LEVt -0.39 -0.36 -0.35 -0.21 -0.10 0.14 1.00 -0.44 -0.05 (0.00) (0.00) (0.00) (0.00) (0.00) (0.00) (0.00) (0.04) RDt 0.32 0.24 0.17 0.14 0.24 -0.15 -0.42 1.00 0.08 (0.00) (0.00) (0.00) (0.00) (0.00) (0.00) (0.00) (0.00) ASYMt_1 0.08 0.09 -0.02 0.02 0.04 0.17 -0.09 0.06 1.00 (0.00) (0.00) (0.49) (0.34) (0.17) (0.00) (0.00) (0.02) Note: a This tab1e reports both Pearson (top) and Spearman (bottom) corre1ations, with p-va1ues are
reported in parenthese.
b The overall sample size is 1,799. All frrms are listed on the Taiwan Stock Exchange from
1997 to 2007 and all the data are collected 企om the Taiwan Economic Journal (TEJ)
database. TOBINQt is profitability at year t, defmed as the sum of market value of common stock, the liquidation value of preferred stock and total debts divided by tota1 assets;
ATOB的Qtis industry-adjusted TOBINQ, ca1cu1ated as the difference between TOBINQ and the median value for industry TOBINQ. ROAt is return on shareholders' assets at year t; AROAt is indus缸子adjusted ROA, the difference between ROA and the median value for ROA. BONUSt_1 is the bonus ratio, defmed as market value oftotal employee bonus divided by total dis甘ibutablenet income at year t-1; SIZEt is the naturallogarithm of total assets at year t; LEVt is totalliabilities to total assets; RDt is R&D intensity at year t, defmed as R&D expenditures divided by net sales; ASYMt_1 is asymmetric distribution as measured by 也e ratio of stock/cash proportion in employee bonus relative to stock/cash proportion in dividends
Chiao Da Management Review Vol. 33 No.2, 2013 19
DSt-1. and the mean (median) value for ASYU-l is 2.138 (1.243). It is quite c1ear that board of directors tend to distribute profit sharing bonus in the form of shares as opposed to the cash distribution for shareholder dividends. Further, R&D expenditure takes around 3.6% of net sales. The median values of size (SIZEt ) and leverage (LEVt) is 14.95 and 0.36, indicating that the size for the high-tech
industry is generally not large and the financial risk is generally quite low.
Table 3 reports the Pearson product-moment between the variables. The market value for employee bonus (BONUSt_1) is positively correlated with the subsequent-year firm performance measures
,
TOBINQt,
ATOBINQt,
ROAt,
AROAt ASYU-l is positively associated with TOBINQt and ATOBINQt, consistent with incentive hypothesis. 1 also examine variance inflation factors (VIF) to check for multicollinearity and find that the values are less than 3,
well below the conventional cutoff value of 10th前 indicates excessive multicollinearity. Hence,
multicollinearity is not a concem in our tests.5.2
Regression Results5.2.1 The Association between Firm Performance and Profit Sharing Bonus Table 4 frrst presents regression estimate (1) that 1inks firm performance to profit sharing bonus. Firm performance is regressed on the profit sharing bonus
(BONUSt_1) along with control variables. BONUSt_1 is positively associated with firm performance for both market-based performance measure
,
TOBINQt and accounting-based performance measure, ROAt. As the results using TOBINQ andROA at time t are qualitatively similar to the results using TOBINQ and ROA at time t+ 1, 1 will only discuss the results for performance measured at time t.
Using TOBINQt (ATOBINQt) as a performance measure, Panel A shows that the coefficient on BONUSt_1 is 1.239 (1.036), significant at the 1% leve1. Using ROAt (AROA t) as a performance measure
,
Panel B also shows 也atthe coefficient on BONUSt_l is 0.058 (0.056),
significant at the 1% leve1. Controlling for the industry effects in the regression does not change the results. This suggests that profit sharing bonus overall can improve firm performance and valuation. Among20 The Asymmetric distribution between Stock Bonus and Stock Dividends: Net Incentives or Entrenchments?
the other control variables, R&D is positively associated with firm performance
measure, and leverage and size are negatively associated with firm performance.
Table 4
Firm Performance and Employee Profit Sharing Bonus
Panel A Tobin's
Q
and employee bonusTOBINQt = α。 +αJTOBINQ叫 +α'2BONUS,叫 +αßIZEt+ 的LEV+ α5RÐt-Jt +Et
ill
TOBINØ TOBINQ,+J ATOBINQ, ATOBINØ+J
INTERCEPT 2.151 2.792 0.869 0.843 (8.88)... (9.64f.. (3.56)叫 (2.99).. TOBINQt.1 0.351 0.343 0.296 0.292 (9.78)叫 (9.75)..
.
(8.41f.. (8.33)... BONUS叫 1.239 1.170 1.036 1.034 (7.26f.. (7.02f.. (6.86)向 (6.71) SIZEt -0.042 -0.076 -0.018 -0.014 (-2.65) •• (-4.49) ••• (-1.20) (-0.82) LEVt -1.613 -1.555 -1.650 -1.741 (-9.90)... (-9.72) (-1 1.1 0)叫 (-1 1.65)叫 RDt 1.750 0.l62 0.602 0.888 (2.60f. (0.24) (0.93) (1.32)Control for Indus位y Yes Yes Yes Yes
N 1,799 1,799 1,799 1,799
a句 R2
0.355 0.379 0.299 0.299
Panel B Return on Assets (ROA) and employee bonus
R04= α0+ αJR04勻-J + α2BONUSt_J + α3SIZEt + α4LEV+ α5RDt-Jt + ε (2)
ROAt ROA,+J AROAt AROA,+J
INTERCEPT 0.l40 0.l74 0.108 0.122 (7.14)... (8.30)... (5.43)... (5.68)... ROAt_1 0.365 0.347 0.362 0.359 (13.56)... (1 2.95)叫 (12.l9)... (12.06)... BONUSt_1 0.058 0.053 0.056 0.054 (3.99)... (3.85f.. (3.96)... (3.86)... SIZEt -0.001 -0.004 -0.003 -0.004 (-0.77) (-3.14).. (-2.40f (-2.77).. LEVt -0.134 -0.133 -0.131 -0.135 (-10.77)... (-10.54)叫 (-10.43)叫 (-10.38)叫 RDt -0.061 -0.148 -0.l37 -0.154 (-1.14) (-2.72f. (-2.60f. (-2.80f.
Con仕01for Indu的y Yes Yes Yes Yes
N 1,799 1,799 1,799 1,799
Chiao Da Management Review Vol. 33 No.2, 2013 21
Note: a The overall samp1e size is 1,799. All frrms are listed on the Taiwan Stock Exchange 企om
1997 to 2007 and all the data are collected 企om the Taiwan Economic Journa1 (TEJ)
database.
bTOBn、~Qtis profitabi1ity at year t, defined as the sum of market va1ue of common stock, the liquidation va1ue of prefe訂ed stock and tota1 debts divided by tota1 assets; ATOBINQt is indus句叫justedTOBINQ, calcu1ated as the difference between TOB的Qand the median va1ue for indl泌的r TOBINQ. ROAt is retum on shareho1ders' assets at year t; AROAt is
indus釘子adjusted ROA, the difference between ROA and the median va1ue for ROA.
BONUSt_1 is the bonus ratio, defmed as market va1ue of tota1 emp10yee bonus divided by
tota1 distributab1e net income at year t-l; SIZEt is the natura1 10garithrn of tota1 assets at year t; LEVt is tota1 1iabi1ities to tota1 assets; RDt is R&D intensity at year t, deflOed as
R&D expenditures divided by net sa1es.
C t statistics in parentheses: p < 0.05, •• p < 0.01, ••• P < 0.001
5.2.2 The Association between Firm Performance and Profit Sharing Bonus with Respect to the Asymmetric Distribution.
Table 5 presents regression estimates of firm performance and profit sharing bonus (BONUSt_J) with respect to ASY
Mr
-J, along with the interaction terms between ASYMr
-J and profit sharing bonus (BONUSt-J). The estimatedcoe:fficient of the interaction term is significantly positive at the 1% level. Using
TOBINQr (ATOBINQr) as firm performance
,
Panel A reports that the coe:fficient onDIS~_l x BONUS叫 is 0.104 (0.096), significant at the 1 % level. Similarly, using
TOBINQt+J (ATOBINQt+J) as firm performance
,
the coe:fficient onDIS~_l x BONUS,叫 is0.100 (0.098), significant at the 1 % level. In Panel B, ROAt (AROA t) is used as firm performance and fmd that the coe:fficient on
DIS~_l X BONUSt_1 is 0.003 (0.003), significant at the 1 % level. The results are the same when using performance at t+ 1.
Overall
,
my results indicate that the positive association between firm performance and profit sharing bonus increases as ASYM increases. Thus, results in Table 5 generally support a net incentive the。可 that asymme仕ic distribution signals a commitment to attract talented manpower in inventing inventions,
and generate more capital gains for shareholders. Shareholders would like to combine employee ownership with employee bonus to reduce the agency problems between managers and shareholders.22 The Asymmetric distribution between Stock Bonus and Stock Dividends: Net lncentives or Entrenchments?
Firm Performance and the Dispersion of Stock/cash Proportion between
Employee Bonus and Dividends
Panel A Tobin Q and employee bonus
TOBINQ, = α。 +α}TOBINQt-l + αßONUS,_}+α3AS凹,-}+α4ASYM,_}X BONUSt-l + αsSIZE'(3)
+α'6LEV + α7RD叫,+&, 罰。'BINQ, 2.235 (8.69) ••• 0.338 (8.74) 1.073 (5.88) -0.039 (-4.14)'" 0.104 (4.46) -0.043 (-2.51)* -1.577 (-9.40)'" 1.602 巴37)* Yes E可TERCEPT TOBINQt_1 BONUSt_1 ASYM叫 ASYMt_1x BONUSt_1 SIZEt LEVt RDt Table 5 I1.7.5.3. 。 "0.5.7 、 l lt9"2HIH3"0.8 " lH47-28)3) 。)。 )1) 。 )5)OO HZ 句 4 . 勻 , “ -nu --A q d-KUAU 」 的 23o r b-7050203 」 2 航叫」 肢。但仔刁川廿 48! F J ' ,‘ 、 ' ,‘、 ' ,‘ 、 mb Yes 、h H 弓 3 神。。坤 Q J 叫 后 V 九 川, ' , 反 U 神 Q J 丙 川 YO O 呻 勻毛巾巾 , Hι= 、 J 恥 7 劇。。恥 1 , 2ny 刷 248 恥, 3M V0)2)8) 。 70) 。 85)35 一 叫 lna 泣 a 到收」 tmmn 吼」斗 Man 門 J HA 守句 /qdd 司司令, 4. 可 nu 到 rtrt r Ir--Ary Yes ATOBINQ,+} 1.016 (3.40)'" 0.275 (7.46)'" 0.881 (5.41)'" -0.019 (.1.99)* 0.098 (4.04)'" -0.026 (-1.48) -1.669 (-10.98)'" 0.640 盟主i Yes Control for Industry
N 1,799
adj. R2 0.361
Panel B ROA and employee bonus
ROA, = α。 +α)ROA,_}+ αßON凶,-} +α3DIS~_} + 叫DIS~_}x BONUS,←}+αsSIZE, (4) 1,799 0.384 1,799 0.308 1,799 0.308 +α6LEV+ α7RÐI_}1 +&1
ROA, ROA什I AROA, AROA,+}
INTERCEPT 0.130 0.165 0.099 0.113 (6.36) (7.46) (4.72)'" (4.96) ROAt_1 0.376 0.356 0.372 0.369 (13.33)'" (12.67) (11.92)'" (11.76) BONUSt_1 0.048 0.044 0.047 0.045 (3.13)" (3.04) (3.13)" (3.07) ASYMt_1 -0.002 -0.001 -0.001 -0.001 (-3.29)" (-3.13)" (-2.01) (-2.17)" ASYMt_1 x BONUS叫 0.003 0.003 0.003 0.003 (1.98) • (1.89) (2.23) (2.03) SIZEt 0.000 -0.003 -0.002 -0.002 (0.11) (-2.10) (-1.47) (-1.73) LEVt -0.138 -0.138 -0.135 -0.140 (-10.48) (-10.27) (-10.09) (-10.07) RDt -0.064 -0.148 -0.141 -0.154 去l.l 9) (-2.66)" 去2.63)** (-2.73)"
Control for Industry Yes Yes Yes Yes
N 1,799 1,799 1,799 1,799
Chiao Da Management Review Vol. 33 No.2, 2013 23
Note : a The overall sample size is 1,799. All fmns are listed on the Taiwan Stock Exchange 企om
1997 to 2007 and all the data are collected 台om the Taiwan Economic Joumal (TEJ) database.
b TOBINQt is profitability at year t, defmed as the sum of market value of common stock,吐le
liquidation value of preferred stock and total debts divided by total asse悅 ATOBINQt is
industry-adjusted TOBINQ, calculated as the difference between TOBINQ and the median value for industry TOBINQ. ROAt is retum on shareholders' assets at year t; AROAt is
industry-a甸閻健d ROA, 也e di宜erence between ROA and the median value for ROA.
BONUSt_1 is the bonus ratio, defined as market value of total employee bonus divided by total dis甘ibutablenet income at year t-l; ASYMt_1 is asymmetric distribution of stocklcash distribution as measured by the ratio of stocklcash proportion in employee bonus relative to stocklcash proportion in dividends; SIZEt is the naturallogarithm of total assets at year t; LEVt is total liabilities to total assets; RDt is R&D intensity at year t, defmed as R&D expenditures divided by net sales.
C t statistics in parentheses -p < 0.05,一 p< 0.01, ---p < 0.001
6.
Additional Tests 6.1 Self-Selection bias and EndogeneitySince asymmetry between stock bonus and stock dividends could be the result of self-selection and the factors that detennine the asymme甘y can also influence finn value
,
a Heckman (1979) two-stage model is used to control for the endogeneity of the asymme甘y. The first stage is a Probit model that includes the 可pe of subsample as a dependent variable (1 for the “high-asymr凹的," subsample,
and 0 for the “low-asymme句"subsample). 1 transfonn ASYM into a binary variable based on whether ASYM is above or below the industry median,coding it as 1 for high ASYM and 0 for low ASY
M.
The detenninants include finn size as measured by the log of total assets, leverage as measured by total debts divided by total assets, R&D intensity, as measured by R&D expenditures divided by net sales, growth, as measured by the market to book ratio of shareholders' equity, an indicator for family finns, board size, the shareholding by board of directors, outside blockholder shareholdings,
the percentage of independent board member
,
the percentage of stocks by domestic financial institutions,
the percentage of stocks by foreign financial institutions, an indicator for whether the CEO serves as chair of the board, and the shareholdings held by managers. Govemance and finn characteristics are24 The Asymmetric distribution between Stock Bonus and Stock Dividends: Net Incentives or Entrenchments?
Table 6
Heckman Model
Panel A: the Determinants ofDispersion Stock/cash Proportion between
Employee Bonus and Dividends and Corporate Govemance
丹 O吋b(凶A必SYM,κ,-})
+卅α9DUAL'_J+ α內l川oMG倪R SHARE叫+ α吼lυ}L臼E Tt凡九;iiL--刊.}+吭I2α SIZ咒ER,←叫-}汁+α叫I日3Growt吶h,叫-}汁+α科/3井RD丸←叫l
Coefficient INTERCEPT -0.336 FMDM 0.104 sz -0.059 BDSH -1.502 BLKSH -0.198 B也ST 。.538 。~ST 4.441 F卦~ST 10.082 DUAL -0.124 MGR SHARE -0.698 LEV, -0.628 SIZE, 0.131 GROWTH, 。.091 RD, 14.863
Control for Indusuy Yes
N 1,799
Wald Chi2 720.27
Panel B firm performance and asymmetric distribution
ATOBINQ, ATOBINQt+} AROA,
INTERCEPT 1.050 。782 。227 (1.53) (l.l 1) (3.74) TOBINQ'.I 0.265 。259 0.331 (9.78)"" (9.54) (12.14) BONUS,., 1.110 1.093 0.041 (9.26) (9.09) (4.19) ASYM,., 0.008 0.007 -0.002 (0.68) (0.59) (-1.62) ASYM'.I x BONUS叫 0.067 0.069 0.004 (2.81) (2.93) (2.08) SIZE, -0.040 -0.030 -0.009 (-1.20) (-0.88) (-3.22) LEV, -1.467 -1.591 -0.098 (-5.17) (-5.54) (-3.91) RD, 0.896 1.343 -0.182 (1.22) (1.66) (-2.84)" Mills ratio -0.098 -0.027 -0.040 (-0.28) 去。加i 去1.3 0)
Control for lndus甘y Yes Yes Yes
t-va1ues (-0.34) (0.70) (-19.54) 4) (-2 (-0.28) (2.19) (1.97) (2.53) (-0.99) (-(3-0839.40)0).) •• (2. (I4967)). • (4.46) Yes 1,799 AROA,刊 0.233 (3.79) 0.327 (11.91) 0.040 (4.11) 。002 (-1.85) 0.004 (1.98) -0.009 (-2.96) -0.107 (-4.25) -0.159 (-2.28) -0.037 去!.l!2 Yes N 1,799 1,799 1,799 1,799
Note可aThe overall sample size is 1
,799. A11 firms are listed on the Taiwan Stock Exchange from
1997 to 2007 and all the data are collected 企om the Taiwan Economic Journal (TEJ) database. Heteroscedasticity consistent t statistics are reported in parentheses.
b
ASYMt is the asymmetric dis仕ibutionof stock/cash dis仕ibutionas measured by the ratio of stock/cash proportion in employee bonus relative to stock/cash proportion in dividends; 凹的Mtequals to one if the fmn is a family-controlled fmn
, and zero otherwise; BDSZt is
board size in seat number; BDSHt is the shareholding by board of directors; BLKSHt is
Chiao Da Management Review Vol. 33 No.2, 2013 25
INSTt indicates the percentage of stocks by domestic financial institutions; FINSTt is the
percentage of stocks by foreign fmancial institutions; DUALt equals to one when the CEO
serves as chair of the board and zero otherwise; MGR _ SHARE is the shareholdings by
managers. LEVt is total liabilities to total assets; SIZEt is the natural logarithm of total
assets at year t; Growtht is the market to book ratio of shareholders' equity; RDt is R&D
intensity at year t, defined as R&D expenditures divided by net sales. C t statistics in parentheses • p < 0.05, •• p < 0.01, ••• p < 0.001
commonly employed in prior research (e.g.
, Young and Wu
,
2009; Coles et al.,
2005; Anderson et a
l.,
2004; Beasley,
1996; Chung et al.,
2002). The inverseMills ratio (lMR) generated from the frrst stage is then added to Model (3) and (4)
as the second-stage regression. Table 6 shows the results. The results for the
second stage regression remain unchanged
,
indicating that the results in the maintests are not driven by the self-selection bias of asymme的'.
7. Conclusion
This paper documents the relationships between profit sharing bonus and
firm performance for public1y traded corporations in the high-tech indus甘y of
Taiwan. As employee stock bonus in Taiwan is part of the profit sharing scheme
,
the decision for the amount and the method of profit sharing bonus is usually
made along with the decision for shareholder dividends. The main contribution of
this paper is disentangling the incentive and entrenchment effects of the profit
sharing stock bonus practice that rarely exists in US data. Firm valuation
generally increases with the profit sharing bonus. This result is consistent with a
large literature on the positive incentive effects associated with increased
employee stock bonus (Conte and Svejnar
,
1990; Kruse,
1992,
1993; Lin andChen
,
2009; Jeng et al.,
2009). The results also fmd that the positive relationshipbetween employee bonus and future performance can increase with asymme仕lC
distribution. The results are supportive of the prior literature that stock compensation can help align the interests between shareholders and the firm and can mitigate the agency problems between shareholders and managers.
This study is subject to a few limitations. First, 1 use Taiwan firms as our
26 The Asymmetric distribution between Stock Bonus and Stock Dividends: Net lncentives or Entrenchments?
generalizability of the results. Second, the results are subject to the robustness of
the measure for asymmetric distribution-the stockJcash proportion of employee
bonus relative to the stockJcash proportion of dividends, and two performance
measures - TOBINQ and ROA. In addition, the effect of asymmetric dis仕ibution
might be reflected in other outcomes. Future research can employ other research designs to validate whether benefits stil1 outweigh the costs of asymmetric distribution.
Reference
Aboody, D. (1996),“Market Valuation of Employee Stock Options," Journal 01
Accounting and Economics, 22,357-391.
Anderson, R. c., Mansi, S. A. and Reeb, D. M. (2004),“Board Characteristics,
Accounting Report Integri旬, and the Cost of Debt," Journal 01 Accounting
αnd Economics, 37(3), 315-342.
Azfar, O. and Danninger, S. (2001),“Profit-sharing, Employment Stability, and Wage Growth," lndustrial and Labor Relations Review, 54(3), 619-630. Baber, W., Janakiraman, S., Kang, S. (1996),“Investment Opportunities and the
Structure of Executive Compensation
,"
Journal 01 Accounting andEconomics, 21(3), 297-318.
Baker, G. P., Jensen, M. G. and Murphy, K. J. (1987),
Incentives: Practice vs. Theory," The Journal
0/
Finance, 的 (3), 593-616. Beasley, M. S. (1996),“An Empirical Analysis of the Relation between the Boardof Director Composition and Financial Statement Fraud," The Accounting
Review, 71(4), 443-465.
Bebchuk, L.A., Fried, J.M., Walker, D.I. (2002),“Managerial Power and Rent Extraction in the Design of Executive Compensation," University
0/
ChicagoLaw Review, 69(3), 751-846.
Berg位, P. E., Ofek, E. and Yermack, D. (1997),“Managerial Entrenchment and Capital Structure Decisions," Journal 01 Finance, 52(4), 1411-1438.
Bertrand, M., Mullainathan, S. (2001),“Are CEOs Rewarded F or Luck? The
Chiao Da Management Review Vol. 33 No.2, 2013 27
901-932.
Bhargava
,
S. (1994),
Evidence 企om U.K. Panel Data," The Economic Journal, 104(426),
1044-1056.
Blasi, 1., Conte, M. and Kruse, D. (1996),“Employee Stock Bonus and Corporate
Performance among Public Companies," lndustrial and Labor Relations
Review, 50(1), 60-79.
Brown, S., Fakhfakh, F. and Sessions, 1. G. (1999),“Absenteeism and Employee
Sharing: An Empirical Analysis Based on French Panel Data, 1981-1991,"
lndustrial and Labor Relations Review
,
52(2),
234-251.Cable,1. and Wilson, N. (1989),“Profit-sharing and Productivity: An Analysis of
UK Engineering Firms," The Economic Journal, 99(396), 366-375.
Cheadle, A. (1989),“Explaining Pattems of Profit-sharing Activi句," lndustrial
Relations, 28(3),387-400.
Cho, M. H. (1998),“Ownership Structure, Investment, and the Corporate Value:
An EmpiricalAnalysis," Journal ofFinancial Economics, 47(1), 103-121.
Chung
,
C. W. (2004).“
Employee Bonus in Share Form,
Dividends in Cash Formand Dilution Effects
,"
Money Watching & Credit Rating,
133-142.Chung, R., Firth, M. and Kim, J. (2002), “Institutional Monitoring and
Opportunistic Eamings Management," Journal of Corporate Finance, 8(1),
29-48.
Coles, J., Daniel, N. and Naveen, L. (2005),“Boards: Does One Size Fit All?"
Working Paper, Arizona State University and Purdue University.
Conte, M. and Svejnar, 1. (1990), “The Performance Effects of Employee
Ownership Plans." in Blinder, A. (ed.), P句lÏngfor Productivity: A Look at
the Evidence, (143-181), Washington, D.
c.:
The Brookings Institution.Coyle-Shapiro, J., Moηow, P., Richardson, R. and Dunn, S. (2002),“Using Profit
Sharing to Enhance Employee Attitudes: A Longitudinal Examination of the E宜的ts on Trust and Commitment," Human Resource Manα~geme肘, 41(2),
423-439.
Dean, J. and Uimonen, T. 2002,“Taiwan Bonus Triggers Concems-Huge Stock
28
Street Journal (July 18).
The Asymmetric distribution between Stock Bonus and Stock Dividends .Net Incentives or Entrenchments?
Fenn, G. W. and Liang, N. (200 1),“c。中orate Payout Policy and Managerial Stock Incentives," Journal 01 Financial Economics, 60(1),45-72.
Fitzroy, F. and Kraft, K. (1987),
Quαrt,缸erl砂yJournαalofEconomηû化cs丸, 102(1η), 2幻3-3封5.
Guo, W. 仁, Shiah-Hou, S. R. and Yang, Y. W. (2006), “Stock Bonus Compensation and Firm Performance in Taiwan," lnternational Review of
Finance, 32 (11), 862-885.
Heckman, J. (1979), “Sample Selection Bias as a Specification Error,"
Econometrica, 47(1), 153-161.
Hung, Yi-Yang. (1997),“New Strategy for Corporations to Hunt for People: The Talented Fly with Stock," Common Wealth Magazine, (197), 122-133.
Jeng, v., Fok, R. and Chang, Y. (2009),“Effects of Employee Stock Bonuses on Technical Efficiency: Evidence 台om Taiwan's Electronic Industry," NTU
Management Review, 20(1), 331-354.
Jens凹, M. C. and Meck1ing, W. H. (1976),“Theory of the Firm: Management Behavior, Agency Costs and Ownership Structure," Journal of Financiαl
Economics, 3(4), 305-360.
Kruse, D. (1992),“Profit Sharing and Productivity: Microeconomic Evidence from the United States," The Economic Journal, 102(410),24-36.
Kruse, D. L. (1993),“Profit Sharing: Does it Make a Difference?" Kalamazoo, Michigan: W. E. Upjohn Institute for Employment Research.
Kruse, D. L. (1996),“Why do Firms Adopt Profit-Sharing and Employee Ownership Plans?" British Journal oflndustrial Relations
,
34(4),
515-538. La Porta, R., Lopez-de-Silanes, F. and Shle臼ifer.丸" A. (1999),a缸ro∞un吋d theWo叫rld,"Journal 01 F只inαnce, 54(2),471-517.
Lambert, R. A., Lanen, W. N. and Larcker, D.F. (1989),“Executive Stock Option Plans and Corporate Dividend Polic扣cy," Journal 01 Fina悶αn前t叮ci泊α1 and Quα 叫tωα ti 陀Anaf;鈔J心叫si,吋i
Levine院, D. 1. and Tyson, L. (1990),“Participation, Productivity, and the Firm's Environment," in Pay for Productivity: A book at the Evidence, Blinder, A.