桑色素之藥物動力學及其對環孢靈吸收之影響; Morin pharmacokinetics and the the effect of morin on cyclosporin absorption
75
0
0
全文
(2) 震顫、高血壓、高血鉀症等副作用[15],因此任何影響 cyclosporin 吸 收的因素應對臨床治療之結果甚為重要。此藥主要由 CYP3A4 代謝 [16]. ,CYP3A4 主要存在於肝臟與腸道[17-23] ,研究指出當 cyclosporin. 與 ketoconazole、erythromycin、grapefruit juice 等 CYP3A4 抑制劑併 服時[24],會提高 cyclosporin 之血中濃度,因此必須減少 cyclosporin 的使用劑量。 腸內的另一影響吸收之因素為運輸蛋白 P-glycoprotein (P-gp),它 可將藥物如 cyclosporin、FK 506、taxol、diltiazem、dexamethazone、 erythromycin 及 protease inhibitors 等由腸細胞送回腸腔[25,26],因而降 低藥物之吸收,最近的研究報告指出 P-gp 對 cyclosporin 的吸收顯得 比腸的 CYP3A4 來得重要[27]。因此影響 P-gp 活性的化合物可能改變 cyclosporin 的吸收。P-gp 存在於許多正常組織中,如小腸及大腸的刷 狀緣、腎上腺皮質,腦部及胰臟導管上皮細胞等,是細胞防禦外源物 的一種機制。口服藥物必須通過小腸上皮細胞吸收才能進入血流,而 P-gp 會主動將其受質由腸細胞傳送回腸腔,而限制了吸收。1994 年 有一研究黃酮類化合物對 HCT-15 colon cells 中 adriamycin 蓄積之影 響的報告顯示,除了 diosmin 之外的多數黃酮類對 P-gp 均有急性提升 其活性的作用,其中桑色素減少 adriamycin 之蓄積約 30 %[28]。本研 究藉口服單獨給予大白鼠 cyclosporin 及併服桑色素,以瞭解桑色素. 2.
(3) 對 cyclosporin 吸收之影響。 另外,葡萄柚汁是 CYP3A4 的抑制劑[29],與其他 CYP3A4 所代 謝的藥物,如 nifedipine,felodipine,cyclosporin,terfenadine 等併用 時之安全性值得重視 [31]. 化作用. [30]. 。最近的一篇報告顯示葡萄柚汁對 P-gp 為活. ,然而與臨床上發現葡萄柚汁增加許多 CYP3A4 受質之血. 中濃度的現象相矛盾,因此我們對葡萄柚汁主成分的代謝物 naringenin 與 quercetin 究竟是 P-gp 活化劑或抑制劑感到好奇。因此本 研究藉由體外翻腸實驗以探討桑色素、槲皮素及柚皮 元之三種黃酮 類. 元對 P-gp 活性的影響。. 3.
(4) 第二章. 第一節. 總論. 桑色素之結構與理化性質. 桑色素(morin). 化學名[32]: 2-(2,4-Dihydroxyphenyl)-3,5,7-trihydroxy-4H-1benzopyran-4-one 2 ', 3, 4 ', 5,7-pentahydroxyflavone 結構式[33]. HO HO. OH. O. OH OH. O. 分子式及分子量[33] : C15H10O7,M.W. 302.23。 物理及化學性質[33] :於 285-290℃會分解。UV λmax(alc) : 258,375 nm。1 克溶於 4 升 20℃水中,1.06 升沸水中。可溶於酒精,微溶於 乙醚,醋酸;於鹼性溶液下呈深黃色,暴露於空氣中轉變成棕色。 4.
(5) 第二節. 桑色素之藥理作用. 1. 預防粥狀動脈硬化. [11]. LDL 被氧化是動脈硬化的危險因子,桑色素能保護 LDL 不被 氧化而能預防粥狀動脈硬化,因此可降低心血管疾病。於最近的研究 發現,桑色素比維他命 C、trolox 及 mannitol 更能保護人類紅血球細 胞、心室肌細胞、靜脈內皮細胞等不被過氧化。. 2. 抗腫瘤作用[12] 體外試驗顯示,對人類許多部位的癌細胞,如: 結腸癌、乳房 癌、結直腸癌及膀胱癌,桑色素可抑制細胞突變,防止原致癌基因 誘導形成腫瘤。. 3. 促進內皮細胞合成 prostacyclin [13] 桑色素能促進血管之內皮細胞合成 prostacyclin,prostacyclin (PGI 2)是冠狀血管之花生四烯酸的主要代謝產物,有抑制血小板凝 集和促進血管擴張的作用,此二活性皆可防止心肌缺血。. 5.
(6) 4. 活化 P-glycoprotein 的作用[29] 桑色素對 HCT-15 colon cells 有活化 P-gp 約 30 % 的作用。. 5. 抑制 xanthine oxidase 形成[6] Xanthine oxidase 存在於許多器官的內皮細胞,當這些器官缺血 時,就會藉由此. 產生自由基,而桑色素可抑制 xanthine oxidase 的. 形成,進而抑制自由基產生。. 6. 抗氧化作用[32] 在大白鼠肝臟微粒體(liver microsomes)試驗中,桑色素能捕捉鐵 離子來抑制自由基形成,保護局部缺血的肝細胞。. 7. 抑制 phosphatidylinositolphosphate kinase 活性[12] 在 大 白 鼠 體 內 與 體 外 腦 部 試 驗 中 , phosphatidylinositol-4,5-bisphosphate (PIP2)負責訊號傳導 (如生長因 子 , 荷 爾 蒙 及 神 經 傳 遞 物 質 ) 與 細 胞 形 成 。 PIP2 必 須 藉 由 phosphatidylinositolphosphate kinase 之催化,morin 會抑制此 而降低 PIP2,調節訊號傳導與細胞形成等作用。. 6.
(7) 第三節 環孢靈特性. 環孢靈(Cyclosporin A)為含有 11 個胺基酸之環型多胜. ,為. 分離自黴菌 Trichoderma polyporum 及 Cylindrocarpon ilucidivum 之代謝產物 [36]. [34]. ,亦可經由合成方式獲得. [35]. 。是一強效之免疫抑制劑. ,對 T 淋巴球有選擇性與可逆性的抑制作用,亦可抑制淋巴激素 [37,38]. (lymphokine)之產生及釋放,包括 interleukin 2. ;但不抑制造血功. 能,且對吞噬細胞功能無影響。Cyclosporin 能預防動物之心臟、腎臟、 骨髓、肝臟及肺臟等同種異體移植後之排斥及有效改善早期及長期存 活率。可單獨使用或與其他的免疫抑制劑併用,作為預防及治療異體 移植的排斥反應。 口服劑量為 5-18 mg/kg/day,以 bid 方式服用,液劑可以巧克力 或果汁混合服用,cyclosporin 吸收慢,且不穩定,個體差異大,平均 生體可用率為 30 %,口服投藥後 2-6 小時達最高血中濃度,吸收率 會隨服藥療程而增加,cyclosporin 為高脂溶性,其吸收須仰賴膽鹽的 存在,膽鹽可提高其溶解度及幫助穿過腸胃黏膜或增加藥物停留在吸 收部位的時間。Cyclosporin 的生體可用率隨著移植時間而改變,所 以病人器官移植後需要以低劑量維持可接受的濃度數星期。 Cyclosporin 為二室體分佈,具有高蛋白結合性,在血液中約有. 7.
(8) 58 %與紅血球結合,而在血漿中約有 85-90 %與脂蛋白結合,主要 分佈於肝臟、胰臟、脾臟、肺臟、脂肪及腎臟,首渡代謝與 CYP3A4 [39,40]. 及 P-glycoprotein 有關. ,膽汁分泌是其主要排泄途徑。. Cyclosporin 之副作用通常和劑量有關,降低劑量即可減少副作 用。在器官移植病人最常見的副作用有多毛症、顫抖、腎功能減弱; 在心臟移植患者常見的副作用為高血壓、齒齦肥厚、胃腸障礙 (厭 食、噁心、嘔吐、腹瀉)。 與 cyclosporin 產生交互作用的原因,包括對 CYP 3A4 的誘導或 抑制作用、影響未結合態的比率及對 P-gp 的誘導或抑制作用。臨床 上與 cyclosporin 產生嚴重交互作用的藥物如下所列: 1.. Antiepileptic drugs Phenytoin, phenobarbital,. carbamazepine 因誘導 CYP3A4. [41,42]. 增加 cyclosporin 代謝. ,而降低 cyclosporin 之生體可用率,臨床上. 可採用 valproic acid 來取代。. 2. Rifampicin or INH Rifampicin or INH 增加藥物代謝,而使血液中 cyclosporin 的濃 度下降,引起同種異體移植排斥。近年來有報告指出,rifampicin 因 [43]. 活化刺激 P-gp,而造成 cyclosporin 的血中濃度下降. 8. 。.
(9) 3. Octreotide Octreotide 降低 cyclosporin 吸收,為了達到血中濃度必須增加 劑量並且密切監測 cyclosporin 濃度或改用靜脈注射的方式給藥。. 4. Azole antifungal agents Ketoconazole,fluconazole,itraconazole 抑制肝臟 CYP 3A4 對 cyclosporin 代謝,導致 cyclosporin 在體內蓄積,而造成腎毒性及肝 毒 性 。 最 近 有 報 導 指 出 , ketoconazole 會 抑 制 P-gp 而 造 成 血 中 [44,45]. cyclosporin 濃度增加. ,所以併服此類藥物時,必須降低 cyclosporin. 劑量。. 5. Macrolide antibiotics Erythromycin,josamycin 會抑制肝臟及腸道 CYP 3A4,其中有報 告發現,erythromycin 對 P-gp 亦 有 抑 制 作 用 , 所 以 會 提 高 血 中 [25]. cyclosporin 之濃度. 。. 6. Corticosteroids 骨髓移植的病人併服 cyclosporin 及高劑量的 corticosteroids 會使 [46,47]. 體液滯留及高血壓與抽搐的發生率提高. 9. 。.
(10) 第四節 P-Glycoprotein 特性. P-Glycoprotein 是由 1280 個胺基酸組成之糖蛋白,在人類 [48]. 是由 mdr1 基因製造 ,在囓齒類動物是由 mdr1 和 mdr3 基因製 [49]. 造 ,對某些藥物而言是影響口服吸收的決定步驟。這是一個需 要 ATP 能量的幫浦,存在各種人類正常組織,高濃度存在腎上 腺和腎臟,中濃度存在肺臟、肝臟、空腸和結腸,而前列腺、皮 [50]. 膚、脾臟、心臟和骨骼肌含量較低. 。. 口服給藥的藥物通過腸管的各部份,包括口腔、食道及胃 腸道。藥物吸收最重要的部位是小腸,存在小腸上皮細胞的 P-gp 能不斷地將藥物由腸細胞送回腸腔,阻止藥物在腸細胞內蓄積, 導致細胞產生抗藥性(resistance),化療藥物如 Vinca alkaloids, anthracyclines , actinomycin D , daunorubicin , doxorubicin , [51]. etoposide, epipodophyllotoxins,taxanes…等. 之藥效,因為抗. 藥 性 而 降 低 。 P-gp 的 抑 制 劑 包 括 cyclosporin , digoxin , erythromycin,一些β-blocker 和抗生素等。 最近研究指出, P-gp 與 CYP3A4 的受質有很高的重疊性, 在消化道及腸細胞中,它們存在於同一位置,對於一些外源物, [52,53]. 它們有同時被誘導的現象. 。. 10.
(11) 第三章. 實驗之部. 第一節 實驗材料及儀器. 一 、實驗試藥 桑色素 (Morin, 95%). Sigma Chemical Co.(U.S.A.). Tetraglycol (Glycofurol). Sigma Chemical Co. (U.S.A.). β-Glucuronidase/Sulfatase. Sigma Chemical Co. (U.S.A.). 無水醋酸鈉. Kohusan Chemical Works, Ltd. (Japan). 醋酸 ( 99% ). Sigma Chemical Co. (U.S.A.). 氫氧化鈉. Riedel-deHaen AG (Germany). L(+)-Ascorbic Acid. RdH Laborchemikalien GmbH & Co. KG (Germany). 磷酸二氫鉀. Merck (Germany). 乙. ( LC Grade ). Merck (Germany). 甲醇 ( LC Grade ). Merck (Germany). 乙酸乙酯 ( LC Grade ). Mallinckrodt Baker, Inc. (U.S.A.). 磷酸 ( ortho-Phosphoric Acid, 85% ). Riedel-deHaen AG (Germany). Ethyl paraben (99%). Aldrich (Milwaukee, WI, 11.
(12) U.S.A.) 藥用酒精. 臺灣菸酒公賣局. Sandimmun ( Cyclosporin, 100 mg/ml ). Sandoz Pharma Ltd.. 橄欖油. 義大利歐利菲秀公司. 環孢靈試劑組. Abbott park, IL, U.S.A.. ( Cyclosporin Monoclonal Whole Blood Reagent Pack ) Medium 199. Sigma Chemical Co. (U.S.A.). Rhodamine 123 (95%). Sigma Chemical Co. (U.S.A.). Sodium bicarbonate. Shimakyu’s pure Co. (Japan). 12.
(13) 二、儀器設備 1. 酸鹼測定儀. Microprocessor pH-mV meter. 2. 高速離心機. Denver Instrument (Force –14). 3. 渦旋振盪器. Scientific Industries. 4. 超音波振盪器. Branson 5200. 5. 控溫往復式振盪水槽. Shaker ZC4000. 6. 吹氮氣濃縮裝置. OA-SYSEVAP-112. 7. 混合氣體 (95% O2, 5%CO2). 源吉行有限公司. 8. 電子分析天平. Mettler AJ100. 9. 微量移液管. Eppendorf. 10. 水壓抽氣機. Aspirator. 11. TDX Analyzer. Abbott, U.S.A.. AS-1. 12. 血清塞. 弘光企業有限公司. 13. 試管 ( 12×75 mm ). Kimble. 14. 鋁箔紙. Diamond. 15. 過濾膜 ( 0.45μm, 13 mm ). Alltech Associates Inc.. 16. 螢光光譜儀. Perkin Elmer (U.S.A.). 17. 高效液相層析儀(HPLC)包括: (1) 幫浦. Shimadzu LC-6AD (Japan). 13.
(14) (2) 層析管. Cosmosil, (150×4.6 mm), 18C Waters. (3) 管柱前濾膜. SS/Pk. (4) 紫外光偵測器. Shimadzu SPD-6A (Japan). (5) 系統控制儀. Shimadzu SCL-6B. (6) 積分儀. Shimadzu C-R6A. (7) 自動注射器. Perkin Elmer Series 200 Autosampler (U.S.A.). 16. 動物: (1) 紐西蘭白兔. 體重 : 2~3 kg, 雄性. (2) Sprague-Dawley 大白鼠. 體重 : 200~300 g. 17. 實驗器材: (1) 胃管. (0.9×L 70 mm, 1.5×L 120 mm). (2) 注射針及針筒. Terumo (Japan). 2.5 ml Syringe ( 0.55×25 mm ) 1.0 ml Syringe ( 0.45×13 mm ) (3) 滅菌過濾膜 ( 0.2 μm, 13 mm ) (4) 真空採血管. Alltech Associates Inc. Becton Dickinson & Company. 14.
(15) 二、 溶液製備. 1. Buffer solution ( pH 5.0 ) 取 0.1N 醋酸鈉溶液 a 67.8 ml,加入 0.1N 醋酸 b 至 100.0 ml, 再加 1N 氫氧化鈉調至 pH = 5.0 ± 0.1。 a. 稱取 0.8204 g 無水醋酸鈉,加水溶解並定容至 100.0 ml。. b. 量取醋酸 (d = 1.049) 0.572 ml,加水定容至 100.0 ml。. 2. β-Glucuronidase/Sulfatase 溶液 取β-glucuronidase/sulfatase (110350, 4194 units/ml) 50.0μl, 加 pH 5.0 buffer 定容至 50.0 ml,貯存在-30 ℃備用。. 3. 維生素 C 溶液 稱取維生素 C 0.60 g,加水至 2.0 ml 即得 300.0 mg/ml 之維 生素 C 溶液,使用前新鮮製備。. 4. 桑色素口服或靜脈注射溶液 精稱 morin 3.5 g,以 tetraglycol 定容至 50.0 ml, 即得 70.0 mg/ml 之桑色素溶液,使用前新鮮製備。. 15.
(16) 5. 內部標準品溶液 精稱 ethyl paraben 10.0 mg,以乙酸乙酯溶解並定容至 10.0 ml,即得 1.0 mg/ml 之貯存溶液,再以乙酸乙酯稀釋成各種所需 濃度之標準溶液。. 6. 桑色素標準溶液 精稱 morin 20.0 mg,加入甲醇定容至 10.0 ml,即得 2.0 mg/ml 之桑色素貯存溶液,再以甲醇稀釋成各種所需濃度之標準溶液。. 7. 環孢靈溶液 精取 400.0 μl 生體睦 (含 cyclosporin 100.0 mg/ml),加入橄 欖油定容至 10.0 ml, 即得 4.0 mg/ml 之環孢靈溶液。. 8. Medium 199 溶液 精取 9.55 克 medium 199,加入 2.2 克碳酸氫鈉,再加水溶 解並定容成 1000.0 ml,調整 pH 至 7.4 ± 0.1,貯存在 2~8 ℃,於 一星期內使用。. 9.. Rhodamin 123 溶液 精稱 10.0 mg Rhodamin 123,加水定容成 10.0 ml,即得 1.0. 16.
(17) mg/ml 標準溶液,再以 medium 199 溶液稀釋成 20.0 µg/ml。. 17.
(18) 第二節. 實驗方法. 一、桑色素在兔體內之藥物動力學. A. 動物. 雄性紐西蘭白兔六隻,體重介於 2~3 kg,兔子於實驗前先禁 食 24 小時,稱量體重。. B. 給藥及採血. ( 1 ) 靜脈瞬時注射給藥. 注射用之桑色素溶液經由 0.2 μm 滅菌濾膜除去熱原,靜脈投予 兩種劑量 (10 mg/kg = 33.1 µmol/kg,20 mg/kg = 66.2 µmol/kg)。由左 耳靜脈給藥,右耳靜脈採血。 採血時間點為給藥後 5,10,15,30,45,60,90,120,180, 240 分鐘,每次採血量為 1.5 ml,將血液置於棕色離心管。將檢品離 心 (15,000 rpm) 15 分鐘,取上層血清,並保存在-30 ℃,俟後分析。. 18.
(19) ( 2 ) 口服給藥. 經 由 胃 管 投 予 桑 色 素 溶 液 兩 種 劑 量 (165.4 µmol/kg , 330.2 µmol/kg),採血時間點為給藥後 5,10,15,30,60,90, 120,180,240,300 分鐘,從右耳靜脈採血,每次採血量為 1.5 ml, 之後將檢品離心 (15,000 rpm) 15 分鐘,取上層血清,並保存在-30 ℃,俟後分析。. C. 檢品之前處理及安定性. (一) 血清中桑色素於-30 ℃下之安定性. 取空白血清,加入桑色素標準溶液,使其濃度為 20.0μg/ml, 再分裝至棕色離心管,每管 200.0μl,分成 7 組,每組 3 管,將 第一組先加入 20.0 µl 維生素 C (300.0 mg/ml) ,及 150.0 μl 乙酸 乙酯 (含 10.0 μg/ml ethyl paraben 為內標準) 萃取,以氮氣吹乾 後,貯於-30 ℃。其餘的則先貯於-30 ℃,分別於 1,2,3,4, 5,15 及 24 天之後取出,如第一組經乙酸乙酯萃取,以氮氣吹乾 後,再貯於-30 ℃。全部檢品俟後一起進行 HPLC 定量。 19.
(20) (二) 維生素 C 對血清中桑色素於 37 ℃下安定性的影響. 取兔子 i.v.注射桑色素後 10 分鐘之血清檢品,分裝至外覆鋁 箔紙之試管,每管 200.0 μl,加入 100.0 μl glucuronidase/sulfatase 溶液 (β-glucuronidase 110.35 units/ml, sulfatase 4.194 unit/ml in pH 5.0 buffer) ,分成三組,每組三管,第一組加入 20.0 µl 維生素 C 溶液 (300.0 mg/ml),第二組加入 20.0 µl 維生素 C 溶液 (100.0 mg/ml),第三組則未加入維生素 C,並蓋上血清塞,以注射針筒抽 去管內之空氣。 與 反應 4 小時之後,再以 300.0μl 乙酸乙酯 (含內標準 ethyl paraben 10.0 μg/ml) 於渦旋振盪器上混合 20 秒,倒入棕色 離心管,以 15,000 rpm 離心 15 分鐘之後,取出乙酸乙酯層,以 氮氣吹乾,以 100.0 μl 乙 溶解,供 HPLC 定量。. (三)血清中桑色素結合態代謝物於 37℃下 解所需時間之測試. 取兔子 i.v.注射桑色素後 10 分鐘血清檢品,分裝至外覆鋁 箔紙之試管,每管 250.0 µl,加入 125.0 μl glucuronidase/sulfatase 溶液 (β-glucuronidase 110.35 units/ml, sulfatase 4.194 unit/ml in. 20.
(21) pH 5.0 buffer) ,及 20.0 μl 維生素 C 溶液 ( 300.0 mg/ml ) ,蓋 上血清塞,置於渦旋振盪器上混合 20 秒,用針筒將試管內之空 氣抽出,之後置於 37 ℃之往復式振盪水槽 (轉速 100 rpm),反 應 2,4,8,10 小時後,取出檢品,每組三管,各加 385.0 μl 乙酸乙酯 (含內標準 ethyl paraben 10.0 μg/ml),於渦旋振盪器上 混合 20 秒,再將檢品倒入棕色離心管,以 15,000 rpm 離心 15 分鐘之後,取出乙酸乙酯層,以氮氣吹乾,以 125.0 µl 乙. 溶解,. 供 HPLC 定量。. (四) 血清檢品前處理方法之比較. 1. 乙酸乙酯萃取法 取空白血清 900.0 μl,加入各種濃度的桑色素標準溶液 100.0 μl 使成濃度為 100.0,50.0,25.0,12.5,6.25,3.13,1.56 μg/ml 之血清標準溶液,每個濃度各取 200.0 µl 置於棕色離心 管,加入 100.0 μl 醋酸鈉緩衝液 (pH 5.0),及 20.0 μl 維生素 C 溶液 (300.0 mg/ml),於渦旋振盪器上混合 20 秒,加 300.0 μl 之乙酸乙酯(含內標準 ethyl paraben 2.0 μg/ml),15,000. rpm 離. 心 15 分鐘之後,取出上層,以氮氣吹乾後,以 100.0 μl 乙 解,供 HPLC 定量。 21. 溶.
(22) 2. 甲醇或乙 去蛋白法 取桑色素溶液血清標準溶液,每個濃度各取 200.0 µl 置於棕 色離心管,加入 100.0 μl 醋酸鈉緩衝液 (pH 5.0) ,及 20.0 μ l 維生素 C 溶液 ( 300.0 mg/ml ),於渦旋振盪器上混合 20 秒, 加入 800.0 μl 之甲醇或乙 g/ml) ,以 15,000. (含內標準 ethyl paraben 1.0 μ. rpm 離心 15 分鐘之後,取出上層,以氮氣. 吹乾後,以 100.0 μl 乙. 溶解,供 HPLC 定量。. D. 血清中自由態桑色素與總桑色素(自由態加結合態)之定量分析. (一) HPLC 分析條件. 層析管( Column ). COSMOSIL packed column, Waters (150×4.6 mm). 管柱前濾膜( Prefilter ). SS/PK. 檢測波長 : 250 nm 移動相比例 : Acetonitrile -0.2% ortho-phosphoric acid ( 28 : 72, v/v ),pH = 2.0 內標準:ethyl paraben 流速 : 1 ml/min. 22.
(23) (二) 血清檢品之前處理. a. 總桑色素之定量. 取血清檢品 200.0 μl 置於外包鋁箔紙之試管,加 100.0 μl glucuronidase/sulfatase 溶液 (β-glucuronidase 110.35 units/ml, sulfatase 4.194 units/ml in pH 5.0 buffer) ,及 20.0 μl 維生素 C 溶液 (300.0 mg/ml) ,蓋上血清塞,置於渦旋振盪器上混合 20 秒,用針筒將試管內之空氣抽出。置於 37 ℃之往復式振盪水槽 (轉速 100 rpm) ,反應 4 小時後,取出檢品,加入 300.0 μl 乙 酸乙酯 (含內標準) ,於渦旋振盪器上混合 20 秒,再將檢品倒入 棕色離心管,以 15,000 rpm 離心 15 分鐘之後,取出乙酸乙酯層, 以氮氣吹乾,貯於-30 ℃,待分析時,以 100.0 µl 乙. 溶解,供. HPLC 定量。. b. 自由態桑色素之定量. 取血清檢品 200.0 μl 於棕色離心管,加入 pH 5.0 之緩 衝液 100.0 μl,及 20.0 μl 維生素 C 溶液 (300.0 mg/ml) ,置於. 23.
(24) 渦旋振盪器上混合 20 秒,加入 300.0 μl 乙酸乙酯 (含內標準), 於渦旋振盪器上混合 20 秒,以 15,000 rpm 離心 15 分鐘之後,取 出乙酸乙酯層,以氮氣吹乾後,貯於-30 ℃,待分析時,以 100.0 μl 乙 溶解,供 HPLC 定量。. (三) 檢量線之繪製. 精確稱取 morin,以甲醇溶解並稀釋定容,製備 3.9, 7.8,15.6, 31.3,62.5,125.0,250.0,500.0,1000.0,2000.0 μg/ml 等濃度 之標準溶液,各取 100.0 μl morin 標準溶液,加入 900.0 μl 空白 血清,製備血清標準溶液,濃度分別為 0.39, 0.78, 1.56 , 3.13, 6.25, 12.5, 25.0, 50.0, 100.0, 200.0 μg/ml。 每一濃度之血清標準溶液各取 200.0 μl,加 100.0 μl 醋酸鈉 緩衝溶液 (pH 5.0) 及 20.0 μl 維生素 C 溶液 (300.0 mg/ml),再以 含內標準 ethyl paraben 10.0 μg/ml 或 2.0μg/ml 之乙酸乙酯 300.0 μl 萃取之,於渦旋振盪器上混合 20 秒,以 15,000 rpm 離心 15 分 鐘,取乙酸乙酯層,以氮氣吹乾,加 100.0 μl 乙. 溶解,供 HPLC. 分析。 內標準 ethyl paraben 靜脈注射給藥濃度為 10.0 μg/ml,口服 給藥濃度為 2.0 μg/ml。 24.
(25) (四) 分析方法之確效. ( 1 ) 精密度. 將各種濃度的桑色素血清標準溶液,分別於同日內早、午、 晚及連續三日之異日間各作一次 HPLC 分析,並代入檢量線求 得每次分析之濃度。以三次同日內及三次異日間分析值分別求其 平均值 (mean)、標準偏差 (standard deviation,S.D.) 及變異係 數 (coefficient of variation,C.V.)。. ( 2 ) 靈敏度. 將桑色素血清標準溶液濃度一再稀釋,直到 HPLC 層析圖 顯示其波峰高度為雜訊之三倍的濃度為其偵測極限。. ( 3 ) 回收率. 將 morin 溶於甲醇,製備 500.0, 125.0 及 31.2 μg/ml 三種濃 度,分別加入空白血清及水中成為 50, 12.5, 3.1 μg/ml,每種濃 度各三管。所得血清中之檢出濃度除以相對應濃度於水中之檢出 濃度即為相對於水的回收率。 25.
(26) D. 數據處理. 二種投藥方法所得之血清檢品經 HPLC 定量後,利用電腦程 式 WINNONLIN,靜脈給藥低劑量套入一室模式、高劑量套入二 室模式;口服給藥則以非室體模式 (noncompartment model) ,求 其動力學參數。. 26.
(27) 二. 桑色素於大白鼠體內對環孢靈吸收之影響. A. 動物及給藥. 雄性 Spraque-Dawley 老鼠 7 隻,體重介於 200~300 g,出生 8~12 週,實驗前禁食 24 小時,並先剃除胸前之毛,以利心臟採血,再於 乙醚麻醉的狀態下,以胃管單獨給予環孢靈溶液 10.0 mg/kg (4.0 mg/ml in olive oil) 或併服桑色素溶液 50.0 mg/kg. (20.0 mg/ml in. tetraglycol) 。 實驗設計採隨機交叉的方式將大白鼠分成二組,一組給予環孢 靈溶液與桑色素溶液,另一組給予環孢靈溶液與等體積的 tetraglycol,待一星期 wash-out 之後,二組互換。. B. 採血及檢品處理. 採血時間於給藥後 1,3,5,8,12,26,36 小時,以含 EDTA 之真空管採血管採血,每次採血量為 0.3 ml,並以手輕輕轉動,使管 內的血液與 EDTA 混合均勻,再貯存於 4 ℃冷藏,待要分析時再取 出(血液檢品貯存於 4 ℃之期限不可超過一星期) 。. 27.
(28) C. 血液中 cyclosporin 之定量 血 液 檢 品 利 用 TDx Analyzer 以 FPIA (Fluorescence Polarization Immuno Assay) 方法定量血液中 cyclosporin 的濃度。. D. 數據處理及統計方法 利 用 電 腦 程 式. WINNONLIN , 採 非 室 體 模 式. (noncompartment model)計算動力學參數,並使用 paired Student's t-test 分析兩種給藥方法是否具統計上的差異。. 28.
(29) 三. 黃酮. 元對 P-gp 活性之影響. A. 體外翻轉腸管實驗系統. 雌性 Spraque-Dawley 老鼠,體重介於 150~250 g,出生 8~12 週, 實驗前先禁食 1~2 天,以清除胃腸道中殘餘食物,並於乙醚麻醉的狀 態下,剖開腹腔,迴腸是老鼠腸道富含 P-gp 最多的部位,空腸次之, 所以取出離胃 5.0 cm 以下的空腸及離盲腸 5.0 cm 以上的迴腸各 30 cm,將取出的空腸及迴腸用冰的生理食鹽水灌流清洗內部殘留物。 再將腸子外翻,讓黏膜層在外,漿膜層在內,之後先於腸一端以線綁 緊,再於腸子另一端插入針頭,並於 25.0 cm 處以線綁緊。 將大白鼠分成五組,第一組為空白組,將腸子置於 50.0 ml 之 medium 199 溶液中,第二組置於裝有 50.0 ml 含 200.0 µM 桑色素之 medium 199 溶液中,第三組置於裝有 50.0 ml 含 400.0 µM 桑色素之 medium 199 溶液中,第四組置於裝有 50.0 ml 含 200.0 µM 槲皮素之 medium 199 溶液中,第五組置於裝有 50.0 ml 含 200.0 µM 柚皮. 元. 之 medium 199 溶液中。這些溶液皆含 0.4 % DMSO 為助溶劑;置於 37 ℃之往復式振盪水槽 (轉速為 50 rpm) 並持續通入混合氣體 (含 95 % 02 及 5 % CO2) 來維持腸子存活。20 分鐘後,在裝有針頭的一 29.
(30) 端注入 rhodamine 123 溶液 3.0 ml (20.0 µg/ml) 。. B. 採樣及檢品處理. 檢品採樣係取腸子外之燒杯內容物,每次採樣量為 0.5 ml,採 樣時間為注入 rhodamine 123 溶液之後 15,30,45,60,75 及 90 分鐘,置於玻璃管內,蓋上蓋子,俟後分析。. C. Rhodamone 123 檢量線之繪製 取 rhodamine 123 (1.0 mg/ml) 標準溶液,以 medium 199 溶液 稀釋為 2.000,1.000,0.500,0.250,0.125,0.100,0.050,0.025 µg/ml 等濃度,經螢光光譜儀分析,設定 485 nm 為 excitation 波長、546 nm 為 emission 波長,以直線迴歸法繪製檢量線。. D. 檢品中 rhodamone 123 之定量 待分析的檢品先以 medium 199 溶液稀釋 8 倍,根據先前 繪製之檢量線以內插法定量。. E. 數據處理及統計方法 利用電腦軟體 SPSS,以 ANOVA 分析此五組不同藥物間. 30.
(31) rhodamine 123 的排出量是否達到統計上的差異。. 31.
(32) 第四章. 結果與討論. 一、桑色素於兔體內之藥物動力學. 本 研 究 利 用 HPLC 方 法 , 定 量 血 清 中 之 morin 及 morin glucuronides /sulfates。以乙. :0.2 % 磷酸水溶液 (28:72, v/v) 混合. 液為移動相,ethyl paraben 為內標,流速為 1.0 ml/min,層析流程可 在 13 分鐘內完成,分析簡易而快速。血清中桑色素層析圖如 Fig. 1-1 所示。血清檢品之前處理是利用分配原理,以含內標的乙酸乙酯萃取 血清中之 morin 及由 morin glucuronides/sulfates 方法與以甲醇或乙. 解出之 morin,此. 去蛋白的方法比較六種濃度的血清標準品經三. 種方法之前處理過程,結果顯示所得到的 morin 每種濃度的檢品,均 以乙酸乙酯萃取法波峰面積較大。除此之外,此方法處理檢品所花的 時間亦較短。 本研究以口服及靜脈注射兩種途徑投予桑色素,血清中桑色素 的濃度測定,則分別利用兩條檢量線定量。口服桑色素的濃度範圍為 1.56 ~ 25.00μg/ml,檢量線方程式為 y = 0.128χ- 0.723 ( r = 0.997); 靜脈注射桑色素的濃度範圍為 1.56 ~ 200.00μg/ml,檢量線方程式為 y = 0.023χ- 0.115 ( r = 0.996 ),兩範圍之濃度與 peak area ratios 間皆 32.
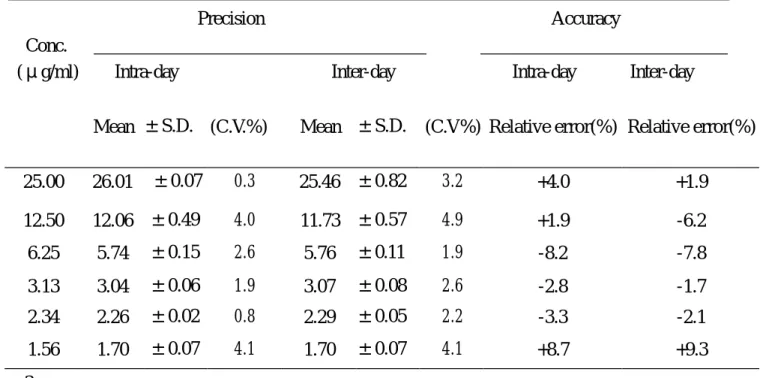
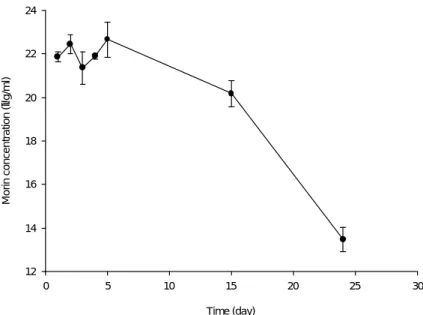
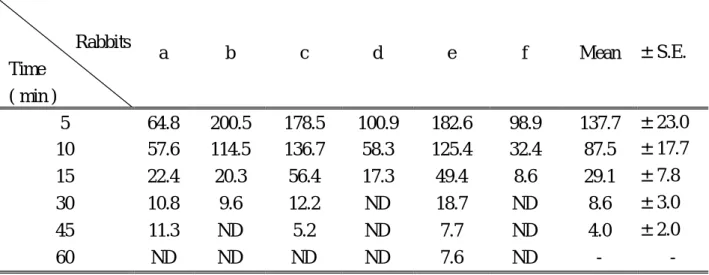
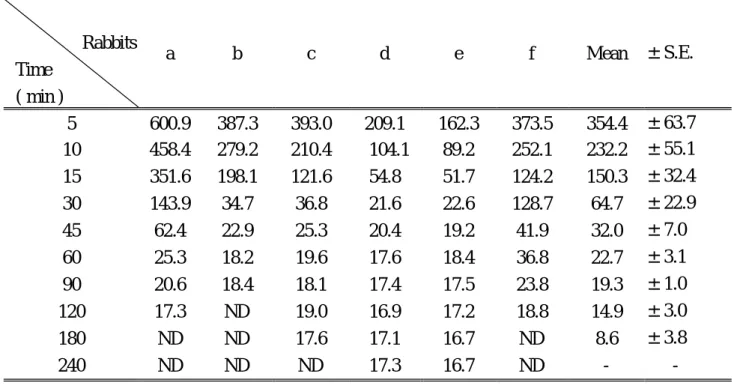
(33) 有良好的線性關係。分析系統之精密度佳而準確度也在 20 % 以內, 如 Table1-1 所示。相對於水的回收率為 57.9 % ~ 67.6 %,尚可接受, 如 Table 1-2 所示。LOQ 為 1.56 μg/ml,LOD 為 0.39 µg/ml。. 桑色素具多酚之結構,易被氧化,為較不安定的黃酮類化合物。 經比較不加維生素 C、添加 100.0 mg/ml 維生素 C 與添加 300.0 mg/ml 維生素 C 三種條件,對它在 37℃. 解情況下安定度的影響,發現添. 加 300.0 mg/ml 維生素 C 者對血清中桑色素的保護作用最佳,與不加 維生素 C 者及加低濃度者 (100.0 mg/ml) 相較,其差異具統計學上的 意義。根據安定性試驗發現,檢品最好在五天內分析完成,因為五天 之後血清中的桑色素有明顯的降解情形,如 Fig. 1- 2 所示。 解所需的時間之決定,係以兔子靜脈注射桑色素之血清檢品, 加入β-glucuronidase/sulfatase 及維生素 C (300.0 mg/ml) 於 37℃水浴 進 行 反 應 , 結 果 顯 示 反 應 4 小 時 , 酵 素 已 能 完 全 水 解 morin glucuronides/sulfates,如 Fig. 1-3 所示,因此本實驗所有血清檢品之 解時間均採 4 小時。 兔 子 靜 脈 注 射 (10.0 mg/kg, 20.0 mg/kg) 與 口 服 投 予 (50.0 mg/kg,100.0 mg/kg) 桑色素後,各隻兔子血清中 morin 及 morin conjugates 之濃度如 Table1-3~1-14 所示。血清中 morin 及 morin conjugates 之 平 均 濃 度 經 時 變 化 圖 如 Fig. 1-4~1-6 所 示 , 利 用 33.
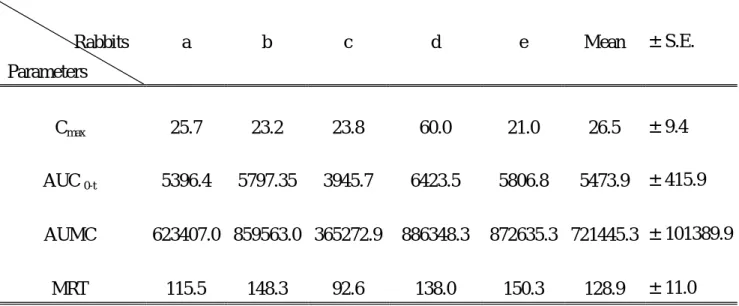
(34) WINNONLIN 求出 morin 之藥物動力學參數,如 Table1-11~1-18 所示。 兔子靜脈注射桑色素 10.0 mg/kg 與 20.0 mg/kg 兩種劑量後,血藥 濃度分別套入一室及二室型模式,所得之平均血藥面積分別為 2144.3 ±321.6 與 19266.5 ±3854.9 nmol· min· ml-1,兩者之間的差異遠超過 兩倍,而達九倍之多;排除半衰期分別為 7.9 ±2.0 與 28.6 ±10.5 min;分佈體積分別為 0.15 ±0.04 與 0.94 ±0.4 L;全身清除率分別 為 0.013 ±0.002 與 0.003 ±0.0005;平均滯留時間為 11.4 ± 2.9 與 512.7 ±275.1 min。兩種劑量間上述參數的差異經 unpaired Student’s t-test 分析,顯示高劑量的排除半衰期、分佈體積與平均滯留時間皆 明顯高於低劑量,而全身清除率遠低於低劑量,皆達統計學上的顯著 意義 (p<0.05)。靜脈注射的結果顯示,個體差異很大,並且 morin 呈 現非線性動力學行為。兩劑量的結合態代謝物分別為 41 %及 23 % (p<0.05),表示在高劑量情況下代謝過程會被飽和,因此循環於血中 的結合態代謝物比率顯著減少。 兔子口服投予桑色素 50.0 mg/kg 時,只偵測到少數的檢品含有原 型桑色素,因此無法計算其原型桑色素之動力學參數。口服桑色素 100.0 mg/kg 後,經非室性模式計算,其平均血藥面積為 5473.9 ± 415.9 nmol· min· ml-1,平均血峰濃度為 26.5 ±9.4 nmol/ml-1,平均滯留 時間為 128.9 ±11.0 min,兩劑量的結合態代謝物分別為 57 %與 13 %. 34.
(35) (p<0.05)。血峰濃度、AUC 和劑量不呈一定的比例,顯示高劑量下有 代 謝 飽 和 的 現 象 發 生 , 藥 物 代 謝 所 須 之 glucuronyl transferase / sulfotransferase 明顯不足供高劑量 morin 之代謝,而使得自由態的 morin 反而較結合態為多,排除速率變慢,因此口服給藥之桑色素體 內動態亦顯示非線性模式,與靜脈注射之結果一致。. 35.
(36) (a). (b). (c). Retention time (min). Fig. 1-1 Chromatogram of morin (M) and ethyl paraben as an internal standard (IS) in rabbit serum ; (a) blank serum, (b) after iv administration (20.0 mg/kg), M: 49.6 µg/ml, IS: 10.0 µg/ml (c) after oral administration (100.0 mg/kg), M: 18.1 µg/ml, IS: 2.0 µg/ml. 36.
(37) Table 1-1. Intra-day and inter-day analytical precision and accuracy of morin. Precision Conc. (μg/ml). Intra-day. Accuracy Inter-day. Mean ±S.D. (C.V.%). Mean ±S.D.. Intra-day. Inter-day. (C.V%) Relative error(%) Relative error(%). 25.00. 26.01. ±0.07. 0.3. 25.46 ±0.82. 3.2. +4.0. +1.9. 12.50. 12.06 ±0.49. 4.0. 11.73 ±0.57. 4.9. +1.9. -6.2. 6.25. 5.74. ±0.15. 2.6. 5.76. ±0.11. 1.9. -8.2. -7.8. 3.13. 3.04. ±0.06. 1.9. 3.07. ±0.08. 2.6. -2.8. -1.7. 2.34. 2.26. ±0.02. 0.8. 2.29. ±0.05. 2.2. -3.3. -2.1. 1.56. 1.70. ±0.07. 4.1. 1.70. ±0.07. 4.1. +8.7. +9.3. n=3. Table 1-2. Recovery (%) of morin from rabbit serum. Conc. (μg/ml). Mean (%). ±S.D.. 50.00 12.50 3.13. 57.88 54.69 67.64. ±0.06 ±0.06 ±0.14. n=3. 37.
(38) 24. Morin concentration (µg/ml). 22. 20. 18. 16. 14. 12 0. 5. 10. 15. 20. 25. 30. Time (day). Fig. 1-2 Stability of morin in serum at – 30 ℃. (n=3). 74. Morin concentration (µg/ml). 72. 70. 68. 66. 64. 62 0. 2. 4. 6. 8. 10. 12. Time (hr). Fig. 1-3 Morin concentrations in serum detected at various time points during Incubation with glucuronidase/sulfatase at 37 ℃. (n=3). 38.
(39) Table 1-3. Morin concentrations (nmol/ml) in serum of six rabbits after intravenous administration of morin (10.0 mg/kg=33.1μmol/kg).. Rabbits Time ( min ) 5 10 15 30 45 60. a. b. c. d. e. f. Mean. ±S.E.. 64.8 57.6 22.4 10.8 11.3 ND. 200.5 114.5 20.3 9.6 ND ND. 178.5 136.7 56.4 12.2 5.2 ND. 100.9 58.3 17.3 ND ND ND. 182.6 125.4 49.4 18.7 7.7 7.6. 98.9 32.4 8.6 ND ND ND. 137.7 87.5 29.1 8.6 4.0 -. ±23.0 ±17.7 ±7.8 ±3.0 ±2.0 -. ND : not detectable.. Table 1-4. Morin glucuronide/sulfate concentrations (nmol/ml) in serum of six rabbits after intravenous administration of morin (10.0 mg/kg).. Rabbits Time ( min ) 5 10 15 30 45 60 90. a. b. c. d. e. f. 119.1 88.7 66.0 34.5 19.8 10.9 10.8. 80.6 28.8 36.1 17.9 10.7 7.9 0. 102.0 72.4 32.6 22.7 13.8 8.1 0. 25.1 39.1 30.4 15.4 7.7 0 0. 51.0 19.2 24.6 1.4 3.3 1.5 0. 22.3 25.2 21.4 13.6 0 0 0. 39. Mean ±S.E.. 66.7 45.6 35.2 17.6 9.2 4.7 -. ±16.5 ±11.6 ±6.5 ±4.5 ±2.9 ±2.0 -.
(40) Table 1-5. Morin concentrations (nmol/ml) in serum of six rabbits after intravenous administration of morin (20.0 mg/kg=66.2μmol/kg).. Rabbits. a. b. c. d. e. f. Mean. ±S.E.. 600.9 458.4 351.6 143.9 62.4 25.3 20.6 17.3 ND ND. 387.3 279.2 198.1 34.7 22.9 18.2 18.4 ND ND ND. 393.0 210.4 121.6 36.8 25.3 19.6 18.1 19.0 17.6 ND. 209.1 104.1 54.8 21.6 20.4 17.6 17.4 16.9 17.1 17.3. 162.3 89.2 51.7 22.6 19.2 18.4 17.5 17.2 16.7 16.7. 373.5 252.1 124.2 128.7 41.9 36.8 23.8 18.8 ND ND. 354.4 232.2 150.3 64.7 32.0 22.7 19.3 14.9 8.6 -. ±63.7 ±55.1 ±32.4 ±22.9 ±7.0 ±3.1 ±1.0 ±3.0 ±3.8. Time ( min ) 5 10 15 30 45 60 90 120 180 240. -. ND : not detectable.. Table 1-6. Morin glucuronide/sulfate concentrations (nmol/ml) in serum of six rabbits after intravenous administration of morin (20.0 mg/kg).. Rabbits Time ( min ) 5 10 15 30 45 60 90 120 180 240. a. b. c. d. e. f. 32.5 127.1 136.5 165.5 125.5 40.9 38.7 14.3 22.1 18.5. 59.2 104.2 53.6 50.4 33.6 12.8 6.5 0 0 0. 172.2 120.3 114.8 46.7 20.5 7.7 6.3 0.7 0 0. 32.6 64.5 38.8 13.8 5.9 6.5 3.7 3.1 0.5 2.3. 137.0 57.3 63.4 30.0 6.8 9.1 2.9 0.8 0.2 0.17. 49.9 48.2 138.2 49.5 40.1 63.5 17.4 4.9 19.9 18.1. 40. Mean ±S.E.. 80.6 86.9 90.9 59.3 38.4 23.4 12.6 4.0 7.1 6.5. ±24. 2 ±14.0 ±18.0 ±22.0 ±18.3 ±9.6 ±5.7 ±2.2 ±4.4 ±3.7.
(41) Table 1-7. Morin concentrations (nmol/ml) in serum of six rabbits after oral administration of morin (50.0 mg/kg=165.4μmol/kg).. Rabbits Time ( min ) 5 10 15 30 60. a. b. c. d. e. f. ND 8.0 15.5 10.8 ND. ND ND ND ND ND. ND 17.3 6.1 ND ND. 8.3 9.1 11.7 8.8 7.2. ND ND ND ND ND. ND ND ND 16.0 ND. ND : not detectable.. Table 1-8. Morin glucuronide/sulfate concentrations (nmol/ml) in serum of six rabbits after oral administration of morin (50.0 mg/kg). Rabbits Time ( min ) 5 10 15 30 45 60 90 120. a. b. c. d. e. f. 0 2.3 22.1 8.3 0 0 0 0. 6.0 0 0 0 0 0 0 0. 7.9 4.4 16.3 7.6 0 0 0 0. 3.1 4.6 15.3 0.2 1.8 0 0 0. 0 0 0 0 0 0 0 0. 0 0 7.7 18.6 13.4 11.1 10.0 7.4. 41.
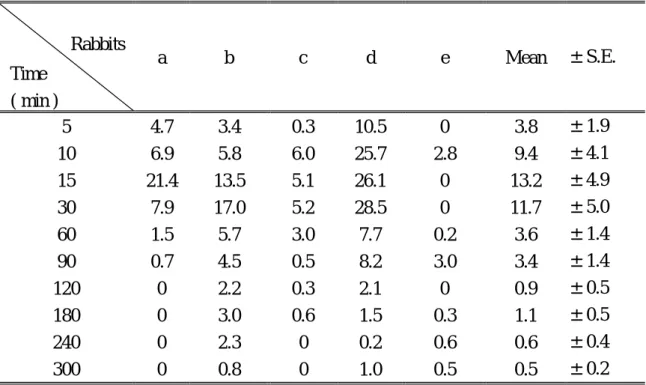
(42) Table 1-9. Morin concentrations (nmol/ml) in serum of five rabbits after oral administration of morin (100.0 mg/kg=330.9μmol/kg).. Rabbits Time ( min ) 5 10 15 30 60 90 120 180 240 300. a. b. c. d. e. Mean. ±S.E.. 21.3 24.4 26.0 24.4 24.9 25.2 22.6 20.9 19.6 ND. 20.1 19.9 23.2 20.9 20.2 19.3 18.9 19.1 19.0 18.9. 20.8 27.5 22.5 20.3 22.0 22.0 23.8 22.0 ND ND. 29.3 60.0 34.8 31.0 19.0 19.7 19.2 19.0 19.6 19.9. 19.3 18.9 21.0 19.3 19.6 19.6 20.3 19.2 19.2 19.2. 22.2 30.1 25.5 23.2 21.1 21.2 21.0 20.0 15.5 11.6. ±1.8 ±7.7 ±2.5 ±2.1 ±1.1 ±1.1 ±1.0 ±0.6 ±3.9 ±4.7. ND : not detectable.. Table 1-10. Morin glucuronide/sulfate concentrations (nmol/ml) in serum of five rabbits after oral administration of morin (100.0 mg/kg).. Rabbits Time ( min ) 5 10 15 30 60 90 120 180 240 300. a. b. c. d. e. Mean. ±S.E.. 4.7 6.9 21.4 7.9 1.5 0.7 0 0 0 0. 3.4 5.8 13.5 17.0 5.7 4.5 2.2 3.0 2.3 0.8. 0.3 6.0 5.1 5.2 3.0 0.5 0.3 0.6 0 0. 10.5 25.7 26.1 28.5 7.7 8.2 2.1 1.5 0.2 1.0. 0 2.8 0 0 0.2 3.0 0 0.3 0.6 0.5. 3.8 9.4 13.2 11.7 3.6 3.4 0.9 1.1 0.6 0.5. ±1.9. 42. ±4.1 ±4.9 ±5.0 ±1.4 ±1.4 ±0.5 ±0.5 ±0.4 ±0.2.
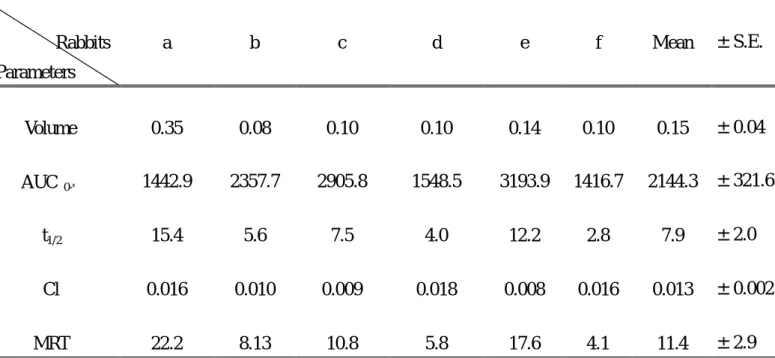
(43) Table 1-11. Individual pharmacokinetic parameters of morin after an intravenous dose of 10.0 mg/kg.. a. b. c. d. e. f. Mean. ±S.E.. 0.35. 0.08. 0.10. 0.10. 0.14. 0.10. 0.15. ±0.04. 1442.9. 2357.7. 2905.8. 1548.5. 3193.9. 1416.7. 2144.3. ±321.6. t1/2. 15.4. 5.6. 7.5. 4.0. 12.2. 2.8. 7.9. Cl. 0.016. 0.010. 0.009. 0.018. 0.008. 0.016. 0.013. ±0.002. MRT. 22.2. 8.13. 10.8. 5.8. 17.6. 4.1. 11.4. ±2.9. Rabbits Parameters Volume AUC. 0-∞. ±2.0. Table 1-12. Individual pharmacokinetic parameters of morin after an intravenous dose of 20.0mg/kg.. a. b. c. d. e. f. Mean. ±S.E.. Volume. 0.14. 0.24. 0.76. 2.16.. 2.17. 0.15. 0.94*. ±0.4. AUC 0-∞. 17721.7. 10656.3. 14991.4. 26013.4. t1/2. 14.4. 13.6. 14.3. 39.1. 76.9. 13.3. 28.6*. ±10.5. Cl. 0.002. 0.004. 0.003. 0.002. 0.001. 0.004. 0.003*. ±0.0005. MRT. 58.98. 57.88. 236.8. 1042.9. 1641.8. 37.9. 512.7*. ±275.1. Rabbits Parameters. *. p< 0.05.. 43. 34854.8 11361.5 19266.5 ±3854.9.
(44) Table 1-13. Individual pharmacokinetic parameters of morin after an oral dose of 50.0 mg/kg.. a. b. c. d. e. f. Mean. ±S.E.. Cmax. 15.5. 0. 17.28. 11.7. 0. 16.0. 10.1. ±3.3. AUC 0-t. 275.3. 0. 101.8. 508.7. 0. 199.9. 180.9. ±79.3. AUMC. 5140.5. 0. 1094.3. 14786.8. 0. 5996.3. 4502.9. ±2313.5. MRT. 18.7. 0. 10.8. 29.1. 0. 30.0. 14.8. Rabbits Parameters. ±5.5. Table 1-14. Individual pharmacokinetic parameters of morin after an oral dose of 100.0 mg/kg.. a. b. c. d. e. Mean. ±S.E.. Cmax. 25.7. 23.2. 23.8. 60.0. 21.0. 26.5. ±9.4. AUC 0-t. 5396.4. 5797.35. 3945.7. 6423.5. 5806.8. 5473.9. Rabbits Parameters. AUMC MRT. 623407.0 859563.0 365272.9 115.5. 148.3. 92.6. 44. 886348.3 138.0. ±415.9. 872635.3 721445.3 ±101389.9 150.3. 128.9. ±11.0.
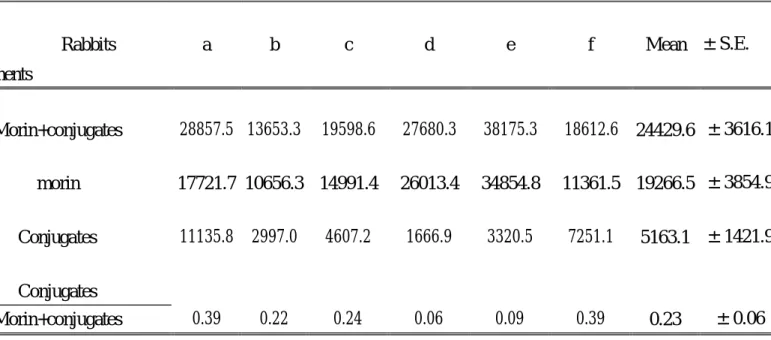
(45) Table 1-15. Comparison of AUC 0-∞ (nmol ⋅ min /ml) between morin and its conjugates after intravenous administration (10.0 mg/kg).. a. b. c. d. e. f. Mean ±S.E.. Morin+conjugates. 4762.2. 4316.8. 5072.6. 2461.8. 4211.3. 1970.2. 3799.1 ±520.3. morin. 1442.9. 2357.7. 2905.8. 1548.5. 3193.9. 1416.7. 2144.2 ±321.6. Conjugates. 3319.3. 1959.1. 2166.7. 913.3. 1017.4. 553.5. 1654.9 ±420.1. 0.70. 0.45. 0.43. 0.37. 0.24. 0.28. Rabbits Treatments. Conjugates Morin+conjugates. 0.41. ±0.07. Table 1-16. Comparison of AUC0-∞ (nmol ⋅ min /ml) between morin and its conjugates after intravenous administration (20.0 mg/kg).. Rabbits. a. b. f. Mean ±S.E.. c. d. e. 19598.6. 27680.3. 38175.3. 18612.6 24429.6 ±3616.1. 17721.7 10656.3 14991.4. 26013.4. 34854.8. 11361.5 19266.5 ±3854.9. 4607.2. 1666.9. 3320.5. 7251.1. 0.24. 0.06. 0.09. 0.39. Treatments Morin+conjugates morin Conjugates. 28857.5 13653.3. 11135.8 2997.0. 5163.1 ±1421.9. Conjugates Morin+conjugates. 0.39. 0.22. 45. 0.23. ±0.06.
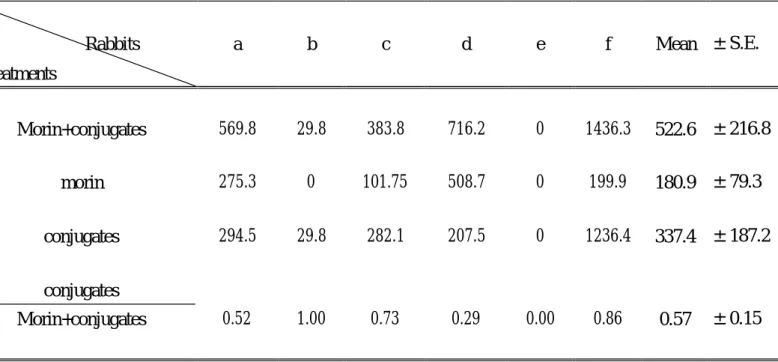
(46) Table 1-17 Comparison of AUC 0-t (nmol ⋅ min /ml) between morin and its conjugates after oral administration (50.0 mg/kg).. a. b. c. d. e. f. Mean ±S.E.. Morin+conjugates. 569.8. 29.8. 383.8. 716.2. 0. 1436.3. 522.6 ±216.8. morin. 275.3. 0. 101.75. 508.7. 0. 199.9. 180.9 ±79.3. conjugates. 294.5. 29.8. 282.1. 207.5. 0. 1236.4. 337.4 ±187.2. 0.52. 1.00. 0.73. 0.29. 0.00. 0.86. Rabbits Treatments. conjugates Morin+conjugates. 0.57. ±0.15. Table 1-18. Comparison of AUC 0-t (nmol ⋅ min /ml) between morin and its conjugates after oral administration (100.0 mg/kg).. a. b. c. d. e. Mean ±S.E.. Morin+conjugates. 5902.1. 7102.7. 4282.0. 8206.5. 6154.3. 6329.0 ±652.9. morin. 5396.4. 5797.4. 3945.7. 6423.5. 5806.8. 5473.9 ±415.9. Conjugates. 505.7. 1305. 3. 336.3. 1783.0. 347.6. 855.6 ±292.6. 0.09. 0.18. 0.08. 0.22. 0.06. 0.13. Rabbits Treatments. Conjugates Morin+conjugates. 46. ±0.03.
(47) Table 1-19. Comparison of pharmacokinetic parameters of morin between intravenous doses of 10.0 mg/kg and 20.0 mg/kg.. Treatments. Vd. AUC0-∞. t1/2. CL. MRT. iV (10.0 mg/kg). 0.15±0.04. 2144.3±321.6. 7.9±2.1. 0.013±0.002. 11.4±2.9. iV (20.0 mg/kg). 0.94 ±0.4*. 19266.5±3854.9 28.6 ±10.5* 0.003±0.0005* 512.7±275.1*. * P < 0.05. 47.
(48) 180 Free form Conjugates. Serum concentration (nmol/ml). 160 140 120 100 80 60 40 20 0 0. 10. 20. 30. 40. 50. 60. 70. Time (min). Fig. 1-4 Mean (±S.E.) serum concentration-time profiles of morin (l) and its conjugates (ο) in six rabbits after intravenous administration (10.0 mg/kg).. 500. Serum concentration (nmol/ml). Free form Conjugates 400. 300. 200. 100. 0 0. 50. 100. 150. 200. 250. 300. Time (min). Fig. 1-5 Mean (±S.E.) serum concentration-time profiles of morin (l) and its conjugates (ο) in six rabbits after intravenous administration (20.0 mg/kg).. 48.
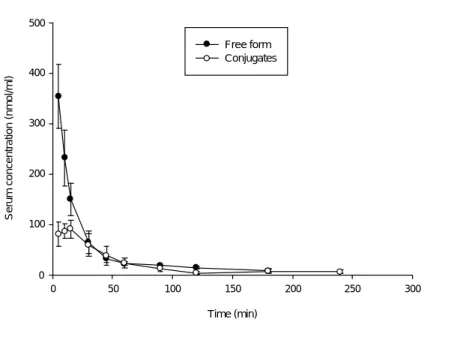
(49) 40. Serum concentration (nmol/ml). Free form Conjugates. 30. 20. 10. 0 0. 50. 100. 150. 200. 250. 300. 350. Time (min). Fig. 1-6 Mean (±S.E.) serum concentration-time profiles of morin (•) and its conjugates (ο) in six rabbits after oral administration (100.0 mg/kg).. 49.
(50) 二、 桑色素於大白鼠體內對環孢靈吸收之影響. 本實驗以大白鼠為模型,探討桑色素對 cyclosporin 吸收的影響。 血 中 cyclosporin 的 濃 度 採 用 螢 光 偏 極 免 疫 法 (Fluorescence Polarization Immuno Assay;. FPIA) 分析,此方法為一種抗原抗體競. 爭結合的免疫反應,利用待測藥物濃度與螢光偏極程度的反比關係, 通過測定樣品的偏極度大小,TDX 儀器會將此關係精確地換算出藥 物濃度單位。 本實驗以 7 隻大白鼠,單服 cyclosporin (10.0 mg/kg) 或併服桑 色素 (50.0 mg/kg) 後,定量血液中 cyclosporin 之濃度,結果顯示單 服 cyclosporin 於各隻大白鼠體內的吸收變異很大。經 WINNONLIN 之 非室體模式 (noncompartment model) 計算出動力學參數,並以 paired Student’s t- test 統計兩種給藥方式之間的差異。結果可分成兩子群, 其中四隻大白鼠併服 morin 後,血中 cyclosporin 之濃度如 Table 2-1~2-2 及 Table 2-5 所示。血藥經時變化圖如 Fig. 2-1~ 2-4 及 Fig. 2-8 1. 所示。單服 cyclosporin 之平均 AUC 0-t 為 2105. 8 ±1349.0 ng· hr· ml- , 變異係數為 52.9 % ,Cmax 為 249.5 ±66.3 ng· ml-1;併服桑色素之平均 AUC. 0-t 為. 8422.3 ±749.9 ng· hr· ml-1, 變異係數為 17.8 %, Cmax 為. 445.2±69.8 ng· ml-1。此結果顯示與 morin 併服後個體之間的變異性有 50.
(51) 變小的現象,以 paired Student's t-test 比較二者之曲線下面積 (AUC 0-t),結果併服桑色素. AUC 0-t 增加 65.1 %,達顯著差異 (p < 0.05);. 而另外三隻大白鼠併服 morin 後,血中 cyclosporin 濃度如 Table 2-3~2-4 及 Table 2-6 所示。血藥經時變化圖如 Fig. 2-5~ 2-7 及 Fig. 2-9 所 示 。 血 液 中 cyclosporin 之 平 均 AUC. 0-t. 為 13190.0 ± 556.9. ng· hr· ml-1,變異係數為 7.3 %,,Cmax 為 553.5 ±64.9 ng· ml-1,併服 桑色素時平均 AUC 0-t 為 8933.6 ±426.1 ng· hr· ml-1,變異係數為 8.3 %, Cmax 為 445.6 ±53.3 ng· ml-1。以 paired Student's t-test 比較二者之曲線 下 面 積 (AUC. 0-t) , 結 果 併 服 桑 色 素 者 面 積 明 顯 減 少 了. 32.3 %. (p<0.05)。因此當 cyclosporin 併服 morin 時,cyclosporin 的血中濃度 須要小心監測,以供劑量調整之參考。 近年來研究指出,控制 cyclosporin 之首渡代謝有二步驟,口服 給藥時,先受腸腔表面 P-glycoprotein 排除[54~57],未被排除者再受腸 與肝之 CYP3A4 代謝[26,58] ,因此影響 P-gp 與 CYP3A4 活性的藥物, 都可能造成 cyclosporin 吸收與代謝的改變。 本實驗結果顯示 morin 會造成 cyclosporin 之 AUC 0-t 及 Cmax 增加 或減少。其中四隻單服 cyclosporin 時濃度偏低的大白鼠,於併服 morin 後,血中 cyclosporin 濃度顯著增高,此可能與體內 P-gp 及/或 CYP3A4 較多有關;另外三隻單服 cyclosporin 時血中濃度偏高的大白鼠,於. 51.
(52) 併服 morin 後,血中 cyclosporin 濃度卻顯著下降,此可能與體內 P-gp 及/或 CYP3A4 較少有關。根據體外翻腸實驗發現 morin 為 P-gp 之抑 制劑,這可解釋 morin 使 cyclosporin 血中濃度增加之部分原因,然而, 另外三隻大白鼠併服 morin 後濃度顯著減少,推測應有其他機轉存 在,或許與 MRP (multidrug resistance protein) [59~61]有關,值得進一步 探討。. 52.
(53) Table 2-1.Cyclosporin blood concentrations (ng/ml) of four rats after oral administration of cyclosporin (10.0 mg/kg )alone. Time ( hr ). Rat-a. Rat-b. Rat-c. Rat-d. Mean. ±S.E.. 1 3 5 8 12 26 36. 19.7 60.7 186.5 114.5 73.7 67.4 22.8. 91.9 130.6 87.6 92.2 90.8 111.8 73.6. 222.5 212.7 161.4 435.6 233.0 233.3 213.2. 5.2 151.0 156.1 133.3 245.1 158.6 81.8. 84.8 138.8 147.9 193.9 160.6 142.8 97.8. ±49.6 ±31.3 ±21.1 ±81.0 ±45.4 ±35.4 ±40.5. Table 2-2. Cyclosporin blood concentrations (ng/ml) of four rats after oral administration of cyclosporin (10.0 mg/kg) with morin (50.0 mg/kg). Time ( hr ). Rat-a. Rat-b. Rat-c. Rat-d. Mean. ±S.E.. 1 3 5 8 12 26 36. 106.7 100.6 92.6 256.7 541.1 201.6 144.0. 90.5 90.6 87.8 94.4 263.4 192.3 131.6. 129.1 297.3 567.4 567.1 293.8 134.2 90.9. 108.1 171.5 156.5 243.3 408.7 233.5 170.1. 108.6 165.0 226.1 290.4 376.8 190.4 134.2. ±7.9 ±47.6 ±114.8 ±99.3 ±63.0 ±20.7 ±16.5. 53.
(54) Table 2-3. Cyclosporin blood concentrations (ng/ml) of three rats after oral administration of cyclosporin (10.0 mg/kg) alone. Time ( hr ). Rat-a. Rat-b. Rat-c. Mean. ±S.E.. 1 3 5 8 12 26 36. 249.4 448.5 353.6 617.0 630.4 250.2 141.9. 141.8 260.2 265.4 221.3 385.4 424.3 269.0. 135.9 257.6 459.6 605.5 350.1 449.3 251.9. 175.7 322.1 326.2 481.3 455.6 374.6 220.9. ±36.8 ±63.2 ±86.0 ±130.0 ±88.1 ±62.6 ±39.8. Table 2-4. Cyclosporin blood concentrations (ng/ml) of three rats after oral administration of cyclosporin (10.0 mg/kg) with morin (50.0 mg/kg). Time ( hr ). Rat-a. Rat-b. Rat-c. Mean. ±S.E.. 1 3 5 8 12 26 36. 27.5 38.1 21.0 21.1 550.9 226.0 93.9. 173.7 388.2 272.7 252.9 140.8 398.9 222.6. 167.1 356.7 267.8 383.8 336.4 163.9 134.0. 122.7 261.0 187.1 219.3 342.7 262.9 150.2. ±47.6 ±111.8 ±83.0 ±106.0 ±118.4 ±70.3 ±38.0. 54.
(55) Table 2-5. Comparison of pharmacokinetic parameters of cyclosporin in rats between receiving cyclosporin alone and coadministration with morin. Rats. a. b. c. d. ±S.E.. Mean. Treatments AUC0-t(ng · hr/ml) Cyclosporin Cyclosporin+morin Cmax (ng/ml) Cyclosporin Cyclosporin+morin. 2605.1 9502.2. 3468.9 6204.5. 8651.0 8902.4. 5686.1 9080.0. 5102.7 8422.2*. 186.5 541.1. 130.6 263.4. 435.6 567.4. 245.1 408.7. 249.5 445.2*. AUMC (ng · hr/ml) Cyclosporin Cyclosporin+morin. 39040.4 156405.6. 62561.6 116579.5. 152171.4 114932.9. MRT (hr) Cyclosporin Cyclosporin+morin. 14.9 16.4. 18.0 18.7. 17.5 12.9. 97299.8 157592.2. 87768.3 136377.5. 17.1 17.4. 16.9 16.3. ±1349.0 ±749.8 ±66.3 ±69.8 ±24577.0 ±11912.9 ±0.6 ±1.2. * p< 0.05 Table 2-6. Comparison of pharmacokinetic parameters of cyclosporin in three rats between receiving cyclosporin alone and coadministration with morin.. Rats Treatments AUC0-t(ng · hr/ml) Cyclosporin Cyclosporin+morin Cmax (ng/ml) Cyclosporin Cyclosporin+morin AUMC (ng · hr/ml) Cyclosporin Cyclosporin+morin MRT (hr) Cyclosporin Cyclosporin+morin. e. f. g. Mean. ±S.E.. 13702.1 8384.7. 12077.4 9772.7. 13790.4 8643.2. 13189.9 8933.5*. ±556.8 ±426.1. 630.4 550.9. 424.3 398.9. 605.5 383.8. 553.4 444.5. ±64.9 ±53.3. 196485.3 148060.5. 233731.7 192845.7. 14.3 17.6. 247798.0 128110.7. 19.3 19.7. 17.9 14.8. * p< 0.05 55. 226005.0 156338.9 17.2 16.8. ±15308.2 ±19140.3 ±1.4 ±0.9.
(56) cyclosporin cyclosporin + morin. cyclosporin concentration (ng/ml). 300. 250. 200. 150. 100. 50. 0 0. 10. 20. 30. 40. time (hr). Fig. 2-1 Whole blood concentration-time profile of cyclosporin after oral administration of cyclosporin (10.0 mg/kg) alone and coadministration with morin (50.0 mg/kg) to rat a.. cyclosporin cyclosporin+morin. cyclosporin concentration (ng/ml). 300. 250. 200. 150. 100. 50. 0 0. 10. 20. 30. 40. time (hr). Fig. 2-2 Whole blood concentration-time profile of cyclosporin after oral administration of cyclosporin (10.0 mg/kg) alone and coadministration with morin (50.0 mg/kg) to rat b.. 56.
(57) 600. cyclosporin. cyclosporin concentration (ng/ml). cyclosporin+morin 500. 400. 300. 200. 100. 0 0. 10. 20. 30. 40. time (hr). Fig. 2-3 Whole blood concentration-time profile of cyclosporin after oral administration of cyclosporin (10.0 mg/kg) alone and coadministration with morin (50.0 mg/kg) to rat c.. cyclosporin cyclosporin+morin. cyclosporin concentration (ng/ml). 500. 400. 300. 200. 100. 0 0. 10. 20. 30. 40. time (hr). Fig. 2-4 Whole blood concentration-time profile of cyclosporin after oral administration of cyclosporin (10.0 mg/kg) alone and coadministration with morin (50.0 mg/kg) to rat d.. 57.
(58) cyclosporin cyclosporin+morin. cyclosporin concentration (ng/ml). 700. 600. 500. 400. 300. 200. 100. 0 0. 10. 20. 30. 40. time (hr). Fig. 2-5 Whole blood concentration-time profile of cyclosporin after oral administration of cyclosporin (10.0 mg/kg) alone and coadministration with morin (50.0 mg/kg) to rat e.. cyclosporin cyclosporin+morin. cyclosporin concentration (ng/ml). 450. 400. 350. 300. 250. 200. 150. 100 0. 10. 20. 30. 40. time (hr). Fig. 2-6 Whole blood concentration-time profile of cyclosporin after oral administration of cyclosporin (10.0 mg/kg) alone and coadministration with morin (50.0 mg/kg) to rat f. 58.
(59) cyclosporin cyclosporin+morin. cyclosporin concentration (ng/ml). 700. 600. 500. 400. 300. 200. 100 0. 10. 20. 30. 40. time (hr). Fig. 2-7 Whole blood concentration-time profile of cyclosporin after oral administration of cyclosporin (10.0 mg/kg) alone and coadministration with morin (50.0 mg/kg) to rat g.. 59.
(60) cyclosporin concentration (ng/ml). 600 cyclosporin cyclosporin+morin. 400. 200. 0 0. 10. 20. 30. 40. time (hr). Fig. 2-8 Mean (±S.E.) blood concentration-time profiles of cyclosporin after administration of cyclosporin alone (l) and coadministration with morin (¡) in four rats.. cyclosporin cyclosporin+morin. cyclosporin concentration (ng/ml). 800. 600. 400. 200. 0 0. 10. 20. 30. 40. time (hr). Fig. 2-9 Mean (±S.E.) blood concentration-time profiles of cyclosporin after administration of cyclosporin alone (l) and coadministration with morin (¡) in three rats.. 60.
(61) 三. 黃酮 元對 P-gp 活性之影響 Rhodamine 123 為 P-gp 的專一受質,本研究以 rhodamine 123 之螢光為指標,定量由漿膜層運送到黏膜層的 rhodamine,以瞭解黃 酮. 元對 P-gp 活性之影響。檢量線係以螢光強度為 y 軸,rhodamine. 123 濃度為 x 軸,作線性迴歸,並求出檢量線方程式及相關係數,所 得 rhodamine 123 之檢量線方程式為 y =132.3χ- 2.6 (r =0.997)。檢品 依檢量線定量 rhodamine 123,結果如表 3-1~3-10 所示。再由 ANOVA 比較空白組與給藥組之間的差異,結果顯示桑色素 200.0 µM 與 400.0 µM 均對空腸與迴腸的 P-gp 有抑制作用,並達統計上的意義 (p < 0.05),且呈現出劑量依賴性,劑量越大抑制效果越強;槲皮素在空腸 的部分對 P-gp 有抑制作用,但未達統計上的意義,對迴腸 P-gp 抑制 作用則達統計學上的意義 (p < 0.05);柚皮. 元無論在空腸與迴腸皆. 對 P-gp 的活性無顯著影響,如圖 3-1 ~ 3-4 所示。因此,我們認為桑 色素與槲皮素對空腸與迴腸之 P-gp 活性為抑制作用,此結果與 1997 [62]. 年發表槲皮素為 P-gp 抑制劑的結果相符 ,然而卻與 1994 年發表槲 皮素對 HCT-15 colon cells 之 P-gp 活性為活化作用之文獻結果相反 [30]. ,此岐異尚待更多的研究來釐清。. 61.
(62) Table 3-1. Transport of rhodamine 123 (µg/ml) from serosal to mucosal side across the everted jejunum (control group, n=3). Rats. a. b. c. Mean. ±S.E.. 0.19 0.24 0.29 0.30 0.36 0.41. 0.18 0.21 0.26 0.31 0.35 0.41. 0.19 0.21 0.22 0.26 0.29 0.40. 0.19 0.22 0.26 0.29 0.33 0.41. ±0.003 ±0.02 ±0.02 ±0.02 ±0.02 ±0.003. Time ( min ) 15 30 45 60 75 90. Table 3-2. Transport of rhodamine 123 (µg/ml) from serosal to mucosal side across the everted jejunum in the presence of morin at concentration of 200.0 µM (n=5).. Rats Time ( min ) 15 30 45 60 75 90. a. b. c. d. e. Mean. ±S.E.. 0.20 0.22 0.24 0.25 0.30 0.37. 0.19 0.21 0.22 0.24 0.26 0.27. 0.19 0.21 0.22 0.26 0.33 0.35. 0.18 0.20 0.23 0.26 0.30 0.31. 0.20 0.22 0.24 0.25 0.29 0.30. 0.19 0.21 0.23 0.25 0.29 0.32. ±0.003 ±0.004 ±0.005 ±0.004 ±0.01 ±0.01. 62.
(63) Table 3-3. Transport of rhodamine 123 (µg/ml) from serosal to mucosal side across the everted jejunum in the presence of morin at concentration of 400.0 µM (n=5).. Rats Time ( min ) 15 30 45 60 75 90. a. b. c. d. e. Mean. ±S.E.. 0.18 0.20 0.23 0.26 0.30 0.32. 0.18 0.20 0.22 0.26 0.26 0.29. 0.19 0.22 0.22 0.22 0.24 0.25. 0.19 0.21 0.22 0.24 0.28 0.30. 0.18 0.21 0.23 0.26 0.31 0.34. 0.19 0.21 0.22 0.25 0.28 0.30. ±0.002 ±0.003 ±0.004 ±0.008 ±0.01 ±0.02. Table 3-4. Transport of rhodamine 123 (µg/ml) from serosal to mucosal side across the everted jejunum in the presence of quercetin at concentration of 200.0 µM (n=3). Rats Time ( min ) 15 30 45 60 75 90. a. b. c. Mean. ±S.E.. 0.19 0.21 0.26 0.38 0.42 0.52. 0.18 0.18 0.19 0.21 0.22 0.26. 0.19 0.20 0.22 0.25 0.27 0.25. 0.19 0.20 0.23 0.28 0.30 0.36. ±0.003. 63. ±0.007 ±0.02 ±0.05 ±0.06 ±0.08.
(64) Table 3-5. Transport of rhodamine 123 (µg/ml) from serosal to mucosal side across the everted jejunum in the presence of naringenin at concentration of 200.0 µM (n=4).. Rats Time ( min ) 15 30 45 60 75 90. a. b. c. d. Mean. ±S.E.. 0.19 0.22 0.27 0.31 0.36 0.42. 0.18 0.22 0.26 0.31 0.36 0.39. 0.18 0.20 0.26 0.28 0.34 0.37. 0.18 0.22 0.24 0.29 0.34 0.34. 0.18 0.22 0.26 0.30 0.35 0.38. ±0.003 ±0.006 ±0.007 ±0.008 ±0.007 ±0.02. Table 3-6. Transport of rhodamine 123 (µg/ml) from serosal to mucosal side across the everted ileum (control group, n=4). Rats Time ( min ) 15 30 45 60 75 90. a. b. c. d. Mean. ±S.E.. 0.18 0.22 0.26 0.33 0.39 0.43. 0.19 0.22 0.26 0.31 0.37 0.46. 0.18 0.19 0.24 0.27 0.31 0.38. 0.19 0.22 0.25 0.31 0.38 0.43. 0.18 0.21 0.25 0.31 0.36 0.43. ±0.005 ±0.007 ±0.04 ±0.01 ±0.02 ±0.02. 64.
(65) Table 3-7. Transport of rhodamine 123 (µg/ml) from serosal to mucosal side across the everted ileum in the presence of morin at concentration of 200.0 µM (n=4). Rats Time ( min ) 15 30 45 60 75 90. a. b. c. d. Mean. ±S.E.. 0.18 0.18 0.21 0.22 0.26 0.28. 0.19 0.22 0.26 0.31 0.34 0.39. 0.18 0.19 0.21 0.23 0.27 0.34. 0.18 0.21 0.23 0.27 0.30 0.30. 0.19 0.20 0.23 0.26 0.29 0.33. ±0.002 ±0.007 ±0.01 ±0.02 ±0.02 ±0.02. Table 3-8. Transport of rhodamine 123 (µg/ml) from serosal to mucosal side across the everted ileum in the presence of morin at concentration of 400.0 µM (n=5). Rats Time ( min ) 15 30 45 60 75 90. a. b. c. d. e. Mean. ±S.E.. 0.19 0.21 0.23 0.26 0.30 0.35. 0.18 0.19 0.20 0.22 0.24 0.26. 0.19 0.20 0.22 0.24 0.26 0.28. 0.19 0.21 0.23 0.23 0.28 0.30. 0.19 0.20 0.22 0.22 0.27 0.31. 0.19 0.20 0.22 0.25 0.27 0.30. ±0.002 ±0.003 ±0.006 ±0.006 ±0.01 ±0.02. 65.
(66) Table 3-9. Transport of rhodamine 123 (µg/ml) from serosal to mucosal side across the everted ileum in the presence of quercetin at concentration of 200.0 µM (n=4).. Rats a. b. c. d. Mean. ±S.E.. 0.18 0.18 0.20 0.22 0.26 0.27. 0.18 0.18 0.20 0.22 0.26 0.30. 0.18 0.19 0.22 0.25 0.29 0.30. 0.18 0.19 0.22 0.26 0.31 0.36. 0.19 0.19 0.21 0.24 0.28 0.31. ±0.002 ±0.002 ±0.007 ±0.01 ±0.01 ±0.02. Time ( min ) 15 30 45 60 75 90. Table 3-10. Transport of rhodamine 123 (µg/ml) from serosal to mucosal side across the everted ileum in the presence of naringenin at concentration of 200.0 µM (n=4).. Rats Time ( min ) 15 30 45 60 75 90. a. b. c. d. Mean. ±S.E.. 0.18 0.21 0.26 0.32 0.40 0.47. 0.19 0.24 0.31 0.39 0.44 0.54. 0.18 0.20 0.24 0.28 0.33 0.34. 0.18 0.21 0.23 0.28 0.41 0.32. 0.18 0.21 0.26 0.32 0.39 0.35. ±0.003 ±0.009 ±0.02 ±0.03 ±0.02 ±0.04. 66.
(67) Concentration of rhodamine 123 (µg/ml). 0.45. control morin (200.0 µM) morin (400.0 µM). 0.40. 0.35. * *. 0.30. *. 0.25. *. *. 0.20. 0.15 0. 20. 40. 60. 80. 100. Time (min). Fig. 3-1.Average transport of rhodamine 123 (µg/ml) across jejunum in the absence or presence of morin (200.0 , 400.0 µM). Concentration of rhodamine 123 (µg/ml). 0.50 control morin (200.0 µM) morin (400.0 µM). 0.45. 0.40. 0.35. * *. *. 0.30. *. 0.25. *. 0.20. 0.15 0. 20. 40. Time (min). 60. 80. 100. Fig. 3-2 Average transport of rhodamine 123 (µg/ml) across ileum in the absence or presence of morin (200.0, 400.0 µM). 67.
(68) Concentration of rhodamine 123 (µg/ml). 0.50 control quercetin naringenin. 0.45. 0.40. 0.35. 0.30. 0.25. 0.20. 0.15 0. 20. 40. 60. 80. 100. Time (min). Fig.3-3 Average transport of rhodamine 123 (µg/ml) across jejunum in the absence or presence of quercetin and naringenin at 200.0 µM.. Concentration of rhodamine 123 (µg/ml). 0.50 control quercetin naringenin. 0.45. 0.40. 0.35. *. 0.30. *. 0.25. 0.20. 0.15 0. 20. 40. 60. 80. 100. Time (min). Fig.3-4 Average transport of rhodamine 123 (µg/ml) across ileum in the absence or presence of quercetin and naringenin at 200.0 µM. 68.
(69) 參考文獻. [1] Hertog MG, Hollman PC, Katan MB, Kromhout D. Intake of potentially anticarcinogenic flavnoids and their determinants in adults in the Netherlands. Nutr Cancer 1993, 20: 21-29. [2] Justesen U, Knuthsen P, Leth T .Determination of plant polyphenols in Danish foodstuffs by HPLC UV and LC –MS detection. Cancer Lett. 1997, 114: 165-167. [3] Fahey, G.C. and Jung, H.J.G. Phenolic compounds in forages and fibrous feedstuffs. In toxicants of plant origin. 1980, 4: 123-190. [4] M. G. L. Hertog et al. Arch. Intern. Med.1995, 155: 381. [5] S. M. Kuo, Crit. Rev. Oncog. 1997: 8: 47. [6] Windholz M. The Merk index, 11 th, Edn, 1989: 986 –987. [7] 張 賢 哲 , 蔡 貴 花 : 中 藥 炮 製 學 , 中 國 醫 藥 學 院 出 版 組 , 1992 ; 301-302. [8] 中國藥材學,國立中央圖書館出版品,1 9 8 8 ;2 6 9 - 2 7 1 . [9] 中藥藥理及運用,啟業書局有限公司,1 9 8 5 ;5 5 4 . [10]. 中國藥物學,台聯國風出版社,1 9 7 2 ;4 4 2 - 4 4 3 .. [11] Wu TW, Fung KP, Yang CC, Weisel RD. Antioxidation of human low density lipoprotein by morin hydrate. Life Sciences. 1995, 57: 51-56. [12]. V. Elangovan, N. Sekar and S. Govindasamy. Cancer Lett. 1994, 87: 107-113. 69.
(70) [13] Larson, R.A. The antioxidants of higher plants. Phytochemistry. 1988, 27: 969-978. [14] Jones TE. The use of other drugs to allow a lower dosage of cyclosporin to be used. Clin. Pharmacokinet.1997, 32:357-367. [15] Dollery SC, Boobis AR, Burley D, Davies DM, Davies DS, Harrison PI, Orme ML, Park BK, Goldberg LI. Therapeutic Drugs 1: C373- 377, 1991. [16] Schumacher GE. Therapeutic Drug Monitoring. 1995, 449-468. [17] Spatzenegger M, Jaeger W. Clinical importance of hepatic cytochrome P450 in drug metabolism. Drug Metab. Rev. 1995, 27: 397-417. [18] Kolars JC, Schmiedlin-ren P, Schuetz JD, Fang Che, Watkins PB. Identification of rifampin-inducible P450IIIA4 (CYP3A4) in human small bowel enterocytes. J. Clin. Invest. 1992, 90: 1871-1878. [19] Kremers P, Beaune P, Cresteil T, De Grave J, Columelli S. Cytochrome P450 monooxygenase activity in human and rat liver microsomes. Eur. J. Biological Chemistry. 1981, 118: 599-606. [20] Murray GI, Barnes TS, Sewell HF, Ewen SWB, Melvin WT. The immunocytochemical localisation and distribution of cytochrome P450 in normal hepatic and extrahepatic tissue with a monoclonal antibody to human cytochrome P450. Br. J. of Clin. Pharmacol. 1988, 25: 465-475. [21] Peters WHM, Kremers PG. Cytochromes P450 in the intestinal mucosa of man. Biochem. Pharmacol. 1989, 38: 1535-1538. [22] Watkins PB, Wrighton SA, Schuetz EG, Molowa DT, Guzelian PS. 70.
(71) Identification of glucocorticoid cytochrome P450 in the intestinal mucosa of rats and man. J. Clin. Invest. 1987, 45: 2220-2222. [23] Krishna DR, Klotz U, Extrahepatic metabolism of Drugs in human. Clin. Pharmacokinet. 1994, 26:144-160. [24] Yumoto R, Murakami T, Nakamoto Y, Hasegawa R, Nagai J, Takano M. Transport of rhodamine 123, a P-glycoprotein substrate, across rat intestine and Caco-2 cell monolayers in the presence of cytochrome P-450 3A-related compounds. Journal of Pharmacology and Experimental Therapeutics. 1999, 289: 149-155. [25] Hall SD, Thummel KE, Watkins PB, Lown KS, Benet LZ, Paine MF, Mayo RR, Turgeon DK, Bailey DG, Fontana RJ, Wrighton SA. Molecular and physical mechanisms of first-pass extraction. Drug Metab. Dispos. 1998, 27: 161-166. [26] Su SF, Huang JD. Inhibition of intestinal digoxin absorption and exsorption by quinidine. Drug metabolism and disposition.1995, 24:142-147 [27] Lown KS, Mayo RP, Leichtman AB, Hoiao HL, Turgeon DK, Schmiedlin-Ren P, Brown M-B, Guo W, Rossi SJ, Benet LZ, Watkins P-B. Role of intestinal P-glycoprotein in interpatient variation in the oral bioavailability of cyclosporin A. Clin. Pharmacol. Ther. 1997, 62:248-260. [28] Critchfiels JW, Welsh CJ, Phang JM, Yeh CG. Modulation of adriamycin accumulation and efflux by flavonoids in HCT-15 colon cells. Biochem. Pharmacol. 1994, 48:1437-1445. [29] Miniscalco A, Lundahl J, Regardh CG, Edgar B, Eriksson UG, Inhibition of dihydropyridine metabolism in rat and human liver 71.
(72) microsomes by flavonoids found in grapefruit juice. Journal of Pharmacology. and. Experimental. Therapeutics.. 1992,. 261:. 1195-1198. [30] Fuhr U, MD, and Kummert AL. The fate of naringenin in human: a key to grapefruit juice–drug interaction? Clin. Pharmacol. Ther.1995, 58: 365-373. [31] Soldner A, Christians U, Susanto M, Wacher V J, Silverman JA, Benet LZ. Grapefruit juice activates P-glycoprotein- mediated drug transport. Pharmaceutical Research. 1999, 16: 478-485. [32] The merck index.1996, 6438-6439. [33] Srobak J, Gryglewski RJ. Flavonoids are scavengers of superoxide anion. Biochem. Pharmacol. 1988, 37: 83-88. [34] Dreyfuss M, Harri E, Hofmann H, Kobel H, Pache W, Tscherter H. Cyclosporin A and C. New metabolites from Trichoderma polysporium (Link ex Pers) Rifai. European Journal Applied Microbiology 3:125-133, 1976. [35] Wenger R. Chemistry of cyclosporin. In: White D(ed) Cyclosporin A. Elsevier Biomedical 3:19-34, 1982. [36] Okamura N, Hirai M, Tanigawara Y, Tanaka K, Yasuhara M, Ueda K, Komano T, Hori R. Digoxin-cyclosporin A interaction: Modulation of the multidrug transport P-glycoprotein in the kidney. Journal of Pharmacology and Experimental Therapeutics. 1993, 266: 1614-1619. [37] Kronhe M, Leonard WJ, Depper JM. Cyclosporin A inhibits T-cell growth factor gene expression at the level of m-RNA transcription. Proc. Natl. Acad. Sci. U.S.A. 1984, 81: 5214-5218. 72.
(73) [38] Andrus L, Lafferty KJ, Inhibition of T-cell activation by cyclosporin A. Scand. J. Immunol. 1982, 15: 449-457. [39] Kim RB, Fromm MF, Wandel C, Leake B, Wood AJJ, Roden DM. The drug transporter P-glycoprotein limits oral absorption and brain entry of HIV-1 protease inhibitors. J. Clin. Invest. 1998, 101: 289-294. [40] Edwards DJ., Michael E, Fitzsimmons, Erin G. Schuetz, Kazuto Yasuda, Murray P, Ducharme, Lawrence H. Warbasse, Patrick M. Woster, Schuetz JD, Watkins P. 6',7'-Dihydroxybergamottin in grapefruit juice and Seville orange juice: Effects on cyclosporin disposition,. enterocyte. CYP3A4,. and. P-glycoprotein.. Clin.. Pharmacol. Ther. 1999, 65: 237-244. [41] Keown PA, Stiller CR, Laupacis AL. The cyclosporin: relationship to drug pharmacokinetics. Transplant. Proc. 1982, 14: 659-661. [42] Langhoff E, Madsen S. Rapid metabolism of cyclosporin and prednisone in kidney transplant patients on tuberculostatic treatment. Lancet. 1983, 2: 1031. [43] Wille RT, Lown KS, Huszczo UR, Schmiedlin-Ren P, Watkins PB. Short term effect of medications on CYP3A4 and P-glycoprotein expression in human intestinal mucosa. Gastroenterology. 1997, 112: A419. [44] Siegsmund MJ, Cardarelli C, Aksentijevich I, Sugimoto Y, Pastan I, Gottesman MM. Ketoconazole effecitively reverses multidrug resistance in highly resistant KB cells. J. Urol. 1994, 151: 485-491. [45] Salphati L, Benet LZ. Effects of ketoconazole on digoxin absorption and disposition in rats. Pharmacology. 1998, 56:308-313. 73.
(74) [46] Durrant S, Chipping PM, Palmer S, Gordon-Smith EC. Cyclosporin A methylprednisolone and convulsions. Lancet. 1982, 2: 829. [47] Barratt AJ, Kendra JR, Lucas CF. Cyclosporin A as prophylaxis against graft versus host disease in 36 patients. Br. Med. J. 1982, 285: 162-166. [48] Hebert M.F. Contributions of hepatic and intestinal metabolism and P-glycoprotein to cyclosporin and tacrolimus oral drug delivery. Advanced drug delivery reviews. 1997, 27:201-214. [49] Ambudkar SV, Dey S, Hrycyna CA, Ramachandra M, Pastan I, Gottesman MM. Biochemical, cellular, and phamacological aspects of the multidrug transporter. Annu. Rev. Pharmacol. Toxicol. 1999, 39: 361-98. [50] Hunter J. Hirst BH. Intestinal secretion of drugs. The role of P-glycoprotein and related drug efflux systems in limiting oral drug absorption. Advanced drug delivery reviews. 1997, 25:129-157. [51] Fardel O, Lecureur V, Guillouzo A. The P-glycoprotein multidrug transporter. Gen. Pharmac. 1996, 27: 1283-1291. [52] Watkins PB. The barrier fuction of CYP3A4 and P-glycoprotein in the small bowel. Advanced drug delivery reviews. 1997, 27:161-170. [53] Salphati L, Benet LZ. Modulation of P-glycoprotein expression by cytochrome P450 3A induced in male and female rat livers. Biochemical Pharmacology. 1998, 55: 387-395. [54] Fricker G, Drewe J, Huwyler J, Gutmann H, Beglinger C. Relevance of P-glycoprotein for the enteral absorption of cyclosporin A: in vitro-in vivo correlation. British Journal of Pharmacology. 1996, 118:1841-1847, 74.
(75) [55] Saeki T, Ueda K, Traigawara Y, Hori R, Komano T, Human P-glycoprotein transports cyclosporin A and FK506. The Jounal of Biological Chemistry. 1993, 268: 6077-6080. [56] Stein WD, Kinetics of the multidrug transporter (p-glycoprotein) and its reversal. Physiological Reviews. 1997, 77:545-590. [57] Hall SD, Thummel KE, Watkins PB, Lown KS, Benet LZ, Paine MF, Mayo RR, Turgeon DK, Bailey DG, Fontana RJ, Wrighton SA. Molecular and physical mechanisms of first-pass extraction. Drug Metab. Dispos. 1998, 27: 161-166. [58] Albengres E, Tillement JP. Cyclosporin and ketoconazole, drug interaction or therapeutic association? International Journal of Clinical Pharmacology. Therapy and Toxicology. 1992, 30: 555-570. [59] Lautier D, Canitrot Y, Delley RG, Cole SPC. Multidrug resistance mediated by the multidrug resistance protein (MRP) gene. Biochemical Pharamacology. 1996, 52: 967-977 [60] Sugawara I, Akiyama S, Scheper RJ, Itoyama S. Lung resistance protein (LRP) expression in human normal tissues in comparison with that of MDR1 and MRP. Cancer Letter. 1997, 112:23-31. [61] Barrand M, Bagrij T, Neo SY. Multidrug resistance- associated protein: A protein distinct from P-glycoprotein involved in cytotoxic drug expulsion. Gen. Pharmac. 1997, 28:639-645. [62] Shapiro AB, Ling V. Effect of quercetin on Hoechst 33342 transport by purified and reconstituted p-glycoprotein. Biochem. Pharmacol. 1997, 53: 587-596.. 75.
(76)
數據
+7
Outline
相關文件
Milk and cream, in powder, granule or other solid form, of a fat content, by weight, exceeding 1.5%, not containing added sugar or other sweetening matter.
Consistent with the negative price of systematic volatility risk found by the option pricing studies, we see lower average raw returns, CAPM alphas, and FF-3 alphas with higher
In order to apply for a permit to employ Class B Foreign Worker(s), an Employer shall provide reasonable employment terms and register for such employment demands with local
Should an employer find it necessary to continue the employment of the Class A Foreign Worker(s), the employer shall, within four (4) months prior to the expiration of the
You are given the desired boiling point of an ethylene glycol solution containing 1.0 kg of water and asked to find the mass of ethylene glycol you need to add to achieve the
Reading Task 6: Genre Structure and Language Features. • Now let’s look at how language features (e.g. sentence patterns) are connected to the structure
0 allow students sufficient time to gain confidence and the skills of studying in English, allow time for students to get through the language barrier, by going through
Wang, Solving pseudomonotone variational inequalities and pseudocon- vex optimization problems using the projection neural network, IEEE Transactions on Neural Networks 17
