行政院國家科學委員會專題研究計畫 成果報告
台灣低塑性粉土質砂工程性質與防制對策研究--子記畫
一:S/M(砂/粉土)互層土壤之現場與室內測試
研究成果報告(精簡版)
計 畫 類 別 : 整合型 計 畫 編 號 : NSC 97-2221-E-009-128- 執 行 期 間 : 97 年 08 月 01 日至 98 年 07 月 31 日 執 行 單 位 : 國立交通大學土木工程學系(所) 計 畫 主 持 人 : 黃安斌 計畫參與人員: 碩士班研究生-兼任助理人員:朱瑞陽 處 理 方 式 : 本計畫可公開查詢中 華 民 國 99 年 01 月 06 日
1
Field Evaluation of the Cyclic Strength versus Cone Tip
Resistance Correlation in Silty Sands
By
An-Bin Huang1, Yuan-Yu Tai2, Wei F. Lee3, and Yao-Tao Huang2 1. Professor, Department of Civil Engineering, National Chiao Tung University,
Hsin Chu, Taiwan
2. Former Graduate Research Assistant, Department of Civil Engineering, National Chiao Tung University, Hsin Chu, Taiwan
3. Research Associate Professor, National Taiwan University of Science and Technology, Taipei, Taiwan
Corresponding author: An-Bin Huang
Department of Civil Engineering National Chiao Tung University,
1001 Ta Hsueh Road, Hsin Chu, Taiwan. Email: [email protected] Phone: +886-5722-803
Fax:+886-5716-257
2
ABSTARCT
The liquefaction potential assessment under the framework of simplified procedure that involves the use of cone penetration tests (CPT) typically relies on empirical correlations between the soil cyclic resistance ratio, CRR and cone tip resistance qt. For sands that contain fines (particles passing #200 sieve), an adjustment based on fines content in the CRR-qt correlation is called for in currently available procedures. Earlier laboratory calibration tests in reconstituted silty sand specimens performed by the authors have indicated that partial drainage in CPT played an important role in the CRR-qt correlations. A series of laboratory tests on undisturbed samples and field piezocone penetration tests (CPTU) were carried out in an alluvial soil deposit at two test sites in Central and Southern Taiwan. The results indicated that unlike the uniformly mixed specimens reconstituted in laboratory, the tested natural alluvial silt/sand soils can be heterogeneous with closely spaced clean sand layers embedded in a matrix of silty material. This stratification can render the CPTU a drained test even at fines contents well in excess of 50%. The ignorance of free draining effects on CPTU due to stratification in alluvial soils may lead to overestimation of CRR. Because of these factors, calibration of the CRR-qt correlations by performing tests in local soil and field procedures to ascertain the drainage conditions in CPTU are important to the proper application of the CRR-qt correlations in the liquefaction potential assessment.
Keywords: silt, sand, fines content, liquefaction, CPTU
International Geotechnical Classification Numbers: D07, E07
INTRODUCTION
Earlier studies on the behavior of granular materials have been biased towards clean, uniformly graded sands. Natural sands often contain various amounts of fines (particles passing #200 sieve). Experience shows that mineral contents, grain shapes and plasticity of the fines are important contributing factors to the mechanical behavior of sand that contains fines (Ishihara, 1993; and Lade et al., 1998). Limited by the difficulties of taking undisturbed samples in cohesionless soils, the existing studies
3
have mostly been focused on relative comparisons amongst reconstituted sand specimens with fines, in terms of strengths (Polito, 1999; Salgado et al., 2000; and Thevanayagam et al., 2002), density states (Lade et al., 1998) and microstructures (Yamamuro and Wood, 2004). The cyclic resistance ratio (CRR) required for liquefaction potential assessment has been inferred from empirical correlations between CRR and field test results under the framework of simplified procedure (Youd et al., 2001). The cone tip resistance (qt) has been an important option among the available field test results used in the simplified procedure. The cone penetration tests to be described in the paper involve piezocone penetration tests (CPTU) and chamber CPTU calibration tests under a back pressure. For simplicity, the term qt will be used to represent the cone tip resistance from CPT and CPTU throughout the paper. qt is the cone tip resistance from CPTU adjusted for differential cross sectional areas due to the porous element behind the cone tip according to Campanella and Robertson (1988) as ) 1 ( 2 a u q qt = c + − (1) where
qc = original cone tip resistance a = net area ratio of the piezocone
u2 = pore pressure measured at the base of cone tip
The net area ratio, a equals to the ratio of net cross-sectional area, AN inside of the
porous element, to the total cross-sectional area of the piezocone, AT (AT =10 cm2 for
a typical piezocone). Most piezocones have a value ranged from 0.6 to 0.9. For CPT or CPTU in dry soil, qt = qc. Liquefaction potential assessment under the simplified procedure framework using CPT has been based on qt normalized to an effective vertical stress, of one atmospheric pressure (σatm ≈ 100 kPa), or qt1N defined as:
(
)
n vo atm atm t N tq
q
1=
σ
(
σ
σ
′
)
(2) where4
The associated CRR-qt1N correlations for clean sands have been established according to field observations. Although different in magnitude and/or format, it has been suggested separate sets of CRR-qt1N correlations should be used for sands with fines (Stark and Olson, 1995). Alternatively, the qt1N should be adjusted to an equivalent clean sand value, (qt1N)cs before invoking the CRR-(qt1N)cs correlation (Robertson and Wride, 1998).
Since no soil samples are taken in CPT, it is necessary to classify the soil type as a priori in order to determine the value of n for qt stress normalization and calculate (qt1N)cs. Graphical, CPT-based soil classification charts have been developed (e.g.,
Olsen, 1994) and can be used for the purpose. Alternatively, the soil classification can be made based on a soil behavior index, Ic (Robertson and Wride, 1998), which is defined as:
Ic = {3.47−log(Q)}2 +{1.22+log(F)}2 (2) The normalized cone tip resistance, Q is defined as:
n vo atm atm vo t
q
Q
⎟⎟
⎠
⎞
⎜⎜
⎝
⎛
⋅
−
=
'
)
(
σ
σ
σ
σ
(3)σvo = total overburden stress and
F = 100·fs/(qt-σvo) (4)
The exponent n = 1.0 in the general case of clayey soils (Ic > 2.60), n = 0.5 for clean
sands (Ic = 1.64), and intermediate values of n apply for mixtures of sand and silt.
Some iteration may be required for the selection of n and computation of Ic. The use
of Ic is preferred over the graphical classification charts as the procedure can be easily
organized in a computer program. For CPT in sands with fines (1.64<Ic <2.60)
5
(
qt1N)
cs =Kcqt1N (5) andKc =−0.403Ic4+5.58Ic3−21.63Ic2 +33.75Ic −17.88 (6) Robertson and Wride (1998) proposed a general correlation between Ic and fines
content (FC) as shown in Figure 1, for sands with fines content <50%. According to Equation (6), Kc relates to a 4th order equation of Ic, making Kc rather sensitive to the
change in Ic (and thus change in fines content). For a given qt1N, an increase of Ic from
1.64 to 2.6 would cause Kc to increase from 1 to over 3 and thus more than three-fold
increase in (qt1N)cs. Despite the significant impact of fines content adjustment on the outcome of liquefaction potential assessment, little explanation has been offered to justify such adjustment (Ishihara, 1993; Youd, 2001).
Parts of the Western and Southern Taiwan are covered by a thick deposit of alluvial material. The thickness of this silt/sand and clay layer can exceed hundreds of meters. Liquefaction and subsidence due to groundwater pumping have been the major
concerns for the soils in this region. The authors performed a series of laboratory tests on silty sand taken from a construction site in Mai Liao Township of Western Taiwan. Tests on Mail Liao Sand (MLS) included CPTU in a calibration chamber,
one-dimensional consolidation, monotonic and cyclic triaxial tests. The data revealed high compressibility of MLS (Huang et al., 1999) and its impact on the behavior of MLS (Huang et al., 2004). With the available database, it was possible to evaluate the correlation between CRR and qt and its relationships with fines content, entirely based on laboratory tests on reconstituted specimens. The laboratory calibration of CRR-qt1N correlation in MLS showed that the qt1N adjustment became significant only when the fines started affecting the drainage conditions in CPTU. This result suggests that a more effective qt1N adjustment scheme should be based on CPTU drainage conditions rather than fines content. Thus, the pore pressure dissipation test in CPTU or other means to reveal the significance of partial drainage in CPTU may be more desirable to provide the basis for fines content adjustment. Campanella et al. (1981) demonstrated the partial drainage characteristics of CPTU in clayey silt. By lowering the penetration rate from 20 mm/sec to 0.2 mm/sec,
6
allowing more time for pore pressure dissipation, the accumulation of cone
penetration induced pore pressure is reduced. This penetration rate reduction created a twofold increase of the effective qt (qt minus total pore pressure around the cone tip). The less pore pressure generation was apparently due to higher level of consolidation when penetration rate was reduced. The rate of consolidation for soil surrounding a cone tip is inversely proportional to the square of the cone diameter (Robertson et al., 1992). Therefore, changing the cone diameter can also duplicate the effects of penetration rate. McNeilan and Bugno (1984) reported their experience of CPT in offshore California silts. There was a 2 to 5 minute delay for recycling the
underwater jacking unit when pushing the cone from seabed. At the start of the subsequent push, temporarily greater qt and sleeve friction, fs were measured. The
increase in qt and fs were referred to as setups by McNeilan and Bugno (1984). The
setup generally diminished with further penetration. For the duration of delay between recycling the jacking unit in their offshore CPT, silt and sandy silt had the most significant setups while CPT in clayey silt had essentially no setup. McNeilan and Bugno (1984) indicated that CPT may be considered drained when the hydraulic conductivity of the surrounding soil exceeded 10-3 cm/sec. For CPT in soils under the same density and stress states, the qt value decreased as CPT became partially drained and eventually reached a stabilized value when CPT became undrained with hydraulic conductivity in the range of 10-6-10-7 cm/sec. The reason for setups is that partial drainage caused a lowered qt due to pore pressure accumulation. The 2 to 5 minute delay was long enough for the sandy silt to dissipate pore pressure and increase its strength against cone penetration or generate the setup. The same delay time was not sufficient for clayey silt to allow significant pore pressure dissipation and thus no measurable setup in the subsequent penetration. For onshore CPTU, the delay can be allowed for as long as it takes to complete a pore pressure dissipation test. In this case, the existence of setup following the dissipation test can be used to
evaluate the silty nature of the surrounding soil had the CPTU is indeed partially drained.
There has been convincing evidence indicating the significant differences in
stress-strain and strength relationships between reconstituted and undisturbed natural sand samples (Ishihara, 1993; Høeg et al., 2000). With the above background in mind, the authors conducted a series of field tests and took undisturbed samples in
7
silt/sand soil deposits at two test sites. The soil deposit to be described in the paper often contains fines well in excess of 50%. A term “silt/sand” is used as an
abbreviated method to describe soils that may be classified as silty sand or sandy silt. Parts of the laboratory test results on undisturbed soil samples have been reported earlier (Huang and Huang, 2007; Huang et al., 2008). This paper places its emphasis on field tests and their interpretations.
The objectives of this series of studies are to: (1) evaluate the necessity and rationale of the fines content adjustment in the CRR-qt1N correlations for liquefaction potential assessment of the studied soils according to experiences learned in laboratory and field tests; and (2) provide recommendations for improved liquefaction potential assessment for silt/sand soils using the CRR- qt1N correlations under the framework of simplified procedure.
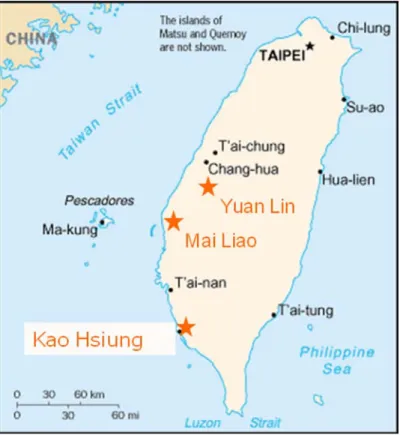
A test site was set up in Yuan Lin Township and Kao Hsiung City of Central and Southern Taiwan, respectively. Locations of these two test sites and Mai Liao are shown in Figure 2. Field tests that included various forms of CPTU and undisturbed soil sampling were conducted at the test sites. To make the paper self contained, parts of the laboratory test results published earlier will be summarized and reviewed first. Details of the field CPTU at the test sites will be described. Implications in the use of CRR-qt1N correlations for liquefaction potential assessment of silt/sand soils will then be discussed in light of the tests performed.
PHYSICAL PROPERITES OF YUAN LIN SOIL (YLS) AND KAO HSIUNG SOIL (KHS)
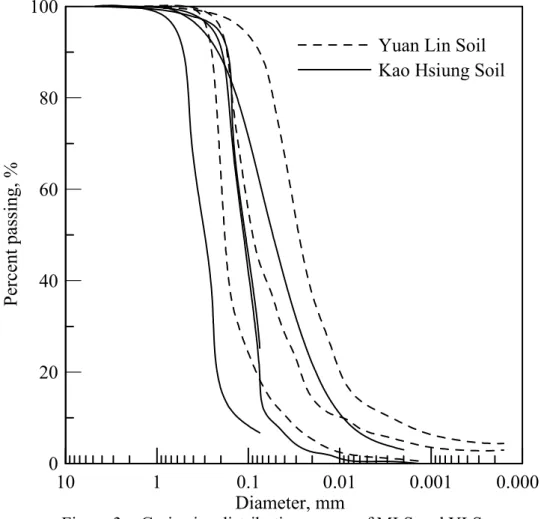
YLS and KHS are both alluvial deposits originated from the central mountain range that lies on the east side of Taiwan. Weathered sedimentary and metamorphic rocks on steep slopes were eroded by rainfall and transported by rapidly flowing streams before deposition on the west plain, to a thickness of several hundred meters. The process of transportation ground the fractured rock into sand and silt particles. Figure 3 shows the range of grain size distributions of the Yuan Lin Soil (YLS) and Kao Hsiung Soil (KHS) associated with the cyclic triaxial tests to be presented later. Mineral contents of the coarse and fine grains of these specimens are shown in Table 1. Because of the significant contents of relatively soft or crushable minerals such as
8
muscovite in YLS and slate in KHS, both soils exhibited contractive behavior in monotonic triaxial shearing, even when subjected to moderate confining stresses (Huang and Huang, 2007; Huang et al., 2008). The basic physical properties with the fines contents to be described in this paper, specific gravity (Gs), liquid and plastic
limits (L.L. and P.L.) of particles passing #200 sieve of the two types of soils are summarized in Table 2. Details on the physical and mechanical properties of MLS are referred to Huang et al. (2004).
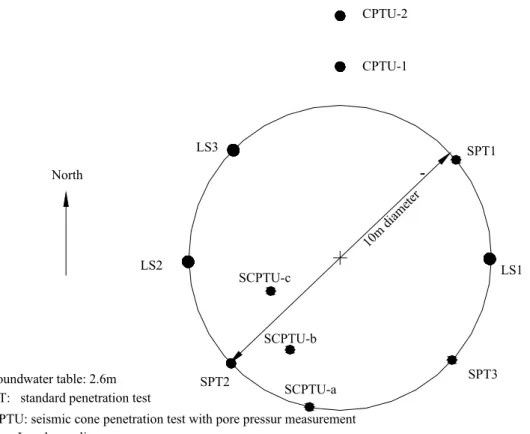
CYCLIC TRIAXIAL TESTS ON YLS AND KHS SPECIMENS
Laval samples (LS) from 3 boreholes along with a series of in situ tests were performed at the Yuan Lin test site. The distributions of sampling and in situ testing locations are shown in Figure 4. The variation of fines contents with depth was established first from physical property tests on the standard penetration test (SPT) or split spoon samples. The depths of LS were then targeted to retrieve samples with desired fines contents. Results to be presented in this paper include those of FC = 18% (depths, 10.98-11.40m), 43% (depths 3.62-4.13m) and 89% (depths 5.90-6.41m), all from borehole LS3. In order to prevent soil structure damage during transportation, the LS with FC=18% was frozen above ground after its retrieval. The soil, while remained in the sampling tube, was gradually frozen from top of the sample using dry ice, in approximately 24 hours. Bottom drainage was provided to release pore water due to volume expansion during freezing. The other Laval samples were extruded from the sampling tube in the field and sealed in wax before transportation. Details of the sampling technique are referred to Huang and Huang (2007).
Laval samples have an important advantage due to its large dimensions (200mm diameter and 500mm high). All specimens (70mm diameter and 150mm high) involved in a set of cyclic triaxial tests were trimmed from the same Laval sample and at exactly the same depth. The details of trimming and thawing LS specimens are described in Huang and Huang (2007). Because of the high compressibility, the void ratio, e after specimen consolidation in the triaxial cell was used in analyzing the test data. The soil specimen was consolidated under an isotropic effective confining stress
c
σ′ and then subjected to undrained cyclic deviator stress, σd in axial direction. Three to four cyclic triaxial tests were performed with various σd 2σc′ values.
9
CRRCTX is defined as the σd 2σc′ that produced an axial strain of 5% in double
amplitude in 20 cycles (Nc) of uniform sinusoidal load application. A load frequency
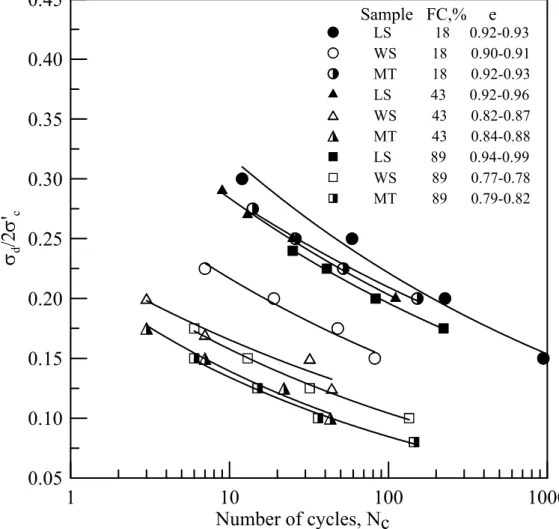
of 0.1 Hz was applied in all cyclic triaxial tests. Upon triaxial tests on undisturbed specimens, soil specimens cut from the same Laval sample (i.e., same borehole and depth) were dismantled, fully mixed and oven dried to make reconstituted specimens. The reconstituted specimens were prepared using the moist tamping (MT) and water sedimentation (WS) methods. The MT specimens were created in five equal layers. The soil was mixed under a water content, w of 8% and then placed in a 70mm inside diameter and 150mm high split mold and compacted to the desired density. Because of capillarity, there was no need to apply vacuum when removing the split mold. Figure 5 shows the results of cyclic triaxial tests on YLS with σc′ of 100kPa. For natural specimens or reconstituted specimens prepared by the same method and with similar void ratios, CRRCTX decreased with fines content. Consistent with the earlier
findings, under similar density and stress states, the undisturbed specimens showed significantly higher strength than the reconstituted specimens.
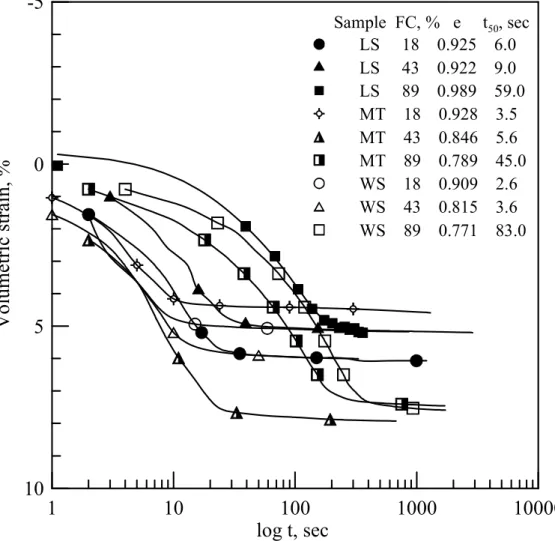
In some of the tests on YLS, the top and bottom drainage valves were opened immediately after reaching axial strain of 5% in double amplitude and cyclic loading was neutralized. The volumetric strain of the specimen during consolidation was monitored with time while σc′ of 100kPa was maintained. Figure 6 shows the representative results for the types of soil specimens and fines contents involved in the cyclic triaxial tests. The time required to reach 50% of consolidation, t50 increased
by at least one order of magnitude as FC changed from 18 to 89%. The difference in t50 among natural and reconstituted specimens was relatively insignificant.
A cost effective sampling tool referred to as the gel-push sampler was used to take high quality samples in silt/sand soils at the Kao-Hsiung test site. The gel-push sampler developed in Japan (Tani and Kaneko, 2006) is a modified version of the Osterberg piston sampler. Taking soil samples by pushing the sampling tube into sandy soil is generally difficult due to friction between the sampling tube and soil. In gel-push sampling, a lubricating gel was released to minimize that friction and facilitate
penetration of the 75mm diameter sampling tube into the soil. The soil samples were taken under its ambient temperature. The piston and a catcher that closes after penetration of the sampling tube enabled the soil sample to be retained in the tube
10
during retrieval from the borehole. The soil sample was extruded from the sampling tube just prior to triaxial tests. Details of gel-push sampling and laboratory specimen preparation procedures are referred to Huang et al. (2008). A total of 13 gel-push samples were taken at the Kao Hsiung test site at depths ranging from 5 to 25m. Due to the limited diameter of gel-push sampler, the three to four, 70mm diameter triaxial test specimens required to define a curve between cyclic resistance ratio,
c d σ
σ 2 ′ and number of cycles, Nc would have to be trimmed from different depth
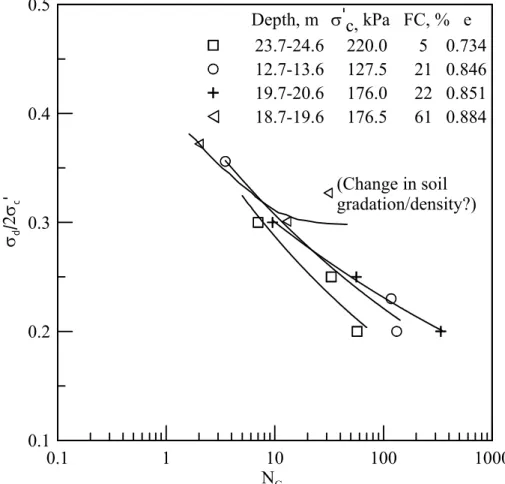
levels of the same gel-push sample. Four of the gel-push samples had sufficient lengths ranging from 860-890mm to provide the needed number of specimens and thus were chosen for cyclic triaxial tests. The specimens were isotropically consolidated under an effective confining stress, σc′ that was close to the expected fieldσv′ , prior to undrained cyclic loading. The cyclic triaxial test results are shown in Figure 7. The data points from cyclic triaxial tests on specimens taken from the same gel-push sample were more scattered than those of Laval samples shown in Figure 5. The scattering is likely related to the fact that specimens in the same
c d σ
σ 2 ′- Nc curve were taken from different depth levels. For a natural soil sample,
some variations in density and/or gradation as well as degree of disturbance at different depth levels of the sampling tube are inevitable.
CPTU TESTS AT THE YUAN LIN AND KAO HSIUNG TEST SITES
Considering the importance in detecting the drainage conditions during cone
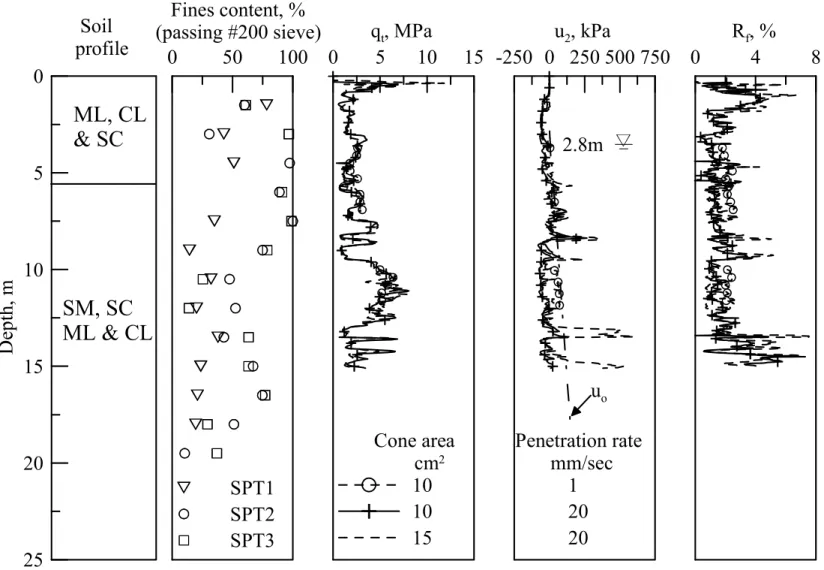
penetration in a silty sand or sandy silt deposit, attempts were made in the field tests to ascertain the drainage conditions associated with CPTU. A series of CPTU using a standard cone (cone cross sectional area=10cm2) penetrating at 20mm/sec (the standard CPTU), a large cone (cone cross sectional area=15cm2) penetrating at 20mm/sec (the large CPTU), and a standard cone penetrating at 1mm/sec (the slow CPTU) were conducted at the Yuan Lin test site. The pore pressure element was located immediately behind the cone face, at the u2 position. Profiles of fines contents
according to SPT specimens, CTPU results that include friction ratio, Rf (=fs/qt x100%) from tests at Yuan Lin site are shown in Figure 8. The results indicated no
11
differences in cone size and/or penetration rate. Because of the time consuming nature, slow CPTU was conducted only in depth levels where Laval samples were taken. The u2 values from large CPTU were mostly identical to those from the standard CPTU.
The u2 in slow CPTU matched well with the hydrostatic pressure uo, indicating that
1mm/sec was slow enough to allow the penetration induced pore pressure to fully dissipate and reach equilibrium in most part with the surrounding hydrostatic pressure. The Rf values from slow CPTU were consistently higher than those of standard and large CPTU. No consistent correlation between the increase in Rf and soil fines contents could be identified. During CPTU, the soil element ahead of the cone tip experiences an increase in mean normal stress as the cone tip approaches. This increased stress is released as the soil element passes the base of the cone face and thus a reduction in lateral stress against the friction sleeve immediately behind the cone tip. In a slow CPTU, more time is allowed for the soil element to creep
towards the friction sleeve and develop higher lateral stress against the friction sleeve and thus higher fs. This creeping is believed to be the main cause of the increase in
fs or Rf when cone penetration rate was reduced from 20 to 1 mm/sec as the change in penetration rate did not have significant effects on qt. Profiles of fines contents according to gel-push samples and results from standard and slow CPTU performed at Kao Hsiung site are shown in Figure 9. The slow CPTU was conducted from 9.8 to 25m, the same depth range where gel-push samples were taken at Kao Hsiung site. The results in terms of qt, u2 and Rf and their relationship with penetration rates are very similar to those from Yuan Lin site. No significant differences in qt and u2 were noticed from CPTU with a 20 times difference in penetration rate.
At Yuan Lin site, the standard CPTU was coupled with pore pressure dissipation tests from 3.5 to 12.5m, at 1m intervals. The same was included in the standard CPTU at Kao Hsiung site from 9.8 to 20.8m. In a pore pressure dissipation test, the cone penetration was suspended while u2 was continuously recorded until it reached
equilibrium with uo. Figures 10 and 11 compare parts of the qt, fs profiles obtained from the field CPTU at two test sites and those from CPTU in reconstituted MLS specimens in a calibration chamber. The field data are the enlarged segments of the corresponding profiles included in Figures 8 and 9. This enlargement allows the change in qt and fs and its relationship with pore pressure dissipation tests to be
12
MT method where the sand and fines were fully mixed. The MLS specimen was saturated under a back pressure of 300kPa during CPTU calibration test. A pore pressure dissipation test was conducted in MLS at 0.3-0.4m depth in the calibration chamber. For CPTU in MLS, there were distinct setups as referred to by McNeilan and Bugno (1984) or significant increase in qt and fs immediately following the pore pressure dissipation test or the start of the subsequent push. For the field CPTU where the fines contents could exceed 50%, the pore pressure dissipation tests were basically evidenced by a sharp decrease (due to suspension of the cone penetration) and regain of qt and fs values as penetration resumed, without significant setups. Figure 12 compares the t50 values among the field and laboratory CPTU and their
relationships with fines contents. The t50 was defined as the time required for u2 to
change from its initial value immediately upon penetration suspension to gain 50% of its full range of variation until a plateau in u2 was reached. For laboratory CPTU in
MLS, t50 increased significantly as fines content changed from 0 to 50%. No clear
trend between t50 and fines contents could be identified from field tests, even where
the fines contents reached as high as 89%.
The laboratory results on MLS presented above indicate that at fines contents above 30%, CPTU behaved as a partially drained test. The effects of partial drainage were demonstrated by the presence of significant setups following a pore pressure
dissipation test and clear trend between fines contents and t50 as shown in Figure 12.
The field CPTU at both test sites were close to drained conditions even when the fines contents reached as high as 89%. The drastic differences in the effects of fines contents on t50 between CPTU in laboratory prepared, well mixed silty sand and
natural silt/sand in the field are likely due to the heterogeneity existed in natural soil. Figure 13 demonstrates two specimens trimmed from Laval samples. In Specimen A, a clean sand pocket was embedded in a matrix of silt. The sand and silt particles with different colors were randomly layered in Specimen B. The overall fines content of Specimens A and B were 89 and 43%, respectively. It is believed that the presence of closely spaced free draining sand layers made the field CPTU behave as a drained test in a silty soil mass, thus resulted in low t50 even when the overall fines
13
IMPLICATIONS IN LIQUEFACTION POTENTIAL ASSESSMENT
Figure 14 plots the correlation between CRR and qt1N for MLS according to
laboratory cyclic triaxial tests and CPTU performed in a calibration chamber, reported by Huang et al. (2005). The inference of CRR under anisotropic stress conditions from isotropically consolidated cyclic triaxial tests (CRRCTX) followed the procedure by Ishihara (1996) as, 3 2 1 K CRR CRR= CTX + (7) where
K = ratio of effective horizontal stress, over
Results from tests on MLS strongly suggest that the fines content affects the CRR-qt1N correlation mainly through its influence on the drainage conditions during CPTU (Huang et al., 2005). For tests in MLS with fines content, FC = 0 and 15%, CPTU was essentially drained. For drained CPTU in MLS, the CRR-qt1N correlations consistently fell to the left of those proposed by Stark and Olson (1995) and Robertson and Wride (1998) for clean sand.
The above described tests in YLS and KHS offered a database to evaluate the CRR-qt1N correlations based on tests that involved natural soil samples. The soil deposits at Yuan Lin and Kao Hsiung test sites were assumed to be normally
consolidated with K = 0.5 in the field. The field CRR values under the assumed K value were inferred from CRRCTX obtained from isotropically consolidated cyclic
triaxial tests, using Equation 2. For YLS, the CRRCTX conducted under σc′ of
100kPa on LS specimens, as included in Figure 5 were used. For KHS, the CRRCTX
obtained from cyclic triaxial tests on gel-push specimens shown in Figure 7 were used to infer CRR using Equation 7. The average value of qt from comparable depths where the undisturbed samples were taken was normalized using Equation 2 to obtain the corresponding qt1N.
The CRR-qt1N data points obtained from field CPT and laboratory tests on natural samples were included in Figure 14. The CRR-qt1N correlations proposed by Stark and Olson (1995) for clean sand (FC≤ 5%), silty sand (5<FC<35%) and sandy silt (FC≥ 35%) are included in Figure 14 for reference. These three CRR-qt1N
14
correlation curves are practically identical to those suggested by Robertson and Wride (1998) respectively for Ic =1.64 (clean sand), 2.1 (FC= 15%) and 2.6 (FC=35%).
The corresponding FC values included in the parenthesis are determined based on Ic
and the Ic-FC correlation shown in Figure 1. The above published correlations for
silty sand and sandy silt were chosen because they cover or at least overlap with the range of fines contents of the soils reported herein.
The CRR-qt1N data points and those from laboratory tests on reconstituted MLS specimens have the following characteristics:
1. All data points fell to the left of the CRR-qt1N correlation that corresponded to silty sand according to Stark and Olson (1995), or to the case of Ic=2.1 according
to Robertson and Wride (1998).
2. For the wide range of fines contents involved in the field and laboratory tests on YLS and KHS, there was a general trend that the CRR-qt1N data points moved to the left as fines content increased. This trend was consistent with those
suggested in the available CRR-qt1N correlations shown in Figure 14. 3. The effects of fines according to tests in natural YLS and KHS were less
significant than those suggested by tests using the artificial MLS specimens. At much wider range of fines contents, the lateral spread of CRR-qt1N data points based on tests in YLS and KHS shown in Figure 14 was less than those from tests using the reconstituted MLS specimens or suggested by the available CRR-qt1N correlations.
Based on the findings described in the paper, the following explanations for the reasons in adjusting CRR-qt1N correlations due to fines contents and their implications in liquefaction potential assessment are postulated:
The fines content adjustment reflects two aspects in the CRR-qt1N correlations; the first aspect deals with the differences in mineral contents and/or grain characteristics between sand and fines; and the second aspect deals with the change in drainage conditions in CPTU resulted from the increase in fines contents. Ishihara and Harada (2008) demonstrated the differences in CRR-qt1N correlations among clean sands due to variations in mineral contents and/or grain shapes. The data presented in this paper have shown that the field CPTU conducted in YLS and KHS can all be considered as drained tests, regardless of the fines contents. Except for those of FC = 61 and 89%, the CRR-qt1N data points from YLS and KHS clustered closely with
15
those from MLS with FC 15% where CPTU was also drained. The fines in a silt/sand mixture are more likely to have higher contents of softer minerals as indicated in Table 1 and Huang et al. (2004). MLS, YLS and KHS have similar geological origin and contain relatively soft sand grains as demonstrated in their mineral contents. These similarities explain why the available CRR-qt1N data points from MLS, YLS and KHS gathered in a rather narrow range, except for the cases where FC exceeded 50%, and as long as the CPTU remained drained. Provided the CPTU remained drained, the soft minerals or their higher contents cause the CRR-qt1N correlations to move to the left. This is likely the reason for the CRR-qt1N data points with FC in excess of 50% to locate to the left and away from the cluster of all the CRR-qt1N data points from drained CPTU and with less fines contents.
The data presented by Amini and Qi (2001) have demonstrated that the stratification in silty sand does not have significant effects on the cyclic strength. The data presented herein however, demonstrated that the stratification in silt/sand soil can have significant impact on the drainage conditions of CPTU. The lack of free drainage would cause qt to be much reduced and thus the CRR-qt1N correlations to move to the left.
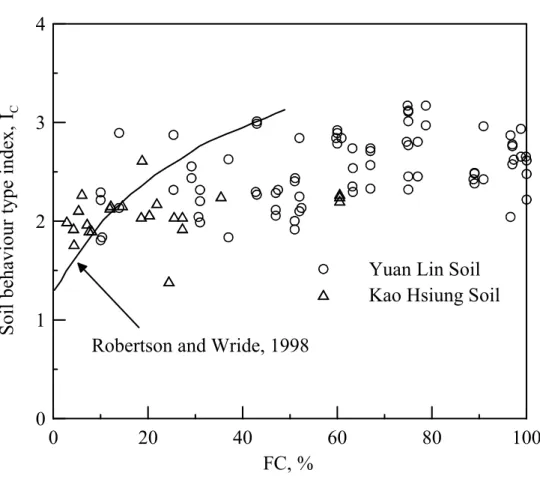
The available soil behaviour index, IC values and their relationship with fines contents
from all field CPTU at Yuan Lin and Kao Hsiung sites are plotted in Figure 1 along with the general IC-FC correlation proposed by Robertson and Wride (1998). The
results show that the available data are rather scattered and have IC mostly in the range
of from 1.8 to 3.0. This trend does not seem to follow the empirical IC-FC
correlation as proposed by Robertson and Wride (1998) which was restricted for FC<50%. For soils at Yuan Lin and Kao Hsiung sites, the inference of fines content based on IC may lead to significant and/or unpredictable error.
CONCLUDING REMARKS
The laboratory tests on undisturbed soil specimens coupled with field CPTU offered an explanation for the possible reasons of fines content adjustment in the use of CRR-qt1N correlations for liquefaction potential assessment. The mixture of fines with sand can make the fines content adjustment complicated in many ways. The potential differences in mineral contents and/or grain shapes between fines and sand
16
particles are important aspects that cause the shifting of CRR-qt1N correlations. The characteristics and magnitude of such shifting are apparently soil and site dependent. Local calibrations would be highly desirable to establish a fines content adjustment scheme to account for the effects of mineral contents and/or grain shapes between fines and sand particles.
The potential effect on drainage conditions in CPTU caused by the increase of fines content is another important aspect to be considered in fines content adjustment. Significant adjustment in the CRR-qt1N correlation is called for if the fines contents are sufficient enough to cause the CPTU to be partially drained and thus qt substantially reduced. In alluvial deposit where the silt/sand soils are often stratified, the CPTU can be a drained test even with substantial fines contents due to the presence of closely spaced free draining soil layers. While the stratification may not cause significant differences in cyclic strength of the silt/sand soil, its impact on cone tip resistance because of the change in drainage conditions is not negligible. Experience gained in field tests indicated that the drainage conditions in CPTU can be determined using pore pressure dissipation tests or by changing the rate of penetration. Had the drainage conditions remained the same, the amount of fines content adjustment should be associated with and limited to the effects caused by differences in mineral contents and/or grain shapes between fines and sand. The fines content adjustment based on available empirical soil classification schemes that relate the CPTU results to fines contents may lead to unpredictable errors in liquefaction potential assessment due to a lack of consistent correlation between the fines content and these classification
schemes. The ignorance of free draining nature of CPTU in stratified alluvial silt/sand soils may lead to excessive fines content adjustment and result in over estimation of safety factor against soil liquefaction.
ACKNOWLEDGEMENTS
The research was funded by the National Science Council of Taiwan, ROC under contracts 96-2221-E-009-005, 95-2221-E-009-202 and 94-2211-E-009-043. The authors would like to extend their gratitude to Prof. K. Ishihara of Chuo University, Tokyo, Japan, for his review and constructive comments on the manuscript.
17
REFERENCES
Amini, F., and Qi, G. Z., 2000, “Liquefaction Testing of Stratified Silty Sands,” Journal of Geotechnical and Geoenvironmental Engineering, Vol. 126, No. 3, pp.208-217.
Campanella, R.G., Robertson, P.K. and Gillespie, D., 1981, "In-Situ Testing in Saturated Silt (Drained or Undrained?)", 34th Canadian Geotechnical Conference, Fredericton, New Brunswick (also U.B.C. Soil Mechanics Series No. 49).
Campanella, R.G., and Robertson, P.K., 1988, “Current status of the piezocone test,” Proceedings, Penetration Testing, De Ruiter Balkema, Rotterdam, ISOPT-I, Orlando, Florida. Edited by De Ruiter, Balkema, Rotterdam, Vol. 1., pp.93-116.
Høeg, K., Dyvik, R., and Sandbaekken, G., 2000, “Strength of Undisturbed versus Reconstituted Silt and Silty Sand Specimens,” Journal of Geotechnical and
Geoenvironmental Engineering, ASCE, Vol.126, No.7, pp.606-617.
Huang, A.B., Hsu, H.H., Chang, J.W., 1999. “The Behavior of a Compressible Silty Fine Sand,” Canadian Geotechnical Journal, Vol.36, No.1, pp.88-101.
Huang, Y.T, Huang, A.B., Kuo, Y.C., and Tsai, M.D., 2004, “A laboratory Study on the Undrained Strength of a Silty Sand from Central Western Taiwan,” Soil Dynamics and Earthquake Engineering, Vol.24, No.9-10, pp.733-743.
Huang, A.B., Huang, Y.T., and Ho, F.J., 2005, “Assessment of Liquefaction Potential for a Silty Sand in Central Western Taiwan,” Proceedings, XVIth International Conference on Soil Mechanics and Geotechnical Engineering, Osaka, Japan, pp.2653-2657.
Huang, A.B., and Huang, Y.T., 2007, “Undisturbed Sampling and Laboratory Shearing Tests on a Sand with Various Fines Contents,” Soils and Foundations, Vol.47, No.4, pp.771-781.
18
Huang, A.B., Tai, Y.Y., Lee, W.F., and Ishihara, K., 2008, “Sampling and Field Characterization of the Silty Sand in Central and Southern Taiwan,” Proceedings, The 3rd International Conference on Site Characterization, Taipei, pp.1457-1463.
Ishihara, K., 1993, “Liquefaction and flow failure during earthquakes,” Geotechnique, Vol.43, No.3, pp.351-415.
Ishihara, K., 1996, “Soil behavior in earthquake geotechnics,” Clarendon Press, Oxford, UK, 350p.
Ishihara, K., and Harada, K., 2008, “Effects of Lateral Stress on Relations between Penetration Resistances and Cyclic Strength to Liquefaction,” Proceedings, The 3rd International Conference on Site Characterization, Taipei, pp.1043-1050.
Lade, P.V., Liggio, C.D., and Yamamuro, J.A., 1998, “Effects of nonplastic fines on minimum and maximum void ratios of sand,” ASTM Geotechnical Testing Journal, Vol.21, No.4, pp.336-347.
McNeilan, T.W., and Bugno, W.T., 1984, “Cone Penetration Test Results in Offshore California Silts.” Proceedings of the Symposium on Strength Testing of Marine Sediments: Laboratory and In-Situ Measurements, San Diego, ASTM STP 883, pp. 55-71.
Olsen, R.S., 1994, “Normalization and Prediction of Geotechnical Properties using the Cone Penetrometer Test (CPT),” Ph.D. dissertation, University of California,
Berkeley.
Polito, C.P., 1999, “The Effects of Nonplastic and Plastic Fines on the Liquefaction of Sandy Soils,” Ph.D. Thesis, Virginia Polytechnic Institute and State University, Blacksburg, Virginia.
19
Robertson, P.K., Sully, J.O., Woeller, D.J., Lunne, T., Powell, J.J.M., and Gillespie, 1992, “Estimating Coefficient of Consolidation from Piezocone Tests,” Canadian Geotechnical Journal, Vol.29, pp.539-550.
Robertson, P.K., and Wride, C.E., 1998, “Evaluating Cyclic Liquefaction Potential Using the Cone Penetration Test,” Canadian Geotechnical Journal, Vol.35, pp.442-459. Robertson, P.K., 2004, “Evaluating soil liquefaction and post-earthquake deformations using the CPT,” Geotechnical & Geophysical Site Characterization, Vol. 1 (Proc. ISC-2, Porto), Millpress, Rotterdam, pp.233-249.
Salgado, R., Bandini, P., and Karim, A., 2000, “Shear strength and stiffness of silty sand,” Journal of Geotechnical and Geoenvironmental Engineering, ASCE, Vol. 126, No.5, pp.451-462.
Stark, T.D., and Olson, S.M., 1995, “Liquefaction Resistance Using CPT and Field Case Histories.” Journal of Geotechnical Engineering Division, ASCE, Vol.121, No.12, pp. 856-869.
Tani, K., and Kaneko, S., 2006, "Method of Recovering Undisturbed Samples using Water-Soluble Thick Polymer," (in Japanese) Tsuchi-to-Kiso, Journal of Japanese Geotechnical Society, Vol. 54, No. 4, pp. 145-148.
Thevanayagam, S., Shenthan, T., Mohan, S., and Liang, J., 2002, “Undrained fragility of clean sands, silty sands, and sandy silts,” Journal of Geotechnical and
Geoenvironmental Engineering, ASCE, Vol. 128, No.10, pp.849-859.
Yamamuro, J.A., and Wood, F.M., 2004, “Effect of depositional method on the undrained behavior and microstructure of sand with silt,” Soil Dynamics and Earthquake Engineering, Vol.24, No.9-10, pp.751-760.
Youd, T.L., Idriss, I.M., Andrus, R.D., Arango, I., Castro, G., Christian, J.T., Dobry, R., Liam Finn, W.D., Harder Jr., L.F., Hynes, M.E., Ishihara, K., Koester, J.P., Liao, S.S.C.,
20
Marcuson III, W.F., Martin, G.R., Mitchell, J.K., Moriwaki, Y., Power, M.S., Robertson, P.K., Seed, R.B., and Stokoe II, K.H., 2001, “Liquefaction Resistance of Soils: Summary Report from the 1996 NCEER and 1998 NCEER/NSF Workshops on Evaluation of Liquefaction Resistance of Soils,” Journal of Geotechnical and
21
Table 1. Mineral contents of YLS and KHS Yuan Lin Soil (YLS)
Mineral Quartz Clinochlore Muscovite Feldspar Coarse,% 62-70 13-16 12-14 3-8
Mineral Muscovite Clinochlore Quartz Feldspar Fines,% 39-51 28-38 12-28 1-4
Kao Hsiung Soil (KHS)
Mineral Slate Quartz Siltstone Sandstone
Coarse,% 61-84 1-28 6-20 0-3
Mineral Illite Clinochlore Quartz Feldspar
22
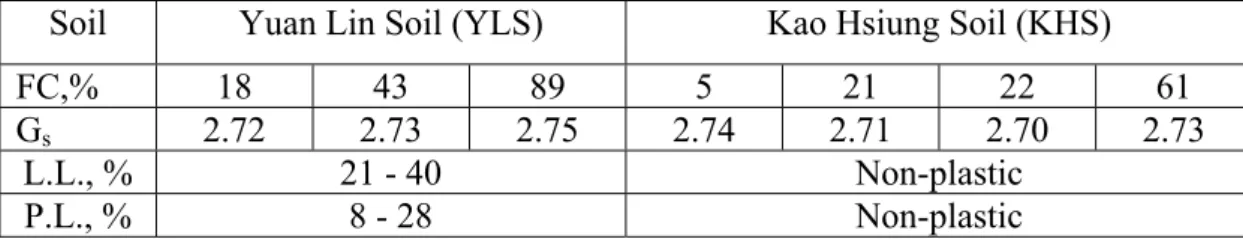
Table 2. Physical properties of YLS and KHS.
Soil Yuan Lin Soil (YLS) Kao Hsiung Soil (KHS)
FC,% 18 43 89 5 21 22 61
Gs 2.72 2.73 2.75 2.74 2.71 2.70 2.73
L.L., % 21 - 40 Non-plastic
23 0 20 40 60 80 100 FC, % 0 1 2 3 4 Soil behaviou r type inde x, IC
Yuan Lin Soil Kao Hsiung Soil Robertson and Wride, 1998
24
25 10 1 0.1 0.01 0.001 0.0001 Diameter, mm 0 20 40 60 80 100 Pe rcen t passing, %
Yuan Lin Soil Kao Hsiung Soil
26 SCPTU-a SCPTU-b SCPTU-c LS2 LS1 LS3 SPT3 SPT2 SPT1 Groundwater table: 2.6m North LS: Laval sampling
SCPTU: seismic cone penetration test with pore pressur measurement SPT: standard penetration test
10m
diame
ter
CPTU-1 CPTU-2
27 1 10 100 1000 Number of cycles, Nc 0.05 0.10 0.15 0.20 0.25 0.30 0.35 0.40 0.45 σd /2 σ'c Sample FC,% e LS 18 0.92-0.93 WS 18 0.90-0.91 MT 18 0.92-0.93 LS 43 0.92-0.96 WS 43 0.82-0.87 MT 43 0.84-0.88 LS 89 0.94-0.99 WS 89 0.77-0.78 MT 89 0.79-0.82
28
1
10
100
1000
10000
log t, sec
10
5
0
-5
Volumet
ric
st
rain,
%
Sample FC, % e t50, sec LS 18 0.925 6.0 LS 43 0.922 9.0 LS 89 0.989 59.0 MT 18 0.928 3.5 MT 43 0.846 5.6 MT 89 0.789 45.0 WS 18 0.909 2.6 WS 43 0.815 3.6 WS 89 0.771 83.029 0.1 1 10 100 1000 NC 0.1 0.2 0.3 0.4 0.5 σd /2 σc ' Depth, m σ'c, kPa FC, % e 23.7-24.6 220.0 5 0.734 12.7-13.6 127.5 21 0.846 19.7-20.6 176.0 22 0.851 18.7-19.6 176.5 61 0.884 (Change in soil gradation/density?)
Figure 7. Cyclic triaxial test results of KHS specimens recovered by the gel-push sampler.
30
Soil
profile
25
20
15
10
5
0
Dept
h,
m
0
50
100
Fines content, %
(passing #200 sieve)
0
5
10
15
q
t, MPa
-250 0 250 500 750
u
2, kPa
Cone area Penetration rate
cm
2mm/sec
10 1
10 20
15 20
SPT1
SPT2
SPT3
0
4
8
R
f, %
ML, CL
& SC
SM, SC
ML & CL
u
o3
2.8m
31 0 25 50 75 FC, % 0 5 10 15 qt, MPa -250 0 250 500 750 u2, kPa Penetration rate mm/sec 1 20 0 4 8 Rf, % 0.8m Soil profile 25 20 15 10 5 0 Dep th, m SM, ML CL SM, CL CL uo
32 0 1 2 3 4 7 6 5 4 3 De pth , m 0 2 4 6 qt, MPa 22 21 20 19 18 0 1 2 3 4 0.8 0.6 0.4 0.2 0
Yuan Lin Soil
FC=30% FC=50% Kao Hsiung Soil
e=0.64-0.65 K=1
σ'v=100kPa
Mai Liao Sand Figure 10. qt profiles with CPT dissipation tests.
33 0 25 50 7 6 5 4 3 Depth, m 0 25 50 fs, kPa 22 21 20 19 18 0 25 50 0.8 0.6 0.4 0.2 0
Yuan Lin Soil
FC=30% FC=50% Kao Hsiung Soil
e=0.64-0.65 K=1
σ'v=100kPa
Mai Liao Sand
34
0
20
40
60
80
100
FC, %
0
100
200
300
400
t
50, s
ec
Yuan Lin Soil
Kao Hsiung Soil
Mai Liao Sand
35
FC = 89% (Specimen A) FC = 43% (Specimen B) Figure 13. Triaxial specimens trimmed from LS.
36 0 100 200 300 qt1N 0 0.2 0.4 0.6 Cy cl ic S tre ss or Re si stance Rati o, CS R or CRR MLS FC,% K 0 0.5 15 0.5 30 0.5 0 1 15 1 30 1 KHS FC,% K 5 0.5 21 0.5 22 0.5 61 0.5 YLS FC,% K 18 0.5 43 0.5 89 0.5 or
(Stark and Olson, 1995) Sandy Silt Silty Sand (Robertson and Wride, 1998) IC = 2.6 IC = 2.1 FC=35% FC=15%
clean sand