DOI 10.1007/s00542-014-2133-8 TechnIcal PaPer
A new LCL‑lens array with electrodes of interlaced structure
to be applied for auto‑stereoscopic 3D displays
Yung‑Yuan Kao · Paul C.‑P. Chao · Tse‑Yi Tu
received: 30 October 2013 / accepted: 8 March 2014 / Published online: 31 March 2014 © Springer-Verlag Berlin heidelberg 2014
movability of eyes position with constant view distance and functionality of multi-viewer. Besides, it can be easily manufactured with low cost. Owing to these advantages, some studies about lenticular lens sheets have been pro-posed. Berkel et al. (1996) have proposed some research works about the method of using lenticular lens sheets on multi-view auto-stereoscopic displays, and he has also pro-posed that slanted lenticular lens sheets or pixels could rec-tify the negative effects of flipped images by imposing gaps between lens and pixel (Berkel and clarke 1997; Berkel 1999, 2000). later research works were dedicated to reduce the so-called corsstalk, a common problem of a 3D auto-stereoscopic display, which is caused by the interference between the images on right and left eyes. Solutions were proposed to ease the problem, such as the active shutter glasses (ra et al. 2011), dynamic backlight unit (liou et al. 2011) and the unit 3D optical line (Kim and Yoon 2013). Most recently, the technology of the 3D auto-stereoscopic display is applied to mobile devices (lee et al. 2012). To this end, 2D/3D switchable displays is first realized by a method of dual-lenticular lens sheets (Takanashi et al. 2004). Moreover, the method of using solid lenticular lens sheets has been proposed to be replaced by liquid crystal lenticular (lcl) lens array sheet (hong et al. 2008, 2009; huang et al. 2009) in order to control viewer distance based on a function of tunable focal length provided by the lcl lens array. For the method, some critical issues of lcl lens array should be resolved, like non-smooth refractive index distributions and often-required high voltage drives (chiu et al. 2008; ren et al. 2007; Kao et al. 2010).
To remedy the aforementioned issues of the lcl lens, this study proposes a new e liquid crystal lenticular lens array with interlaced electrodes to realize an auto-stereo-scopic 3D display. The proposed lcl module owns merits of much smoother index distributions to mimic a perfect Abstract a new design of the liquid crystal lenticular
(lcl) lens array with interlaced electrodes is proposed to realize an auto-stereoscopic 3D display. The structure of interlaced electrodes aims to generate a desired non-uni-form electric filed to improve the focusing ability of the lcl-lens array with lower voltage drives. This paper is organized as first to describe the design criteria of a lenticu-lar lens sheet for wide extended graphics array lcD panel. Based on the designed lenticular lens array, an lcl-lens array with proposed interlaced electrodes is next designed. The fabrication and the detailed structure are given. a series of experiments are then conducted and success-fully verify the focusing capability and desired 3D display functions, that is, to separate two images to right and left eyes. also, the developed auto-stereoscopic 3D display is able to adapt to varied viewer locations with favorable imaging quality.
1 Introduction
commercial auto-stereoscopic display systems have recently been equipped optical lenticular lens sheets in order to realize the function which is able to support two images or views to right and left eyes of viewers. In appli-cations of auto-stereoscopic display, the method of using the lenticular lens sheet, also called time- or spatial-mul-tiplexed method, is first proposed as a patent by Ichinose (Ichinose 1989). The method has advantages in displaying 3D images, which includes high luminous performance,
Y.-Y. Kao · P. c.-P. chao (*) · T.-Y. Tu Department of electrical engineering,
national chiao Tung University, hsinchu, Taiwan e-mail: [email protected]
lens, lower drive voltages and capable of adapting to varied viewer locations with favorable imaging quality. The paper is organized as follows. Section 2 describes the design prin-ciples. Section 3 elaborates the fabrication process. Sec-tion 4 is on experimental validaSec-tion.
2 Design principles
The design procedure is stated in the following two sec-tors. Section 1 states the design of the lenticular lens sheet for the chosen WXGa lcD panel. The viewing distance which is from viewers to display panel should be first defined by designer. Section 2 presents the proposed design of the lcl-lens with interlaced electrodes to improve the focusing ability. The required parameters of the lcD panel are resolution and pixel size, which are able to be used to calculate the focal length, f, of the lenticular lens sheet with respect to the desired viewer distance. note that the lcl-lens array is desired to mimic the refractive index distribu-tion of a perfect solid lenticular lens sheet.
2.1 Design of the lenticular lens sheet
The function of the lenticular lens sheet is to create an image pair and force two eyes of the viewer to be received with the separately different image (Berkel et al. 1996). The design of the lenticular lens sheet which covers two sub-pixels is proposed in this study as shown in Fig. 1. In this design, the sub-pixel pitch is set as 258.75 μm, which is one of WXGa screen specifications as listed in Table 1, while the lens pitch is 517.5 μm. This study aims to design a 2.8 inch small-sized two-view auto-stereoscopic display system (W56.93 × h42.70 mm). The lens numbers in this the lenticular lens array module is 110. Figure 2 shows the relative positions of two human eyes, a lenticular lens sheet and pixel pairs. according to the statistical information, the pupillary distance (DP) for adults varies from 50 to 70 mm,
while the mean value is around 65 mm. In addition, the viewing distance is defined as the distance between viewers and the panel of the 3D display system for the viewer to be received with 3D image, which is setting as 400 mm for the 2.8 inch panel. Two eyes should receive the rays from dif-ferent pixels. It means that the left and right eyes receive left and right image, respectively. When the viewer moves hori-zontally in view zone, it should be ensured that left and right eyes receive well their corresponding images. In this study, the horizontal moving range of view zone is considered as.
where WS is the width of the panel, 56.925 mm; DM is designed as 4.0375 mm for this study to ensure all pixel pairs and the lenticular lens sheet are located between two eyes. The range of incident ray angle, θ, for the right eye can be obtained as
where θmax can be derived as
then θmax can be calculated to be 9.23°.
(1) DM= DP−WS 2 , (2) 0◦< θ < θmax, (3) θmax=tan−1 DP DV ,
Fig. 1 configuration of a module of the lenticular lens sheet and
associated pixel elements
Table 1 WXGa screen specification
Items Unit Specifications
Screen diagonal inch 15.4
active area mm2 207.0 × 331.2
number of sub-pixels dot 1,280(W) × 3(rGB) × 800(h)
Pixel pitch μm 258.75
Sub-pixel pitch μm 86.25
Fig. 2 configuration of the two eyes and the auto-stereoscopic
In order to receive the image of right eye, all rays which are emitted by right pixels are received by right-eye from display passing through the lenticular lens sheet. Moreo-ver, the analysis on the rays can be conducted in a way that the light emits from right eye due to reversible property of light. On the other hand, all rays emitting from right eye can be focused at all of the right pixels to achieve image separation. The focal position is varied for different inci-dent ray angels of the lenticular lens sheet. however, the quality of the image separation could be decreased if the focal length is not short enough to change the light direc-tion on the correct pixel even though the eye is still in the moving range, DM, due to the fact that the focal position
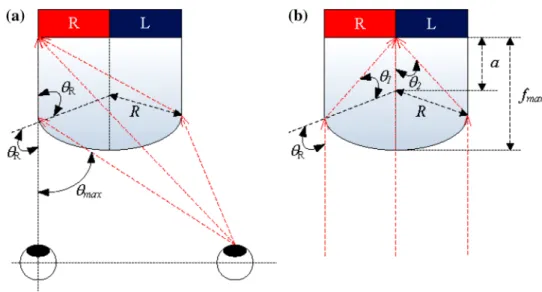
is out of boundary of the available pixels. In Fig. 3a, the boundary condition for this design is defined as the maxi-mum focal length, fmax, which is able to force the rays to focus on the boundary of the most left pixel when the right eye is located at the most right position on moving range. The ray tracing between the right eye and the most left pixel pair is able to be simulated by trigonometric functions and Snell’s law such that the radius and focal length of the lens unit can be derived as below. The most left ray and the trigonometric relationship as shown in Fig. 3a, are con-sidered for analysis. R is the radius of the lens unit. If the direction of ray can be changed to the position on the right pixel, the function can be represented as
where n0 is the refractive index of air. θr can be written as
and then the radius R can be obtained as
(4) n0sin(θmax+θR) = n sin θR,
(5) θR=sin−1( PP R ), (6) R PP ·cos sin−1 PP R = n − cos θmax sin θmax .
The refractive index of the lens is assumed as 1.54 which is the index number for glass. Figure 3b shows the trigo-nometric relationship in focusing rays tracing of vertically incident rays between a unit of lenticular lens sheet module and a pixel pair. In this figure, the rays focus to center of the pixel pair. Based on Fig. 3b, one can derive
and
Finally, the desired relationship between the radius and focal length of the lens unit is
With eq. (10) in hands, the design criteria of radius and focal length for the lenticular lens sheet are successfully established for the 2.8 inch WXGa lcD panel. The radius and the focal length are designed as 0.935 and 2.61 mm, respectively. The resulted optical performance of the lc lens unit to be installed in a lcl module can be guaranteed based on the above calculations.
2.2 Design of the lcl-lens array
a gradient index (GrIn) lens owns the refractive index distributed in a particular gradient manner along the radial direction of the lens (Yeh et al. 1999) such that the lens acts as a perfect solid converging/diverging lens. With available technologies of liquid crystal lenses to realize GrIn lens, typical focusing and/or zooming modules can be designed (7) sin θR=n sin θ1, (8) θR=θ1+θ2, (9) R sin θ2 = a sin θ1 . (10) fmax = R + PP n · sin sin−1 PP R −sin−1 PP n·R .
Fig. 3 Trigonometric relation
in ray tracing between a unit of lenticular lens sheet module and a pixel pair. a Oblique incidence at the boundary condition, b normal incidence
and assembled successfully without lenses moving along the optical axes of the modules (lueder et al. 2001), thus significantly reduce the overall size of the lens module. Based on this basic principles of GrIn lens, the liquid crystal lenticular lens array is proposed in this study. It is designed to own the pre-designed index distribution along the radial direction of the lc lens as
where r and nG,max are the radius of the GrIn lens and the associated maximum refractive index, respectively. In addition, the lens thickness is denoted as dG, while fG is the resulted focal length. The index change along the radial (cross-width) direction of the lcl-lens also needs (11) nG(r) = nG,max−
r2
2dGfG ,
to follow eq. (11). Based on this equation, with appropri-ate designs of index distribution dG, nG(r) and nG,max, a
desired focal length of the lcl-lens flcl can be achieved, yielding
where the subscript lcl denotes liquid crystal lenticu-lar, dlcl is the thickness of its lc layer and w denotes the
width of the lcl-lens. note from eq. (12), the focal length of the lcl-lens is proportional to the square of (1/2)w and in an inverse proportion to the lens thickness and the dif-ference between nlcl,max and nlcl(w). The liquid crystals
adopted for the lcl lens is the e7 by Merck Inc.
(12) fLCL= 1 /2w 2 2dLCL nLCL,max−nLCL(w) ,
Fig. 4 Four types of electrode
layouts of the lcl-lens: a par-allel and b interlaced electrode layouts with parallel-to-elec-trode stripes rubbing, c parallel and d interlaced electrode lay-outs with vertical-to-electrode stripes rubbing
Fig. 5 Director distribution of lc molecules in the lc lenticular lens: a parallel electrode layout with vertical rubbing, b interlaced electrode
The lcl-lens array used in auto-stereoscopic displays could be realized based on the design of the lenticular lens sheet stated in Sect. 1. The previous design achieves the short focal length of 2.61 mm for the lenticular lens sheet and the cell gap of the lcl lens array as 100 μm. In addition, there are four different combinations of elec-trode pattern design and rubbing direction, with which the perfect distributions of refractive index as shown in Fig. 4 can be realized. Two of four designs for parallel electrode pattern are shown in Fig. 4a, c, which are rubbed with two directions, parallel and vertical, respectively. The parallel rubbing means that the direction of rubbing is paralleled to the striped electrodes. For the other two as shown in Fig. 4b, c, the configurations of the electrode are designed to be interlaced structures, both of which are also rubbed to parallel and vertical directions, respectively. The related lc optics with the four configurations are simulated by
DIMOS.2D (from aUTrOnIc-MelcherS Gmbh corp.) to determine the best refractive index distribution to mimic a lenticular lens sheet capable of perfectly focus-ing. In the simulation, the distributions of lc molecules and electric fields are obtained and shown in Fig. 5a–d, which are the results corresponding to the configurations in Fig. 4a–d. The refractive index distributions are able to be obtained via the post analysis on the lc molecule dis-tributions, and shown in Fig. 6a–d. The analyzed results include the four configurations and one ideal case, shown in each sub-figures in Fig. 6. In Fig. 6a and c, the discli-nation effect occurs for the parallel-type electrode layout regardless of the rubbing directions. On the other hand, the analysis result for the interlaced electrode layouts with parallel rubbing, which is shown in Fig. 6d, is bet-ter than those with vertical rubbing as shown in Fig. 6b. This is mainly due to the obvious fact in this figure that
Fig. 6 Distributions of
refrac-tive index: a parallel and b interlaced electrode layouts with parallel-to-electrode stripes rub-bing, c Parallel and d interlaced electrode layouts with vertical-to-electrode stripes rubbing
0.000 0.005 0.010 0.015 0.020 0.025 1.50 1.55 1.60 1.65 1.70 1.75 Refractive Index Position (mm) 0.0 0.5 1.0 1.5 2.0 2.5 1.50 1.55 1.60 1.65 1.70 1.75 Refractive Index Position (mm) 0.0 0.5 1.0 1.5 2.0 2.5 1.55 1.60 1.65 1.70 1.75 Refractive Inde x Position (mm) 0.0 0.5 1.0 1.5 2.0 2.5 1.58 1.60 1.62 1.64 1.66 1.68 1.70 1.72 1.74 1.76 Refractive Inde x Position (mm) 0.0 0.5 1.0 1.5 2.0 2.5 1.55 1.60 1.65 1.70 1.75 Refractive Inde x Position (mm) (c) (d) (a) (b) (e)
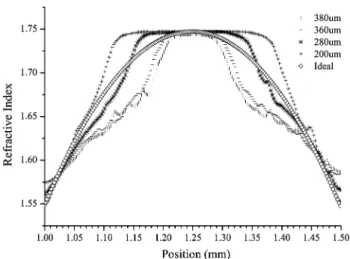
the index profiles with interlaced electrodes and parallel rubbing approach better the ideal distribution of refractive index. Then, the structure of interlacing electrode layout with parallel rubbing is adopted for the lcl lens design in this study. Finally, the width of the interlacing elec-trode is also an important factor to influencing the refrac-tive index distribution. Figure 7 shows the distribution of refractive index with different electrode widths of the proposed interlacing electrodes with the parallel rubbing. considering the simulated results, the width of 280 μm is the best design since it leads to the index distribution closest to the ideal curve.
3 Fabrication
The fabrication process of the striped electrodes on a glass substrate for the proposed lcl-lens array is given in the followings. The structure and varied sizes of the lcl-lens
array are determined following the designs in the previ-ous sections. The finalized structure is illustrated by Fig. 8, where it includes two glass substrates with striped elec-trodes and an lc layer in between. Besides, there are two polyimide (PI) layers (al-1426B, from Daily-Polymer corp.) sandwiching the lc layer. The designed sizes of the lcl-lens array structure are given in Table 2.
The two ITO glass substrates with identical thickness of 550 μm are etched with patterned 0.1 μm-thick ITO striped electrodes. each ITO electrode owns a verified transmittance of 94 %. In addition, PI layers are spin-coated for implementing rubbing on the tops of the two glass substrates. This spin-coating was conducted at 3000 rpm for 30 s. after the spin-coating, the PI layer is baked at 200 °c for 1 h. Both PI layers are rubbed to form micro-grooved surfaces. This leads to lc pre-tilts of 2°. The two glass substrates are stacked with 100 μm spacer, optical glue mixing spacer particles (Micropearl, from SeKISUI cheMIcSl corp.) in between. The lc e7 from Merck is then filled in the gap between the two glass substrates. e7 owns the ordinary refractive index,
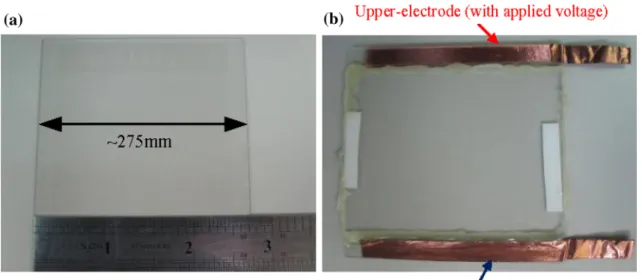
no, of 1.5183 and the extraordinary refractive index, ne, 1.7371. Figure 9a shows the photo of the etched ITO glass substrate, while the fabricated proposed lcl-lens in Fig. 9b.
4 Experiment validation
With the designed lcl-lens array fabricated, experiments are conducted next to validate the expected performance. Figure 10 illustrates the experiment setup for observing the focusing quality of the fabricated lcl-lens array which is shown in Fig. 9b. a he–ne laser of wavelength 632.8 nm is utilized as the light source. The emitted light beam passes through a 20X beam expander, an iris, a polarizer, the lcl-lens array, an analyzer and finally reaches a charge-coupled device (ccD). The iris is used for trimming the incident light from the laser to observe the interference pattern easily. The polarizing direction of the polarizer, rubbing direction of the PI layer and that of the analyzer are in 45° difference subsequently, in order
Fig. 7 Distributions of refractive index for different electrode widths
of the proposed interlacing electrodes with parallel rubbing
Fig. 8 The structure of the proposed lcl-lens
Table 2 Fabrication parameters
layer Processing Thickness
ITO glass substrate – 550 μm
Striped electrodes etching 0.1 μm
PI coating: 3,000 rpm/30 s; hard-baking: 200 °c; rubbing: 1.5° ~1,600 nm before rubbing lc, dlcl – 100 μm
Fig. 9 Photos of a the etched ITO glass substrate and b the fabricated lcl-lens array
Fig. 10 experiment apparatus
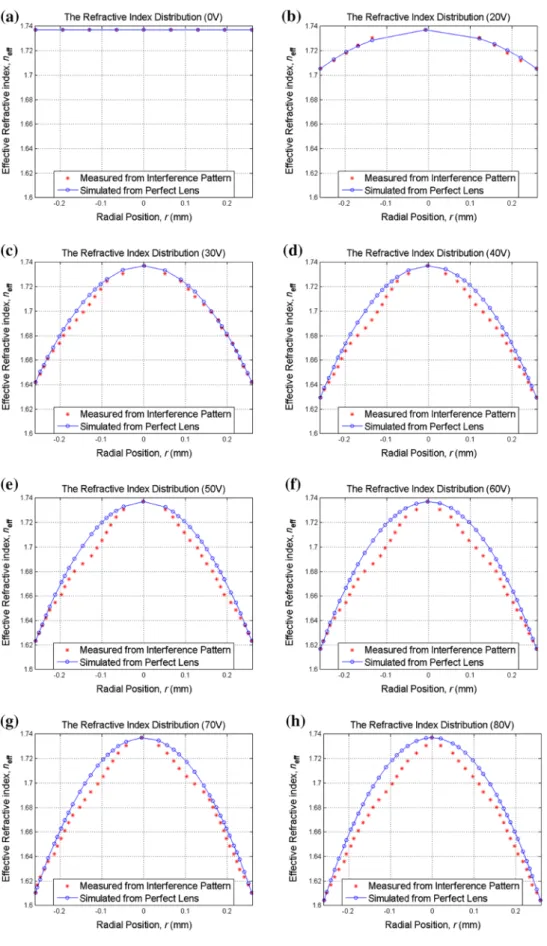
Fig. 12 extracted indices with
applied voltages of a 0 V, b 20 V, c 30 V, d 40 V, e 50 V, f 60 V, g 70 V and h 80 V from measured interference patterns
to generate desired striped interference patterns. Finally, for a clear interference pattern in the ccD, the lcl-lens array is placed at the focal point of the lens module of the ccD.
Figure 11a–h show resulted experimental interference patterns of the proposed lcl-lens array with different applied voltage, 0, 20, 30, 40, 50, 60, 70 and 80 V at 1 khz, respectively. It is clearly seen from Fig. 11a–h that the interference stripes are more densely present as the applied voltage increasing, rendering shorter focus lengths of the lcl-lens array. The interference patterns shown in Fig. 11a–h are next deciphered to extract the focus length with different applied voltages. note first that the set of polarizer-lc-lens-analyzer in
the experiment shown in Fig. 10 presents a standard crossed-polarizer setup for the lc lens. Based on basic liquid crystal optics (Yeh et al. 1999), the phase delay between two adjacent bright or dark stripes in Fig. 12 corresponds to a phase change of 2π. Thus, the resulted effective index difference between these two stripes can be calculated by
where Δneff is defined as the effective anisotropy across lcl-lens array thickness along an lc column (lueder et al. 2001) which is
where 1/12.2w is the width of the lcl-lens which is also called the radial (cross-width to the lenticular lenses) posi-tion of the lens and
is the total optical retardation through an lc column. also in eq. (13), Δn is the optical anisotropy of a single lc molecule.
With the above index difference between adjacent bright stripes in hands and the fact that the effective index of the central solid circle in Fig. 12 corresponds to neff = ne = 1.7371, the indices at varied radial
posi-tions of the lcl-lens can be derived as shown in Fig. 12. assuming the lc lens acting like a GrIn lens, the derived indices are fitted into a parabolic curve for (13) ∆neff= dLCL , (14) ∆neff( 1 2w)dLCL=R, (15) R = dLCL z=0 ∆n(z)dz,
Fig. 13 The focal lengths of the purposed lcl-lens array with
applied voltages, 20, 30, 40, 50, 60, 70 and 80 V
Fig. 14 The measurement
method for capturing images to right and left eyes
estimating the focus length of the lens. The results are shown in Fig. 13. It is seen that the dynamic range of the focus length ranges from 2.50 to 10.43 mm, and it is obviously that the focal length, 2.63 mm, of the lcl-lens array with applied 70 V is closest to the desired focal length, 2.61 mm. The focus lengths herein based on the fitted data are regarded as and actually should be very close to actual focal lengths.
Moreover, another experiment is conducted for dem-onstrating that the proposed lcl-lens array has the func-tion of image separafunc-tion. a method of the experiment is shown as Fig. 14. The image of green-magenta stripes is inputted to the panel with the lcl-lens array. The camera is located at two positions which are 400 mm away to the panel, and used in place of right and left eyes of the viewer to capture. The two images are able to reveal the function of image separation when the two images are only shown as magenta or green, respectively. By this result, the pro-posed lcl-lens array is well proven capable of separating the images to left and right eyes, successfully realizing an auto-stereoscopic 3D display with adaptability to varied viewer locations.
5 Conclusion
an lcl-lens array with interlaced electrodes for a two-view 2D/3D switchable auto-stereoscopic lcD display in 2.8 inch is designed and analyzed. The design criteria of the lenticular lens sheet and the lcl-lens array used in an auto-stereoscopic display are distilled. Suitable designs of the lenticular lens sheet and novel structure designs of the interlaced electrodes have been proposed to be used in the 3D display system and analyzed via DIMOS.2D for optimizing the proposed lcl-lens array performance. a practical lcl-lens array is fabricated based on the dis-tilled design guidelines. Finally, the performance of the designed lcl-lens array is successfully demonstrated with measured interference patterns. It is successfully shown that the proposed lcl-lens array is capable of separating the images to left and right eyes, successfully realizing an auto-stereoscopic 3D display with adaptability to varied viewer locations.
Acknowledgments The authors appreciate the support from
national chip Implementation center and national Science coun-cil of r.O.c under the grant no. nSc 99-2622-e-009-017-cc1 and
nSc 99-2220-e-009-005-. This work was also supported in part by the UST-UcSD International center of excellence in advanced Bio-engineering sponsored by the Taiwan national Science council I-rice under the grant no. nSc-101-2911-I-009-101.
References
Berkel cV (1999) Image preparation for 3D-lcD. Proc SPIe Int Soc Opt eng 3639:84–91
Berkel cV (2000) “autostereoscopic display apparatus”. US Patent #6,064,424
Berkel cV, clarke Ja (1997) characterisation and optimiza-tion of 3D-lcD module design. Proc SPIe Int Soc Opt eng 3012:179–186
Berkel cV, Parker DW, Franklin ar (1996) Multiview 3D-lcD. Proc SPIe Int Soc Opt eng 2653:32–39
chiu cW, lin Yc, chao PcP, Fuh aYG (2008) achieving high focus-ing power for a large aperture liquid crystal lens with novel hole-and-ring electodes. Opt express 16:19277–19284
hong hK, Jung SM, lee BJ, Im hJ, Shin hh (2008) autostereo-scopic 2D/3D switching display using electric-field-driven lc lens. Dig Tech Pap SID Int Symp 39:348–351
hong hK, Jung SM, lee BJ, Shin hh (2009) electric-field-driven lc lens for 3-D/2-D autostereoscopic display. J Soc Inform Disp 17:399–406
huang YP, chen ch, Shen Tc (2009) high resolution autostereo-scopic 3D display with scanning multi-electrode driving liquid crystal lens. SID Symp Digest Tech Pap 40:336–339
S Ichinose (1989) “Technique of stereoscopic image display”. eP Pat-ent #0,354,851
Kao Y–Y, chao Pc-P, hsueh cW (2010) a new low-voltage-driven GrIn liquid crystal lens with multiple ring electrodes in unequal widths. Opt express 18:18506–18518
S-K Kim, K-h Yoon (2013) “Dynamic viewing zone reformation generated by 3D optical line in multiview 3D display”. In: 12th workshop on information optics (WIO), pp 1–2
J lee, K-Y chae, S Ji (2012) “The 3D video processing method in the stereoscopic camera for mobile devices”. In: Ieee international conference on emerging signal processing applications (eSPa), pp 139–142
lueder e (2001) liquid crystal displays. Wiley, new York
liou J-c, lee K, huang J-F (2011) low crosstalk multi-view tracking 3-D display of synchro-Signal leD scanning backlight system. J Disp Technol 7(8):411–419
ra JM, Jeon MJ, lee Jh, Moon Sh, Young hwan Kim (2011) 1451. Ieee Trans consum electron 57(4):1451–1459
ren h, Fox DW, Wu B, Wu ST (2007) liquid crystal lens with large focal length tunability and low operating voltage. Opt express 15:11328–11335
Takanashi n, Uehara S, Ishii J, hayana h, asada h (2004) Dual-len-ticular-lens-based 2-D/3-D convertible autostereoscopic display. J Soc Inform Disp 12:335–340