not all the possible ones: in fact, the fade durations for which the attenuation does not reach S + dS dB are excluded.
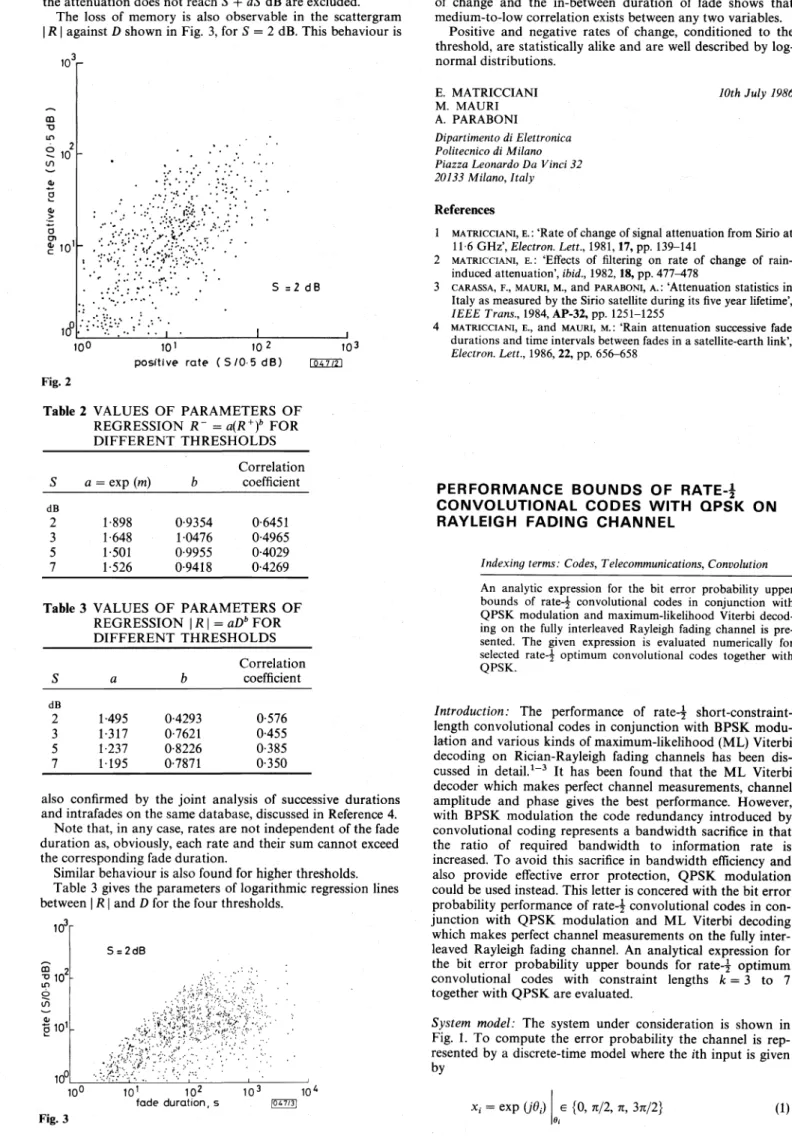
The loss of memory is also observable in the scattergram | R | against D shown in Fig. 3, for 5 = 2 dB. This behaviour is
GQ •o in S102 CO rat e > o 10° • * . • ••. •'• ;•',* ,*. '. * • • ..' ' • . V'V.v' ' . . • ,'. * S = 2 dB 1 i 10° 101 1 02 positive rate ( S / 0 - 5 d B ) Fig. 2
Table 2 VALUES O F PARAMETERS O F
REGRESSION R~ = a(R+)b FOR DIFFERENT THRESHOLDS 103
s
dB 2 3 5 7 a = exp (m) 1-898 1-648 1-501 1-526 b 0-9354 1-0476 0-9955 0-9418 Correlation coefficient 0-6451 0-4965 0-4029 0-4269Table 3 VALUES O F PARAMETERS O F
REGRESSION \R\ = aDb FOR DIFFERENT THRESHOLDS
s
dB 2 3 5 7 a 1-495 1-317 1-237 1195 b 0-4293 0-7621 0-8226 0-7871 Correlation coefficient 0-576 0-455 0-385 0-350also confirmed by the joint analysis of successive durations and intrafades on the same database, discussed in Reference 4.
Note that, in any case, rates are not independent of the fade duration as, obviously, each rate and their sum cannot exceed the corresponding fade duration.
Similar behaviour is also found for higher thresholds. Table 3 gives the parameters of logarithmic regression lines between | R | and D for the four thresholds.
ioY CD 2 •o 10 -O i?) 10° S = 2dB ;"-*' 10° 101 10z fade duration, s 10J |CU7/3| 10*
Conclusions: The joint analysis of positive and negative rates of change and the in-between duration of fade shows that medium-to-low correlation exists between any two variables.
Positive and negative rates of change, conditioned to the threshold, are statistically alike and are well described by log-normal distributions. E. MATRICCIANI 10th July 1986 M. MAURI A. PARABONI Dipartimento di Elettronica Politecnico di Milano Piazza Leonardo Da Vinci 32 20133 Milano, Italy
References
1 MATRICCIANI, E. : 'Rate of change of signal attenuation from Sirio at 116 GHz', Electron. Lett., 1981,17, pp. 139-141
2 MATRICCIANI, E.: 'Effects of filtering on rate of change of rain-induced attenuation', ibid., 1982,18, pp. 477-478
3 CARASSA, F., MAURI, M., and PARABONI, A. : 'Attenuation statistics in Italy as measured by the Sirio satellite during its five year lifetime',
IEEE Trans., 1984, AP-32, pp. 1251-1255
4 MATRICCIANI, E., and MAURI, M. : 'Rain attenuation successive fade durations and time intervals between fades in a satellite-earth link',
Electron. Lett., 1986, 22, pp. 656-658
PERFORMANCE BOUNDS OF RATE-| CONVOLUTIONAL CODES WITH QPSK ON RAYLEIGH FADING CHANNEL
Indexing terms: Codes, Telecommunications, Convolution
An analytic expression for the bit error probability upper bounds of rate-| convolutional codes in conjunction with QPSK modulation and maximum-likelihood Viterbi decod-ing on the fully interleaved Rayleigh faddecod-ing channel is pre-sented. The given expression is evaluated numerically for selected rate-^ optimum convolutional codes together with QPSK.
Introduction: The performance of rate-j short-constraint-length convolutional codes in conjunction with BPSK modu-lation and various kinds of maximum-likelihood (ML) Viterbi decoding on Rician-Rayleigh fading channels has been dis-cussed in detail.1"3 It has been found that the ML Viterbi decoder which makes perfect channel measurements, channel amplitude and phase gives the best performance. However, with BPSK modulation the code redundancy introduced by convolutional coding represents a bandwidth sacrifice in that the ratio of required bandwidth to information rate is increased. To avoid this sacrifice in bandwidth efficiency and also provide effective error protection, QPSK modulation could be used instead. This letter is concered with the bit error probability performance of rate4 convolutional codes in con-junction with QPSK modulation and ML Viterbi decoding
which makes perfect channel measurements on the fully inter-leaved Rayleigh fading channel. An analytical expression for the bit error probability upper bounds for r a t e 4 optimum convolutional codes with constraint lengths k = 3 to 7 together with QPSK are evaluated.
System model: The system under consideration is shown in Fig. 1. To compute the error probability the channel is rep-resented by a discrete-time model where the ith input is given by
Fig. 3
= exp (j0t) e {0, TT/2, n, 3n/2} (1)
and the corresponding normalised matched filter output after deinterleaving is
i = y/(EJNQ)aixi (2)
where {Nj is an independent identically distributed (IID) noise sequence of complex Gaussian variates with zero mean
data
source - convolutionalencoder *•:
fully interleaved discrete -time channel
Fig. 1 Block diagram of system under consideration
and unit variance, {a,}, with at representing the value of the amplitude fading process a(t) throughout the ith signalling interval, is an IID sequence of random variates with distribu-tion
f(ad = 2ate-«2 (3)
and EJNQ is the received signal/noise ratio (SNR) per received symbol, which equals the received SNR per bit, Eb/NQ, in this case, where Eb is the energy per input bit. In addition to y,, the Viterbi decoder is also supplied with the channel amplitude a, from a channel estimator.
Pairwise error probability: The pairwise error probability
between the transmitted sequence x = {x,} and the estimated sequence x = {x,} is now developed. Given the received sequences y = {yt} and a = {a,-}, the ML decision rule for the Viterbi decoder which makes perfect amplitude measurement implies that
Pr(y | x, a) < Pr{y \ x, a) when x # x (4)
Since {x,}, {x,} and {a,} are IID sequences, eqn. 4 can be manipulated to give
aiy/Lxt - x,)* + a,.tf (x, - x(.) < 0 (5)
where * denotes the complex conjugate. Without loss of gen-erality we may assume that, in the transmitted sequence x, x, = +1 for all i (corresponding to the all-zero message). If x differs from x in exactly k symbols, and there are kr symbols
D, I
OO/Oi
Fig. 2
a Rate-j, k = 3 code and its state diagram
b Modified state diagram code in (a) with Gray mapping into QPSK; augmented generating function:
T{Dls D2, 1) =
1 -2DJ
with value ±j and k2 symbols with value —1, then eqn. 5 is equivalent to
V = I a
ofa + Re (N,) + Im (N,)]+ 2 I amly/(Eb/N0)am + Re (NJ] < 0 (6)
where Re (N,) and Im(Af,) are the quadrature components of complex noise N{ described in eqn. 2. Making use of the inequality Q{x) < \ exp (—x2/2), we have the conditional pair-wise error probability
Pkik2(E\a) = = Q 1 / IT *i \ / F *2 \
- 2
e x pl " 2 F
Z aW
e x p( " F ^
al)
(7) where 00J >/(2«)
Q(x) = Since a, is Rayleigh-distributed, distributed random variable. Thus£[exp (wqj] =
Vfc
= Li= i is a x
-- w)k (8)
The unconditional pairwise error probability hence becomes
(
2 Vl + Eb/2N0 Eb/N0
(9)
Performance upper bound: At this point the generating
func-tion union bounding approach initiated by Viterbi4 is applied to derive the bit error probability upper bound. For a
convol-10' KS2 A a.
flu
3 2 o § -5 o 10 E io6,6'
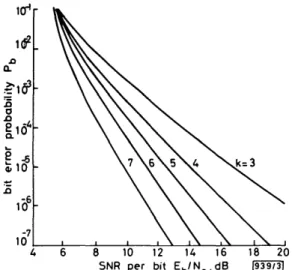
\k=3 8 10 12 1A 16 SNR per bit Eb/NQ,dB 18 20 1939/31Fig. 3 Computed upper bounds for selected rate-\ codes with QPSK on
fully interleaved Rayleigh fading channel
k is the constraint length
utional code with QPSK the augmented generating function denoted by P(D{, D2, I) can be obtained in the conventional manner, except that the weight label of the branches on the state diagram should be properly modified. For illustrative purposes, an example is given in Fig. 2. In terms of T(DU
D2, I) the bit error probability Pb for rate-| convolutional codes with QPSK modulation is upper-bounded by
Pb<~ 1 dT(D2, Du I) dl 1 (10) Eb/2N0 Eb/N0
This expression for Pb is numerically evaluated and is plotted in Fig. 3 for the selected rate-| optimum convolutional codes with constraint lengths k — 3 to 7 and with Gray mapping into QPSK.
Conclusion: For rate-| convolutional codes with QPSK on a
Rayleigh fading channel, the derived analytic expression is a weak upper bound on the bit error probability. However, the approach utilised here can be extended to convolutional codes with M-ary PSK modulation on Rician fading channels. A generalised expression for the tight bit error probability upper bounds is under investigation.
YUH-LONG CHEN 16th June 1986 CHE-HO WEI
Institute of Electronics National Chiao Tung University Hsin-Chu, Taiwan, Republic of China
References
1 MODESTINO, J. w., and MUI, s. Y. : 'Convolutional code performance in the Rician fading channel', IEEE Trans., 1976, COM-24, pp. 592-606
2 HAGENAUER, J.: 'Viterbi decoding of convolutional codes for fading- and burst-channel'. Proceedings of international Zurich seminar on digital communications, Zurich, 1980, pp. G2.1-7 3 DUNHAM, j . G., and TZOU, K.-H. : 'Performance bounds for
convolu-tional codes on Rician fading channels'. Proceedings of interna-tional conference on communications, Denver, 1981, pp. 12.4.1-5 4 VITERBI, A. j . : 'Convolutional codes and their performance in
com-munications', IEEE Trans., 1971, COM-19, pp. 751-771
COAXIALLY MOUNTED 67 GHz BANDWIDTH InGaAs PIN PHOTODIODE
Indexing terms: Photoelectric devices, Photodiodes
We report high-speed measurements of an InGaAs PIN photodiode in a millimetre-wave coaxial mount. The photo-diode has an impulse response (including photo-diode, parasitics and connector) of 9 ps FWHM and a 3 dB bandwidth of 67 GHz. This is the largest bandwidth reported to date for a photodiode in a coaxial mount with a connector.
Wideband photodiodes are important components for multigigabit/second optical systems operating in the 0-8 fim and 1-3 /mi to 1-55 /zm wavelength ranges. To attain high-speed performance, it is necessary that the active region of the photodiode have a small area (to minimise capacitance) and be thin (to minimise carrier transit times).1"4 In addition, it is necessary that electrical parasitics associated with the device package be kept small. To this end, the chip is usually mounted in a microstrip,1'2 coaxial3'4 or waveguide5 fixture, preferably with some form of connector for convenient con-nection to test instrumentation. The highest bandwidth reported to date for an InGaAs PIN detector, with a 50 ft coaxial connector and an internal biasing circuit, is 36 GHz.4 A similar device, in a 25 Q hybrid circuit, has shown an impulse response of 10 ps FWHM.6 Responses at frequencies to 60 GHz have been achieved using waveguide test fixtures,5 but separate photodiodes and waveguides are required to cover the full 26-5 GHz to 60 GHz measurement range.5 This
letter reports bandwidth measurements of a PIN photodiode in a coaxial mount. The photodiode shows a response extend-ing from DC to millimetre-wave frequencies, with a 3 dB bandwidth of 67 GHz and an impulse response of 9 ps FWHM. This is the fastest response reported to date for a photodiode in a coaxial mount with a connector.
The PIN photodiode used here is a back-illuminated mesa structure with an active area of approximately 150 fim2 and an intrinsic layer thickness of approximately 0-5 /an. Further details of the photodiode structure are given in Reference 3. The chip was mounted on a small, low-inductance L-shaped bracket provided with a hole to allow back-illumination of the intrinsic region. The mesa contact on the chip was connected directly via a short (250 /*m) length of low-inductance gold mesh to the centre pin of a commercial coaxial-to-microstrip transition (Wiltron K-connector). The chip was from the same wafer as those of References 4-6, and the mounting was nominally identical to that of Reference 4.
The electrical parasitics of the photodiode were determined from a series of network analyser reflection coefficient mea-surements at frequencies up to 10 GHz. These meamea-surements were carried out using (i) a bare connector and (ii) a K-connector with the photodiode mounted. From these mea-surements, the parasitic capacitance shunting the depletion region was determined to be 005 pF at 5 V reverse bias, in agreement with previous estimates for a similar device.4 The series inductance of the gold mesh is approximately 02 nH.
The response of the photodiode was measured at a wave-length of 1-3 /im by electro-optic sampling in GaAs.7 The sampler comprised a 50 ft microstrip line deposited on a semi-insulating GaAs substrate and mounted in a package which was equipped with K-connectors of opposite sex to the photo-diode package. The photophoto-diode was connected directly to one end of the sampler, while the other end of the sampler was terminated with a bias tee and a 50 ft load. Note that this experimental arrangement gives the response of the diode, parasitics and coaxial connector, but enables the response of the bias network to be excluded. We believe that this is a major factor responsible for the improvement in our measured bandwidth over that reported in Reference 4.
A mode-locked 1-3 nm InGaAsP injection laser operating at a repetition rate of 3-7 GHz was used both to pump the photodiode and to probe the electro-optic sampler. An impor-tant feature of the measurement system is that the effect of the nonzero pulsewidth of the mode-locked laser can be decon-volved from the measured data if the intensity autocorrelation function of the laser is known.8 In the present work, the auto-correlation was measured by conventional second-harmonic generation techniques, using a nonlinear LiIO3 crystal. The
measured autocorrelation width was 17 ps FWHM. The uncertainty in the deconvolved photodiode response was approximately +2 ps, due to the finite signal/noise ratio of the measurement. Further details of the measurement tech-nique are presented in Reference 7.
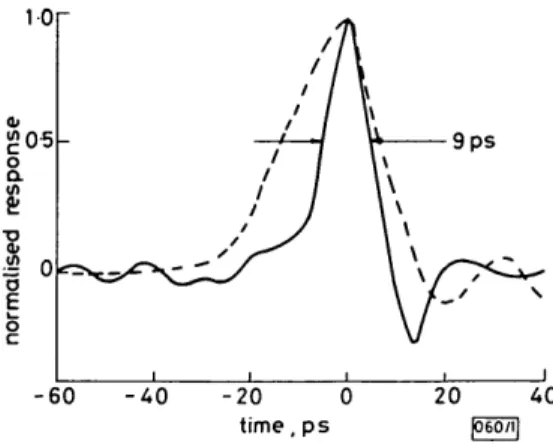
Fig. 1 shows the measured impulse response of the photo-diode when biased at 5 V. The broken curve is the response as obtained directly from electro-optic sampling, while the solid curve is the photodiode response after deconvolving the
auto-10 £05 o a = 0 a 9 p s -60 - 4 0 -20 0 20 time.ps |Q6o7i]
Fig. 1 Measured impulse response of photodiode Broken curve: sampled signal
Solid curve: deconvolved response