[自由論題]
The Economic Impact of China-Taiwan Ferry-Cruise Traffic
J h i h - S i a n S U N
(National Kaohsiung Marine University)
Y a - Y e n S U N
*(National University of Kaohsiung)
H u i - L u n g Y U
(National Kaohsiung Marine University)
Direct marine transportation between Taiwan and Mainland China was inaugurated in December 2008, which initiated a new transportation alternative for Chinese tourists to visit Taiwan, and provided a direction for the development of cruise tourism between the two regions. The purpose of this study is to estimate the economic impact associated with China-Taiwan ferry-cruise traffic based on the Taiwan national Input-Output Model. Using data from onsite surveys and expert interviews, the average expenditure of ferry-cruise Chinese visitors to Taiwan is estimated to be US$1,255 per person for an average 5.6 night trip, and the per-capita spending has put Chinese ferry-cruise passenger as the third highest per-day spender among all inbound visitors to Taiwan. The estimated total spending is US$30.1 million in 2010, and the total economic impacts, including direct and indirect effects, are estimated to be US$46.26 million in direct sales, 811 non-full time equivalent jobs, US$10.66 million in personal income and US$0.57million tax dollars. Given the economic contribution demonstrated in this study, the ferry-cruise market is worth investing and developing but how to maintain the novelty of the ferry experience and their competitiveness in relation to the air carriers would become a great challenge for the shipping companies as well as those stakeholders who desire to expand this niche market.
KEYWORDS: Economic Impact Studies, Ferry, Cruise Tourism, Taiwan
Ⅰ Introduction
1 Taiwan Tourism Development
Taiwan has been eagerly embarking on tourism development over the past decade. Long-term governmental tourism policies, the “Doubling Tourist Arrivals Plan” and the “Vanguard for Excellence in Tourism Project”, aimed at increasing inbound tourist numbers and final consumption from the years 2002 to 2012, demonstrate the government’s perspective in positing tourism as an important vehicle for delivering economic benefits to the destinations (Council for Economic Planning and Development, 2002; Taiwan Tourism Bureau, 2009). With extensive investment and promotion activities, the total number of annual inbound tourists coming to Taiwan has increased from 2.62 million in 2000 to 5.57 million in 2010, with an annual growth rate of 7.8% (Taiwan Tourism Bureau, 2010).
Among all inbound visitors, tourists coming from Mainland China are the emerging and the largest inbound market for Taiwan. Since Taiwan opened up its tourism market to Mainland China tourists in July 2008, Chinese arrivals have increased from 329, 000 in 2008, 972,000 in 2009 to 1.63 million in 2010, with an average annual growth rate of 70%, far exceeding other visitor segments. The average expenditure per person per day in 2009 was estimated
to be US$230, and the total injection of Chinese visitors from July 2008 to December 2010 was around US$6.45 billion (Taiwan Tourism Bureau, 2011b). In addition, based on the World Economic Forum’s report, during the 2007 to 2009 financial crisis, Taiwan, Malaysia, and Indonesia managed to overcome the downturn successfully and grew in spite of the global contraction of the travel market due to the strong inbound volume of China visitors (Blanke & Chiesa, 2011). These results demonstrate the importance of the Chinese inbound market as the generator of foreign receipts as well as their resistance to outside disturbance factors. In response to the strong Chinese inbound demand, the across-strait air transportation services have increased from 15 flights per week in 2008 to 94 flights in 2011 (Civic Aeronautics Administration, 2011). However, even with the expansion of direct flights, expensive airline tickets and insufficient air capacity during the high season were frequently raised as major barriers for cross-strait travel (Civic Aeronautics Administration, 2011).
The other alternative to develop the Chinese inbound market, under the constraint of flight capacity, is to adopt marine transportation. From the perspective of Taiwan, the development of cruise/ferry services between Taiwan and Mainland China is strongly influenced by the political relationship and legal regulations between the two sides. Direct links across the Taiwan Straits, prohibited for more than half a century, were opened up on December 15, 2008. Initially, passenger services were agreed to be provided only by the Taiwanese Ocean Lala, owned by the Excalibur International Marine Corporation, and the Mainland Chinese Cosco Star, owned by the China Ocean Shipping Company (COSCO), a Chinese government funded operation. However, the Ocean Lala was forced to discontinue its service after being damaged en route from Xiamen (China) to Taichung (Taiwan) in 2010 (The China Post, 2010).
The current marine shipping operator, Cosco Star, has a capacity of 683 passengers, providing several classes of passenger cabin and onboard entertainment facilities. During our study period, Taiwan allows only group travel for tourists from Mainland China†. Therefore, every Cocso Star passenger is required to join a group tour in China first and then travel to Taiwan based on a planned itinerary. This cross-strait transportation pattern does not conform to the traditional concept of cruise tourism or standard ferry
transportation, because the Cosco Star provides point to point routine maritime transportation (ferry mode) and carries dominantly Chinese tourists on package tours (cruise mode). Therefore, for the purposes of this study, we adopt the term “ferry-cruise” in describing this special marine transportation pattern between China and Taiwan.
In 2010, approximately 24,000 Chinese visitors came by sea (1.5% among all Chinese visitors) and the capacity usage rate of Cocso Star was 25%‡ for cross-strait passenger shipping. Although only a relatively small percentage of Chinese visitors currently choose the marine transportation as a vehicle to Taiwan, this niche market cannot be overlooked. The importance of this ferry-cruise market can be elaborated from several perspectives. First of all, this novelty mode of travel offers an alternative in alleviating the capacity constraint in air transportation for mainland China visitors, especially when this market has experienced the fastest growth rate over the past 3 years. Secondly, with the opening of cross-strait passenger transportation by sea in 2008, this opportunity signals that a new wave of tourists can be attracted under the global cruise-tourism banner, for those
2 Since June 2011, free and independent travelers (FIT) from Mainland China have been allowed to visit Taiwan.
3 The arrival of Chinese visitors to Taiwan by the boat in 2010 was 23,000 and the total departure was 26,000. This information is provided by the Cosco Star Taiwan branch. We use 24,000 passengers in our calculation. The total capacity of Cosco Star is 196,700 passengers round-trip per year, corresponding to a 25% usage rate
that crave for novelty or prefer a slow-paced travel experience.
To further develop the cross-strait ferry-cruise market, it is necessary to evaluate the economic contribution associated with this niche product per capita and in total, and to investigate the relevant factors on customers’ decision. The main purpose of this study is first to estimate the economic impact associated with Mainland China-Taiwan ferry-cruise traffic by looking into the expenditure patterns of ferry-cruise passengers and their associated influences on Taiwan’s economy using the Input-Output (IO) model. Further, to provide a foundation for further policy adjustments and political negotiation between two sides, we investigate the travel motivation factors in taking a ferry-cruise to Taiwan, and the preference regarding the transportation mode for the future trips. Results can assist the policy makers to emphasize on factors that can facilitate further ferry-cruise usage rate, realize the economic impacts of passenger-shipping, as well as to evaluate the complimentary/competing nature between different transportation vehicles. This paper will first outline its research methods, followed by an explanation of the data sources, and will conclude with empirical results and concomitant policy implications.
Ⅱ Research Methods
The Input-Output (IO) model is used to analyze the economy-wide influences with respect to final demand changes, in this case, the expenditure in Taiwan associated with ferry-cruise passengers using Taiwan-China cross-strait services. A standard IO analysis can address the following economic influences: 1) direct effects, the economic activities (sales, jobs, personal income and value added) that are generated by the industry directly receiving passenger expenditure; 2) indirect effects, the economic activities associated with the supply chain; and 3) induced effects, which address the economic activities associated with employee consumption after they receive salary and benefits from holding the job (Miller & Blair, 1985). These effects can be calibrated using type I and type II multipliers from the national or regional IO table (Equation 1). Type I multipliers represent the direct and indirect effect associated with one dollar of final demand change on the i industry to the overall economy, while type II multipliers take into account the household consumption (the induced effects) and demonstrate a larger effect. In this study, the relatively conservative type I multipliers will be presented in the following section.
1 Sales multipliers = (I-A)-1
Where (I-A)–1 or B matrix= the Leontief Inverse Matrix I = Identify Matrix
A = Technical input coefficients
1 Taiwan Input-Output Model
The IO model has been used extensively in assessing tourism applications for economic influences on regional economy. The economic impacts of tourist expenditure in Taiwan have also been well documented and studied (Chen, 2004; Chen, Liu, Huang, & Chang, 2008; Jeng & Lee, 2003; Li & Chuang, 2008; Sun, 2005; Wu & Pan, 2004; Yang & Chen, 2009). While previous literatures have focused mainly on domestic tourism from a regional scope, our study provides new information from two perspectives: first, the study subject involves the newly opened and emerging Chinese market which is perceived as the major driver in generating foreign receipts; secondly, the emphasis is delimited to the cross-strait ferry-cruise transportation model from a national perspective. For a small-island economy, Taiwan places great emphasis on tourism and transportation development. Our study provides a foundation
for further policy application on this point of view.
2 Visitor expenditure survey
The expenditure pattern of Chinese cruise-ferry passengers in Taiwan is estimated from two perspectives: personal expenditure in Taiwan on the trip and the package fee that is paid to the Taiwan travel agencies. The first factor, visitor expenditure, was estimated using onsite surveys conducted in April 2011 at Keelung and Taichung ports before the passengers’ departure. The survey asked for spending on package fee, shopping (highlighting nine categories), food and beverage, local transportation and personal entertainment. In addition to the expenditure questions, participants were asked about their travel decision process, satisfaction and demographics.
While all Chinese tourists are required to enter Taiwan through the format of package tours, they have to pay their package fee to Mainland China travel agencies before the trip. These agencies will then subcontract the business to the Taiwan travel agencies in hosting these visitors when they arrive at the destination. The pre-paid package fee that ferry passengers paid to the China travel agency does not guarantee all amounts will be due to the Taiwan business sectors. Since the purpose of this study is to estimate the economic impacts of visitor spending in Taiwan, understanding the allocation and percentage of pre-paid package fee diverted to Taiwan requires further investigation. The data requested, however, is concerned with financial confidentiality and creates a challenge in securing the cooperation of business operators. As an alternative, we interviewed the Secretary General of the Travel Agent Association of Taiwan, who is a key mediating personnel between the Taiwan Tourism Bureau and local travel agencies. His renowned experience and in-depth knowledge provide a sound credential for the cost profile and current operation of travel agencies in Taiwan. His opinion will be used to calibrate the average price per person that the travel agency in Taiwan will receive.
Ⅲ Results
1 Average and total expenditure
Two waves of visitor surveys at Keelung and Taichung ports generated a total of 113 cases, of which 98 cases provide valid spending information. The sampled visitors indicated that their average personal expenditure, besides the tour package fee, in Taiwan is around US$925 for an average 5.6 night trip (Table 1). Shopping expenses contribute about 93% of the total amount, with “jewelry or jade” and “local special products (mainly food products)” being the two most popular categories. The pre-paid package fee retained in Taiwan is estimated using information provided by the Secretary General of the Travel Agent Association of Taiwan. The service fee received by the local travel agency is estimated at around US$30~$40 per person per day. The total expenditure for Chinese ferry visitors is estimated to be $1255 per person per trip after summing up the estimated package fee and their personal out-of-pocket expenditure in Taiwan. Around 70 percent of total expenditure goes to the shopping items, while the lodging sector and the food and beverage sector receive comparatively minimal shares.
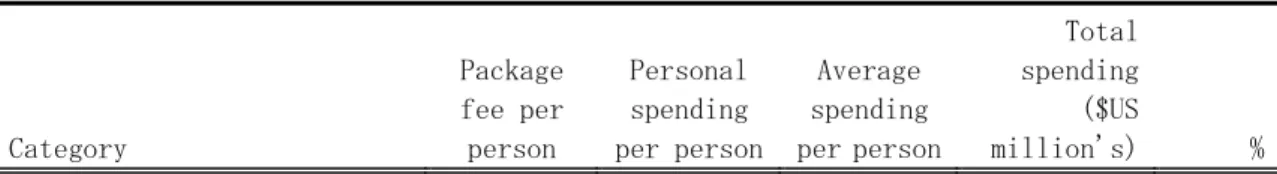
Table 1 Average expenditure of Chinese ferry-cruise tourists Unit: US$
Category Package fee per person Personal spending per person Average spending per person Total spending ($US million's) %
Lodging $133 - $133 $3.20 11%
Food and beverage $63 $29 $92 $2.20 7%
Transportation $47 $7 $54 $1.30 4% Entertainment $8 $32 $40 $1.00 3% Travel agency $78 - $78 $1.90 6% Shopping - $857 $857 $20.60 68% Clothes or accessories - $44 $44 $1.10 4% Jewelry or jade - $251 $251 $6.00 20% Cosmetics or perfumes - $72 $72 $1.70 6%
Local special products - $158 $158 $3.80 13%
Tobacco or alcohol - $50 $50 $1.20 4%
Chinese herbal medicine - $74 $74 $1.80 6%
Electric appliances - $23 $23 $0.60 2%
Souvenirs - $72 $72 $1.70 6%
Other shopping items - $113 $113 $2.70 9%
Total $329 $925 $1,255 $ 30.10 100%
We further compare the average spending patterns between Chinese ferry-cruise passengers and the top five inbound visitors from Mainland China (mainly by air), Japan, Hong Kong, US and Korea (Taiwan Tourism Bureau, 2011a). Two major findings are drawn. First, Chinese tourists arriving by air and Chinese ferry-cruise tourists have a similar spending pattern, at around US$220. At the same time, Chinese ferry-cruise passengers incurred a very high spending figure, only ranked less than the Japan visitors (US$269 per person per day) among all inbound tourists. Our second observation indicated that, in general, Chinese visitors tend to incur a greater proportion of their expenditure on shopping (around 50%), and this pattern is further amplified among Chinese ferry-cruise passengers, as the percentage increases to 68%.
In 2010, the total Chinese ferry-cruise passenger number is around 24,000, and the estimated total spending in Taiwan is US$30.1 million (Table 1). Sectors that received the lion’s share are business entities that sell and manufacture “jewelry or jade (20%)” and “local special products (13%)”, which outnumbered the traditional tourism sectors, such as lodging (11%), restaurants (7%) and transportation (4%).
2 Economic Impacts of China Ferry Passengers in Taiwan
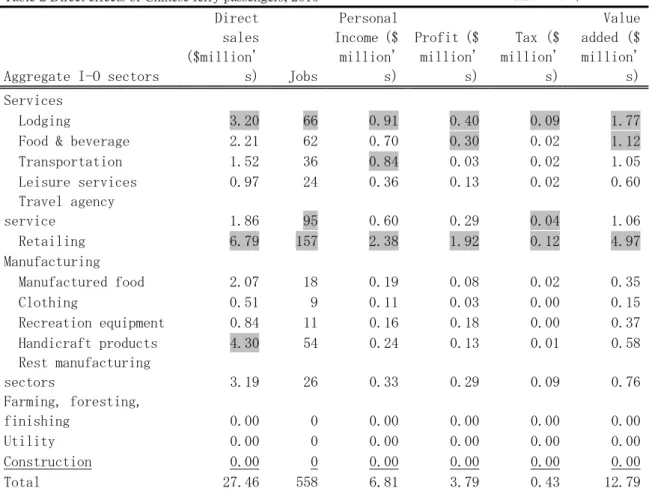
The last step of an economic impact analysis is to multiply the total spending with the IO multipliers to estimate the sector level influences on jobs, personal income, tax and value added in terms of direct and indirect economic impacts. The $30 million spending supported $27.46 million in direct sales, 558 non-full time equivalent jobs, $6.81 million in personal income and $0.43 million tax dollars (Table 2). The number in direct sales is different from total visitor expenditure because some of the products that tourists purchased are imported goods, which creates leakages at the final demand level and does not support any economic impacts in Taiwan besides the retailing margin. The estimated capture rate is 91.2%, representing that 8.8 % of shopping expenses goes directly to the imported products. Due to high spending on the shopping categories, the sector that receives the most direct sales is the retailing sector ($6.79 million), followed by the sector of handicraft products ($4.30 million) and the lodging sector ($3.2 million). With a
labour-intensive structure, retailing, travel agency services and lodging are the top three sectors on the overall employment performances.
Table 2 Direct effects of Chinese ferry passengers, 2010 Unit: US $
Aggregate I-O sectors
Direct sales ($million' s) Jobs Personal Income ($ million' s) Profit ($ million' s) Tax ($ million' s) Value added ($ million' s) Services Lodging 3.20 66 0.91 0.40 0.09 1.77
Food & beverage 2.21 62 0.70 0.30 0.02 1.12
Transportation 1.52 36 0.84 0.03 0.02 1.05 Leisure services 0.97 24 0.36 0.13 0.02 0.60 Travel agency service 1.86 95 0.60 0.29 0.04 1.06 Retailing 6.79 157 2.38 1.92 0.12 4.97 Manufacturing Manufactured food 2.07 18 0.19 0.08 0.02 0.35 Clothing 0.51 9 0.11 0.03 0.00 0.15 Recreation equipment 0.84 11 0.16 0.18 0.00 0.37 Handicraft products 4.30 54 0.24 0.13 0.01 0.58 Rest manufacturing sectors 3.19 26 0.33 0.29 0.09 0.76 Farming, foresting, finishing 0.00 0 0.00 0.00 0.00 0.00 Utility 0.00 0 0.00 0.00 0.00 0.00 Construction 0.00 0 0.00 0.00 0.00 0.00 Total 27.46 558 6.81 3.79 0.43 12.79
Note The top 3 sectors are marked in gray.
The indirect economic effects of Chinese ferry-cruise passenger expenditure are displayed in Table 3. The total effects include $46.26 million in direct sales, 811 non-full time equivalent jobs, $10.66 million in personal income and $0.57 million tax dollars. The number one and two benefited sectors are still the retailing and the lodging sector, contributing the most in terms of jobs, personal income, profits and tax dollars. If we compare direct and indirect effects, services industries are the dominated beneficiaries. Table 3 Direct and indirect effects of Chinese ferry passengers, 2010 Unit: US$
Aggregate I-O sectors
Direct sales ($ million' s) Jobs Personal Income ($ million' s) Profit ($ million' s) Tax ($ million' s) Value added ($ million' s) Services Lodging 3.23 67 0.92 0.40 0.09 1.79
Food & beverage 2.32 66 0.73 0.32 0.02 1.17
Transportation 2.00 44 1.05 0.08 0.03 1.35
Leisure services 1.01 25 0.37 0.14 0.03 0.63
Retailing 9.20 210 3.22 2.63 0.16 6.74 Financial services 1.83 12 0.35 0.26 0.06 0.81 Other services1 3.08 59 1.04 0.45 0.03 1.72 Manufacturing Manufactured food 2.99 27 0.27 0.11 0.03 0.50 Clothing 0.56 10 0.12 0.03 0.00 0.16 Recreation equipment 0.91 11 0.17 0.20 0.00 0.40 Handicraft products 4.45 56 0.25 0.14 0.01 0.60 Rest manufacturing sectors2 10.09 68 1.10 1.18 0.13 2.76 Farming, foresting, finishing 1.36 54 0.35 0.23 -0.05 0.58 Utility 1.10 4 0.05 0.02 0.00 0.08 Construction 0.26 4 0.06 0.03 0.00 0.10 Total 46.26 811 10.66 6.50 0.57 20.47
Note: The top 3 sectors are marked in gray.
1 The aggregated sum of 14 service sectors. This is not included in the ranking. 2 The aggregated sum of 16 manufacturing sectors. This is not included in the ranking.
3 Travel decision for taking a ferry
Two questions were adopted to address the travel decision for Chinese ferry-cruise passengers, and to assess the potential of continuality in offering this niche product. The first question asked about the factors that drive people’s decision in taking a ferry on this trip. The top three influential considerations are “novelty”, “recommendation by the travel agency” and “recreational facilities on board” while “advertising” and “recommendation by friends and relatives” are least important. This pattern confirms that the newly available cross-strait ferry service is not well advertised in China, and that the number of previous customers is too few to create an effective “word of mouth” strategy among the target population. By the same token, the new product provides novelty experiences that most inbound Chinese tourists never get exposed to or feel interested in, along with recreational facilities that can be enjoyed on the ship.
The second question addresses the passengers’ preference in choosing the transportation mode to Taiwan next time. Around 60% of participants indicated that they would prefer air carriers for the round-trip transportation, while only 16% would remain a loyal customer and choose marine transportation. This result suggests a relatively low customer loyalty for the cross-strait ferry-cruise product and the number of repeated customers may not be optimistic. This pattern is also consistent with the first finding that the driving factor of novelty is the key consideration among visitors’ travel decision. The second-time ferry-cruise tour would not carry the same weight of freshness and the compelling force to take a ship would disappear, and the preferences change. This competing nature and a strong substitution from air travel poses an operation threat to the passenger shipping company. We further crosstab this question with demographics. Age is the only factor displaying a significant difference among transportation modes (p value =0.004). The marine transportation is preferred by the older generation (age 40 or above) while younger generation proportionally incline for an air carriers next time.
Ⅳ Discussion and Conclusion
importance of Chinese inbound visitors using the ferry-cruise mode to the Taiwan’s economy. In terms of subject matter, this study is the first attempt to address the direct and indirect economic effects of a new and emerging Chinese niche market from a Taiwan national perspective. For the IO methodology, a detailed breakdown of shopping expenses combined with the margining process based on a 50-sector Taiwan Input-Output framework is adopted to provide in-depth knowledge regarding shopping patterns and the associated influences on each sector.
The Chinese ferry-cruise market has demonstrated its economic importance in this study. The ferry-cruise passenger’s per capita spending is compatible to Chinese tourists using air carriers and also to New Zealand/Australian visitors at around $234 per person per night, second only to Japanese visitors ($269) among all inbound tourists to Taiwan. In 2010, the estimated total spending was US$30.1 million, and the total economic impacts, including direct and indirect effects, were estimated to be US$46.26 million in direct sales, 811 non-full time equivalent jobs, US$10.66 million in personal income and US$0.57million tax dollars. From the sector level, economic impacts of ferry-cruise passengers’ expenditure contribute the most to the service industries in Taiwan. The top three benefited sectors are retailing, the lodging sector, and travel agent services.
The high shopping tendency of ferry-cruise passengers observed in our study presents a unique pattern. This can be explained by the mandatory shopping stops on the trip as the furious price war among local travel agencies has forced businesses to operate under the break-even point and their losses have to be compensated through shopping commission. This low-price competition also leads to low quality arrangement of amenities and services, which downgrades the satisfaction level of Chinese tourists. From a long-term sustainable perspective, this low-price package fee strategy will not be a positive force in generating economic impacts to the region and will eventually lead to a drawback of market shares.
A low-willingness of repeat purchasing behavior is observed in our study based on the fact that only 16% of ferry passengers would like to choose round-trip marine transportation the next time they visit Taiwan. Air carriage, on the other hand, is strongly preferred, representing a competing nature and a strong substitution effect for ferry-cruise services. To alleviate the air capacity bottleneck using ferry services thus may not be efficiently implemented at the current stage. To further stimulate the usage rate of sea carriers, it is advised that shipping companies market their products to the elderly Chinese population and those tourists who crave novelty on various transportation modes. While the lower price package fee is not considered as the major driving factor for choosing a ferry in our sample population, the Cosco Star can position their products by 1) cooperating with local travel agencies in developing a flexible, comfortable and relaxing itinerary that is suitable for an elderly population; 2) strengthening the cabin facilities on the ship to accommodate an elderly population such as restroom safety facility and emergency warning systems; and 3) expanding recreational facilities over time on the ship so that first-time passengers would have a stronger desire for repeat patronage.
Given the economic contribution demonstrated in this study, the ferry-cruise market is worth investing and developing but how to maintain the novelty of the ferry experience and their competitiveness in relation to the air carriers would become a great challenge for the shipping companies as well as those stakeholders who desire to expand this niche market.
Acknowledgement
Assistances from Mr. Roger Hsu, Secretary General of the Travel Agent Association of Taiwan , and Mr. Gordon Kao, Assistant Manager of Cosco, Taiwan are highly appreciated. Financial support from the Taiwan National Science Council under NSC98-2410-H-390-029-SS2 is gratefully acknowledged.
References
Blanke, J., & Chiesa, T. (2011). The Travel & Tourism Competitiveness Report 2011. Geneva, Switzerland: World Economic Forum.
Chen, P.-T. (2004). Distribution of Tourism Economic Impact: An Application in Penghu Islands, Taiwan. Journal of Outdoor Recreation Study, 17(2), 23-48.
Chen, P.-T., Liu, Y.-A. A., Huang, C.-H., & Chang, W.-C. (2008). Estimating Economic Impacts of Hsinchu City Meat Ball Festival. Journal of Sport, Leisure and Hospitality Research, 3(3), 121-140.
Civic Aeronautics Administration. (2011). 兩岸直航資訊專區 Retrieved Sep 24, 2011, from http://www.caa.gov.tw/big5/content/index.asp?sno=570
Council for Economic Planning and Development. (2002). Challenge 2008- National Development Plan (Vol. 2003): Executive Yuan, Taiwan, R.O.C.
Jeng, H.-Y., & Lee, Y.-Y. (2003). Evaluation of the Regional Economic Impacts of Whale-watching Ecotourism on Hua-Tung Area in Taiwan. Journal of Agricultural Economics, 73, 1-34. Li, C.-J., & Chuang, H.-C. (2008). The Economic Benefits of Tourism Events: The Case of Sun Moon
Lake FACV Sakura Festival 2007. Journal of Tourism and Leisure Studies 14(1), 1-27. Miller, R. E., & Blair, P. D. (1985). Input-output analysis: Foundations and extensions. Englewood Cliffs,
N.J.: Prentice-Hall.
Sun, Y.-Y. (2005). Marginal economic impacts of inbound tourism to Taiwan and policy evaluation. Asia Pacific Journal of Tourism Research, 10(3), 309-327.
Taiwan Tourism Bureau. (2009). Project Vanguard for Excellence in Tourism. Taipei: Ministry of Transportation and Communications.
Taiwan Tourism Bureau. (2010). Visitor Arrivals Retrieved Dec 15, 2010, from http://admin.taiwan.net.tw/statistics/File/200912/table01_2009.pdf
Taiwan Tourism Bureau. (2011a). Statistics Retrieved Apr 23, 2011, from http://admin.taiwan.net.tw/statistics/release_en.aspx?no=7
Taiwan Tourism Bureau. (2011b). 陸客來臺自由行政策說明 Retrieved Sep 27, 2011, from http://www.mac.gov.tw/public/Attachment/162216102390.pdf
Wu, T.-C., & Pan, C.-M. (2004). Estimating Visitor Expenditures and Economic Output Effects--A Case Study of the International Children's Folk Art Festival. Journal of Outdoor Recreation Study, 17(1), 1-21.
Yang, H.-Y., & Chen, K.-H. (2009). A general equilibrium analysis of the economic impact of a tourism crisis: A case study of the SARS epidemic in Taiwan. Journal of Policy Research in Tourism, Leisure and Events, 1(1), 37-60.