國
國
國
國 立
立
立
立 交
交
交
交 通
通
通
通 大
大
大 學
大
學
學
學
生醫工程研究所
碩士論文
高頻率穩態視覺誘發電位對人眼視網膜中央窩
與其外圍的反應
High-Frequency Steady-State Visual Evoked
Potentials from the Foveal and Extrafoveal
Regions of Human Retina
研 究 生:杜貫仲
指導教授:林進燈 博士
邵家健 博士
高頻率穩態視覺誘發電位對人眼視網膜中央窩
與其外圍的反應
High-Frequency Steady-State Visual Evoked
Potentials from the Foveal and Extrafoveal
Regions of Human Retina
研 究 生:杜貫仲 Student:Kuan-Chung Tu
指導教授:林進燈 博士 Advisor:Dr. Chin-Teng Lin
邵家健 博士 Dr. John K. Zao
國 立 交 通 大 學
生 醫 工 程 研 究 所
碩 士 論 文
A Thesis
Submitted to Institute of Biomedical Engineering College of Computer Science
National Chiao Tung University in partial Fulfillment of the Requirements
for the Degree of Master
in
Computer Science June 2012
Hsinchu, Taiwan, Republic of China
高頻率穩態視覺誘發電位對人眼視網膜中央窩與其外圍的反應
學生: 杜貫仲 指導教授:
林進燈 博士
邵家健 博士
國立交通大學生醫工程研究所 碩士班
摘 摘摘 摘 要要要 要在腦機介面(brain-computer interface, BCI)的領域,穩態視覺誘發電位(SSVEP) 是其中一種被實現的應用技術:不同的頻率閃爍刺激人類視覺,擷取其腦電訊號 (electroencephalogram, EEG)去辨識使用者凝視的刺激物,執行其相對應的指令。 本研究將探討穩態視覺誘發電位的現象,從頻率 5 Hz 到 65 Hz 以 5 Hz 為間隔的 白光二極體(LED)閃爍,刺激視網膜中央窩(視角 2°°°°)和其外圍(視角 16-18°°°°)。8 位 受測者(年齡 20~55 歲)參與本實驗,戴著 64 電極腦波帽收集腦電訊號。實驗過 程中,受測者主觀對於刺激物的閃爍和舒適度的感覺將會被記錄,並做進一步的 探討。在頻譜分析和標準關係數分析的結果中,顯示頻率 25 Hz 至 45 Hz 之間仍 然有相當好的訊雜比(signal-to-noise ratio, SNR)。另外,大部分的受測者對 30 Hz 至 45 Hz 之間的頻率感到舒適和較少的閃爍。本次實驗研究證明,燈光閃爍在人 類視覺閃爍融合的閾值以上仍可作為有效且舒適的視覺刺激,提供穩定視覺誘發 電位在腦機介面實際應用上的重要參考。 關鍵字:腦機介面、肌電訊號、視覺刺激、穩態視覺刺激、高頻率穩態視覺刺激、 中央窩、中央窩外圍、雜訊比
High-Frequency Steady-State Visual Evoked Potentials from the Foveal
and Extrafoveal Regions of Human Retina
Student: Kuan-Chung Tu Advisors: Dr. Chen-Teng Lin
Dr. John K. Zao
Institute of Biomedical Engineering
College of Computer Science
Nation Chiao Tung University
Abstract
To understanding the brain functions via the brain-computer interface (BCI), here, we studied the steady-state visual evoked potentials (SSVEP) from retinal fovea and extrafoveal in response to a 2° circular and a 16°–18° annular white light stimuli flickering between 5 and 65 Hz by 5 Hz increments. Eight subjects (age 20~55 years old) participated in this experiment. Their EEG signals were recorded using a commercial 64-channel NeuroScan system. Their flickering perception and comfort levels were also studied. Spectral and canonical correlation analyses of SSVEP signals collected from nine EEG channels in the occipital area showed distinctively higher signal-to-noise ratios (SNR) in the foveal responses between 25 and 45 Hz. The findings from the subjects also indicate that the less flickering and felt are more comfortable with stimulation flickering between 30 and 45 Hz. These empirical
evidences suggest that lights flashing above human vision flicker fusion thresholds can be potentially used as an effective visual stimuli tool in SSVEP BCI applications.
Keyword: Brain-computer interface (BCI), Electroencephalogram (EEG), Visual
evoked potential (VEP), Steady-state visual evoked potential (SSVEP), High frequency steady-state visual evoked potential (HF-SSVEP), fovea, extrafoveal, Signal-to-noise ratio (SNR).
致
致
致
致 謝
謝
謝
謝
研究所的生活,因為相遇而精彩 在剛搬到新竹的階段,偶然得知早已失聯許久的高中同學也考上了附近的大 學,在他鄉遇舊識的情感下,迫切的約出來並相認了,從此我的生活也終於與你 們一起並肩而行了,能夠一起打打球,聊聊天,看看妹,出出遊,看看某某某某某某某某某某某某被 噹,也是滿有趣的。希望能與你們時常連絡感情。 實驗室裡的氣氛我還滿喜歡的,一起為課業奮鬥、為研究討論和定麥當當。 又或是,聊一些實驗室裡的奇聞軼事或是奇人異士,格外有趣。實驗室裡每個人 都非常好相處,也很慶幸能在這裡待在這裡研究。有很不錯的學長跟我們討論, 有非常好的同學一起開場。點點滴滴,或許就跟我以前夢想的研究所生活有幾分 的相似。 實驗室很特別,可以看到很多全職的工作者與助理。因此,也認識了同學以 外的朋友。相遇是一種緣分,能相處更是難得,真的很開心能跟你們一起吃飯、 分享和出遊。我也會以謙卑的心珍惜這一段非常有意義的過往。 想想當初剛升上研究所,找不到人打球的窘境。因為一個板上的研究所新生 盃找人的推文,加上厚臉皮,參加系籃的練球,而得到一個轉機。現在,我認識 了一群愛好籃球,個性溫和頭好壯壯的肌肉人,在這裡打球不會寂寞。最後,非 常開心能跟系隊的朋友一起拿到北資盃的獎盃,這兩天的奮鬥的過程,我想足夠 老了的時候不斷重複的拿來說嘴。 因為計畫的合作,接觸到不同的實驗室,因此認識到光電所的同學,跟你們 接觸,讓我認識到很正面研究態度,幫助真的很大。能跟你們共事,非常的開心。 有你們,能讓整個團隊能互相激盪而且更加團結。 每次看到有一些朋友要為了存生活費而打工,就會想到父母親對我的愛護。 給我足夠的補給,好讓我只要專注在學業與研究上,而不需要有其他煩惱。雖然 曾經有打工,但父母還是讓我存起來當零用錢,希望我能用好的吃好的。父母也 都會適時的關心我現在的生活狀況和研究上的問題,我真的很感動。謝謝您們! 也非常愛你們。最後,謝謝兩位老師的指導,學生受益良多! 當初種種人生的選擇,我真的是選對了。能遇見你們,樂不可言。Table of Contents
摘 要... I Abstract ... II 致 謝...IV Table of Contents ...V Tables ...VII Figures...VIII I. Introduction ... 1 1.1 Problem statement ... 1 1.2 Motivations ... 21.3 Organization of Thesis Outline ... 3
Ⅱ. Background ... 4
2.1 Related Works ... 4
2.2 Principle of SSVEP ... 8
2.3 Brain structures and functions ... 9
2.4 Fovea and extrafoveal vision ... 10
Ⅲ. Materials and Methods ... 13
3.1 Experiment Set up ... 13
3.2 Participants ... 16
3.3 Electrode Cap ... 17
3.4 Stimulus ... 18
3.4 EEG acquisition device ... 20
3.4 Data acquisition ... 21
Ⅳ. Results and Discussions ... 23
4.1 Analyses ... 23
4.2 Method of Analysis ... 25
4.2.1 Fast Fourier Transform ... 26
4.2.2 Canonical Correlation Analysis ... 26
4.2.3 Signal-to-Noise Ratio... 27 4.3 Spectral analysis... 29 4.4 SNR response ... 31 4.5 Flicker Perception ... 39 4.6 CCA response... 41 4.7 Classifier ... 46
Ⅴ. Contribution and Future Works ... 48
5.1 Contribution and Implication ... 48
Appendix ... 51 Reference ... 55
Tables
Table 1. Functions of different lobes ... 10
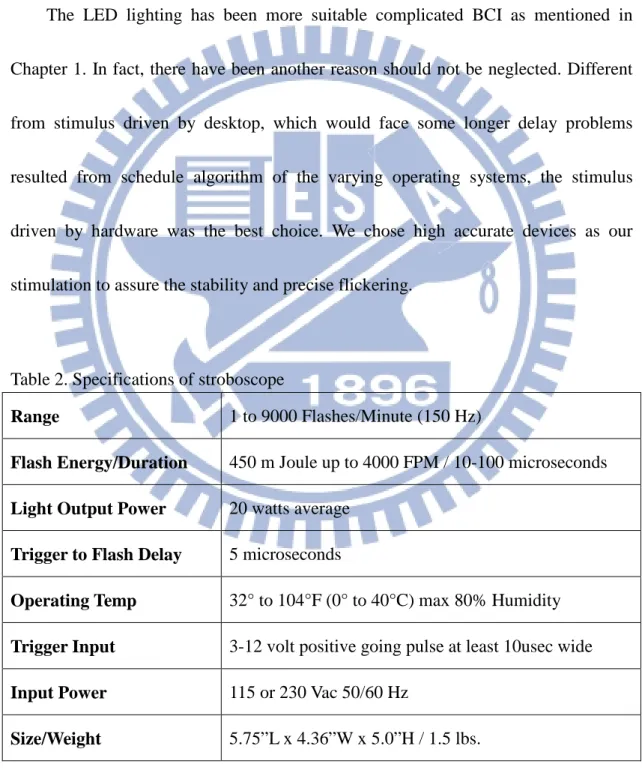
Table 2. Specifications of stroboscope ... 19
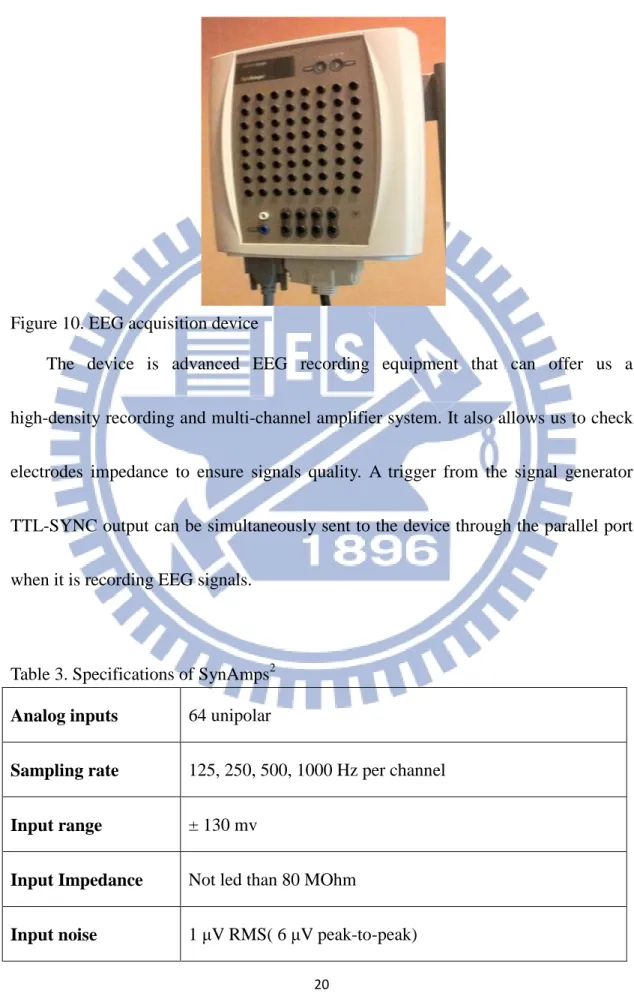
Table 3. Specifications of SynAmps2 ... 20
Table 4. Subjective stimulus flickering scores ... 22
Table 5. Individual fovea SNRs of 3 channels ... 51
Table 6. Individual extrafoveal SNRs of 3 channels ... 52
Table 7. Individual fovea flickering scores ... 53
Figures
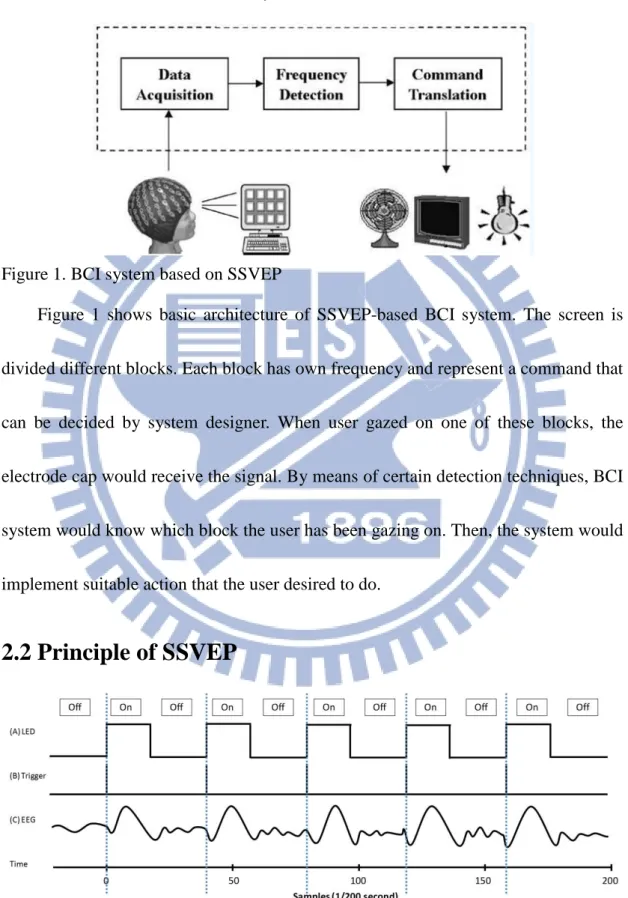
Figure 1. BCI system based on SSVEP ... 8
Figure 2. (A) LED (B) Synchronized triggers (C) EEG schematic responses ... 8
Figure 3. Lobes of brain ... 9
Figure 4. Distribution of ganglion cell thickness in central retina: foveola, (a) foveal avascular, (b, c) fovea centralis, (d) parafovea and (e) perifovea (extrafoveal) [46] ... 12
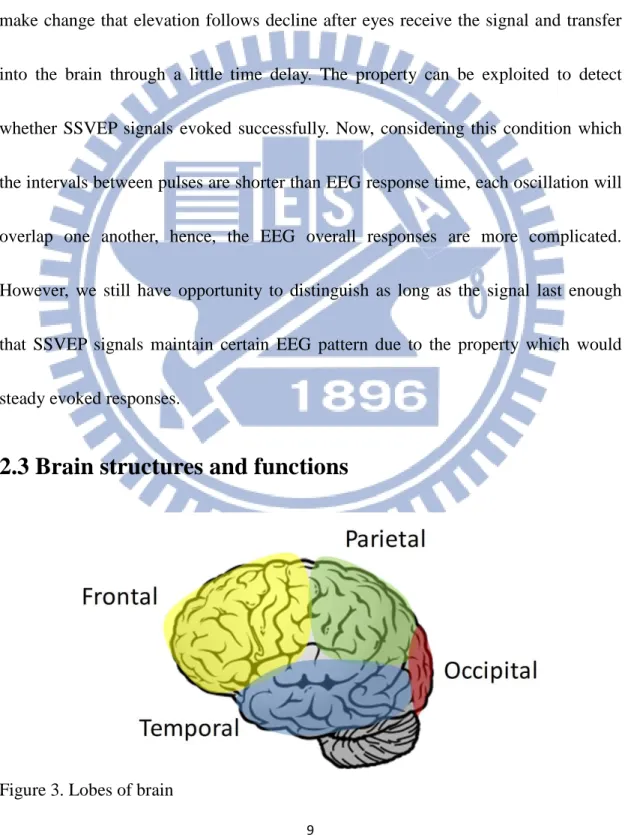
Figure 5. Distribution of cones and rods in a typical human retina [46] ... 12
Figure 6. Block diagram of experiment set-up ... 13
Figure 7. Two visual stimulation patterns: (A) a 2° circular/centered light pattern and (B) a 16°–18° annular/ring shaped light pattern ... 15
Figure 8. (A) The 64–channel system (B) International 10-20 system ... 17
Figure 9. Monarch MVS 115230 Stroboscopes ... 18
Figure 10. EEG acquisition device ... 20
Figure 11. Flow of data analysis (A) FFT analysis (B) CCA analysis ... 23
Figure 12. Amplitude spectrum (A) 1 second (B) 50 segments average (C) 50 segments synchronized averaging... 24
Figure 13. Distribution of SSVEP signal-to-noise ratios in response to foveal (red) and extrafoveal (blue) stimuli between 5 and 65 Hz ... 30
Figure 14. Distribution of SSVEP signal-to-noise ratios in response to fovea (red) and extrafoveal (blue) stimuli between 5 and 65 Hz ... 31
Figure 15. Distribution of SSVEP signal-to-noise ratios differences of two patterns stimulus between 5 and 65 Hz ... 33
Figure 16. Topography of average SSVEP signal-to-noise ratios in response to (A) foveal and (B) extrafoveal stimuli (C) differences ... 36
Figure 17. Topography of 60 Hz signal-to-noise ratios (A) foveal and (B) extrafoveal stimuli ... 38
Figure 18. Evaluation of subjects’ flicker perception (red and blue bars denote their responses towards center and ring stimuli respectively) ... 39
Figure 19. Averaging CCA coefficients of SSVEP responses towards (A) foveal and (B) extrafoveal stimuli between 5 and 65 Hz ... 42
Figure 20. Averaging CCA weight value of SSVEP responses towards (a) foveal and (b) extrafoveal stimuli between 5 and 65 Hz ... 44
I. Introduction
1.1 Problem statement
Low-frequency lights as stimuli have been usually applied in steady-state visual evoked potential (SSVEP) -based brain–computer interface (BCI) system. Those responses seem easier to be captured because the amplitude of brain wave has large amplitude in low frequency band. However, low flashing stimuli always make users inevitable annoying. A practical and acceptable system is definitely necessary designed from the viewpoint of user. In light of these concerns, we design a complicated experiment involving wide range frequency stimulations, subjects’ feeling and different stimulated visual areas. Therefore, we can provide a full survey that is really helpful for developers that dedicate in SSVEP-based BCI system.
Human fovea or central vision produces strong SSVEP responses that have already been proved in previous studies [1, 2]. Our hypothesis was that due to its high photopic visual acuity, fovea centralis should be capable of producing detectable SSVEP in response to stimuli flashing above flicker fusion thresholds. Although these responses may be weaker than those in the alpha band, they can still yield appreciable SNR since other asynchronous EEG signals also diminish in strength. With that assumption, we
set out to measure the signal-to-noise ratios (SNR) of human fovea SSVEP responses and compare them with those from the extrafoveal region. The results help us realize SNR distribution for all head to two visual fields. Beyond that, all subjects will give a feedback after each stimulation session. Then, we can know the subjects’ feeling to these stimuli. Finally, the results will be showed in comprehensive aspects and the experiment offers sufficient information to solve the problems as we mentioned.
1.2 Motivations
SSVEP and their P300-based counterpart, flash visual evoked potentials (FVEP) [3, 4] are perhaps the most common exogenous brain computer interface techniques.In order to evoke strong responses, these techniques often use low-frequency light signals as visual stimuli: below 2 Hz for FVEP and within the alpha band (8-13 Hz) for SSVEP. These low frequency signals, however, can cause visual fatigue [5], migraine [6] and occasionally seizure among the subjects. To conquer these issues, efforts have therefore been made to establish high-frequency SSVEP that uses stimuli above human vision flicker fusion threshold as a viable alternative. Limited success has been achieved so far due to the fact that SSVEP decreases rapidly as stimulation frequency increases. In this experiment, we investigated the possibility of exploiting the acuity of foveal vision to beat the odds against HF-SSVEP.
1.3 Organization of Thesis Outline
The rest of this study is divided into four sections. The brief introduction of this study, principle of SSVEP, brain structure, and retinal physiology was included in Chapter II to justify the experiment. The experiment setup, participants, detailed device description and data acquisition were documented in Chapter III. Signal processing using fast Fourier transforms (FFT), canonical correlation analysis (CCA) and classifier techniques were also introduced and discussed in Chapter IV. Contribution and future work were summarized in Chapter V.
Ⅱ
Ⅱ
Ⅱ
Ⅱ. Background
2.1 Related Works
A BCI is a direct communication pathway between the brain of a human and an external device without muscles (hands, fingers and voice). By means of the technology, humans’ intention can be translated to a control signal to communicate with external devices, namely directly interaction between neurons and devices [7]. It is known that BCIs have been commonly used to be an assistive device for the severe motor disabilities, to execute daily routine as long as their motor cortices were still intact. More than that, BCIs also have great benefits in the other fields such as military and entertainment [8]. Nowadays, BCIs have already been seen as an important technology that certainly brings us significant progress in the future.
Noninvasive electroencephalogram (EEG)-based BCI, is one of the mostly popular investigated directions, due to it provide high spatial-temple resolutions, ease of acquisition and more viable. There has been many EEG sources used for BCIs control, such as event-related synchronization/ desychronization (ERS/ ERD), mu, alpha and beta rhythm, slow cortical potential (SCP), visual evoked potentials (VEP), SSVEP and P300 evoked potential [7, 9, 10]. According the previous studies [11-13] , they both indicated that the method of SSVEP is an indeed promising way to study
the BCI studies, comparing with others. That is, in this study, we focused on SSVEP in BCI application.
In recent years considerable concern has arisen over the system based on VEP in BCI research [11, 12, 14-20]. VEP is an electrical potential fluctuation caused by visual stimulation. The potential can be recorded via the scalp electrodes placed on heads, usually generated from the occipital region because of brain functioning structure. On the basis of stimulation flickering approaches [21], BCIs based on VEP could be essentially categorized by three groups: time modulated VEP (t-VEP), frequency modulated VEP (f-VEP) and pseudorandom code modulated VEP (c-VEP). F-VEP was also called SSVEP because these repetitive stimuli with a certain fixed frequency provide continuously stable signals to human brain over eyes. So far, human EEG in response to flickers have been already explored to 100 Hz in 2001 [22] that was a significant reference to realize mankind’s responses to the SSVEP. The study did a physiology exploration whereas practical application should be concerned. Apart from the frequency difference, the contours of stimuli also give human optical nerve cell different level effects. In [23] has further shown that there have been three types in SSVEP research: light stimuli, single graphics stimuli, and pattern reversal stimuli. Different kinds lead to different responses strength as well. The pattern reversal stimulus seems to evoke stronger SSVEP signals than others.
Because of higher information throughput and less training time than other brain signals [24, 25], SSVEP-based BCI has become valuable applications. The first SSVEP-based BCI system was proposed in 1996 [26] though this system had only one stimulus (13.25 Hz) produced by fluorescent lights. The article also pointed that human factors would be a huge challenge but provide potential opportunities for more complex and efficient BCI system. In addition, the different colors were involved in the stimulation design of SSVEP in 2001 [27]. The study discussed about brain responses of mixed-colors with two different stimulation frequencies, which still evoked successful SSVEP. Based on frequency of the stimulus, SSVEP-based BCI system could also approximately classify into 3 ranges: low frequency (1-12 Hz), medium frequency (12-30 Hz), and high frequency (30-60 Hz) [23]. Low frequency and medium frequency systems have predominantly been applied in SSVEP-based BCI system to date because it was more easily detectable.
Heretofore, there were two kinds of devices that have been commonly used to rendering signals, LED [28-35] and CRT [11, 12, 18, 36-38]. Furthermore, [39] indicated that LED was more suitable for highly complicated BCI system (more targets). In contrary, the number of targets was limited by using a CRT monitor refresh rate. The refresh rate R means the number of times that the monitor redraws the screen per second, is usually below 100 Hz (for LCD monitors it is usually 60 Hz),
and only lower than R/2 Hz frequencies can be used as targets [40].
An offline analysis has shown that utilizing the high frequency band could be very promising [41] even though human cannot perceive stimulus flickering. Therefore, the high frequency band can be highly expected to be applied in SSVEP-based BCI system in the future and should definitely and deeply be researched. It was able to finish some specific tasks on a reliable system [25, 42] for a decade development.
In practical, system performance is always in considering. The research usually evaluated performance by two indicators, signal-to-noise ratio (SNR), discussed in offline analysis and transfer information rate (ITR, bit rate) [43], discussed in real-time system. Both indicators are closely related that SNR improvement will enhance detection accuracy, and ITR will improve in the following. Actually, ITR was an evaluation in telecommunication about messages containing user information from a source to a sink. BCIs can also be seen as a communication channel between brains and external devices. As a result, ITR can therefore be regard as a criterion of evaluation for BCI systems performance. The bit rate B can be express as
] 1 1 [ log ) 1 ( log log2 2 2 − − − + + = N P P P N B ,
N is the number of targets and P is the accuracy of target selections. B multiplied by
selecting speed is the transfer rate (bits per minutes) [12]. For example, there are 4 (1)
targets, one selection is performed every 2 s; the ITR of the online system can reach 41.17 bits/m if the detection accuracy is 90 %.
Figure 1. BCI system based on SSVEP
Figure 1 shows basic architecture of SSVEP-based BCI system. The screen is divided different blocks. Each block has own frequency and represent a command that can be decided by system designer. When user gazed on one of these blocks, the electrode cap would receive the signal. By means of certain detection techniques, BCI system would know which block the user has been gazing on. Then, the system would implement suitable action that the user desired to do.
2.2 Principle of SSVEP
Figure 2 shows the EEG schematic responses to the 5 Hz stimulus in a second under the situation that the potential evoked by each pulse do not overlap. We can clear find that, when LEDs with 50 % duty cycle start to flicker, trigger will be sent simultaneously and each pulse will also have one (blue dot line). The EEG will hence make change that elevation follows decline after eyes receive the signal and transfer into the brain through a little time delay. The property can be exploited to detect whether SSVEP signals evoked successfully. Now, considering this condition which the intervals between pulses are shorter than EEG response time, each oscillation will overlap one another, hence, the EEG overall responses are more complicated. However, we still have opportunity to distinguish as long as the signal last enough that SSVEP signals maintain certain EEG pattern due to the property which would steady evoked responses.
2.3 Brain structures and functions
The brain structure is given in Figure 3. Human brain consists of 4 portions. One of those, the cerebrum or cortex is the largest part of the human brain that associated with higher brain functions such as thought and action. The cerebral cortex also can be divided into four sections, called “lobes”: The frontal lobe, parietal lobe, occipital lobe, and temporal lobe. Table 1 shows the functions of the portions of a brain. According to the Table, VEP responses should mainly occurred in occipital lobe. Table 1. Functions of different lobes
Lobs Functions
Frontal lobe reasoning, planning, parts of speech, movement, emotions, etc.
Temporal lobe perception and recognition of auditory stimuli, memory, etc.
Parietal lobe movement, orientation, recognition, perception of stimuli
Occipital lobe visual processing
2.4 Fovea and extrafoveal vision
The central region of human retina can be divided into foveola, foveal avascular
zone, fovea centralis, parafovea and perifovea [44, 45]. Together, they form the 5 mm
wide macula lutea or the “yellow spot”. According to Iwasaki and Inomata [46], these regions can be distinguished based on the thickness of their ganglion cell layers [Figure 4]. Foveola, approx. 0.35 mm in diameter and occupied 1° of vision field, has no ganglion cell and capillary. The foveal avascular zone, approx. 0.5 mm in size and
occupies 2° in vision field, has a ganglion cell layer approx. 15 µm in thickness but no superficial capillary. These retinal regions produce the most acute photopic vision. The
parafoveal region has the thickest layer of ganglion cells (up to 50 µm) and is filled with superficial capillaries. Ganglion cells thin down to 15 µm in the perifoveal region, which offers suboptimal visual acuity. The density of color photoreceptors, the “cones”, also varies along with photopic vision acuity. As shown in Figure 5, foveola is occupied entirely by cones. Beyond that region, cone density diminishes drastically from 50 to 12 per 100 mm2 between fovea centralis and perifovea. Almost 50 % of all optical nerve fibers from each eye carry signals from the foveal regions to the visual cortex. The peripheral retinal area, known as extrafovea, delivers compressed visual information of significantly lower resolution. It is filled with photoreceptors, known as
the “rods”, for scotopic vision. The rod density peaks between 15° and 20° of the vision field, roughly coincides with the position of the “bind spot”.
The flicker fusion thresholds or critical flicker fusion (CFF) rates of human vision also differ notably with respect to different photoreceptors and retinal regions. The maximum fusion frequency for rod mediated vision reaches a plateau at approx. 15 Hz, whereas cones reach a plateau of approx. 60 Hz under high illumination intensity [47]. Different cone cells also have different CFF rates: green (M) cells have
the highest rate of approx. 50 Hz while red (L) and blue (S) cells have the lower rates in the neighborhood of 30 Hz.
Figure 4. Distribution of ganglion cell thickness in central retina: foveola, (a) foveal avascular, (b, c) fovea centralis, (d) parafovea and (e) perifovea (extrafoveal) [46]
Ⅲ
Ⅲ
Ⅲ
Ⅲ. Materials and Methods
3.1 Experiment Set up
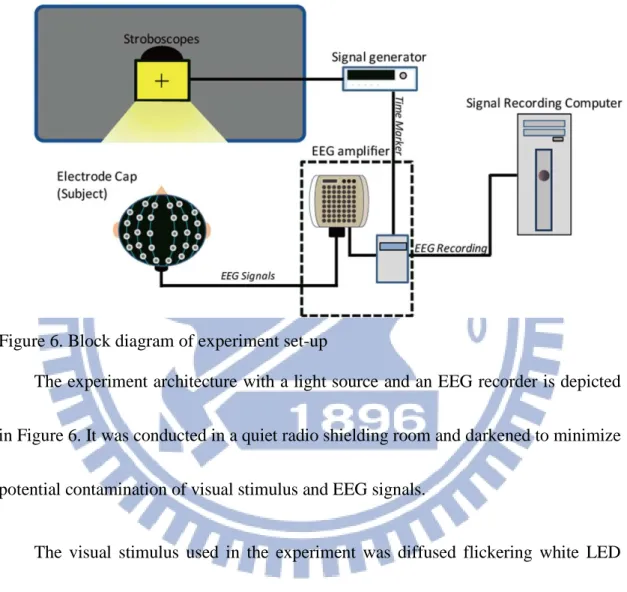
Figure 6. Block diagram of experiment set-up
The experiment architecture with a light source and an EEG recorder is depicted in Figure 6. It was conducted in a quiet radio shielding room and darkened to minimize potential contamination of visual stimulus and EEG signals.
The visual stimulus used in the experiment was diffused flickering white LED light with 170 cd luminance and (0.305, 0.373) CIE 1931 xy coordinates. The light source was an LED powered stroboscope (MVS 115/230, Monarch Germany) driven by a waveform generator (33210A, Agilent USA) with programmable signal frequencies and duty cycles. The light was projected onto a Mylar-covered translucent viewing screen erected 60 cm in front of the subject.
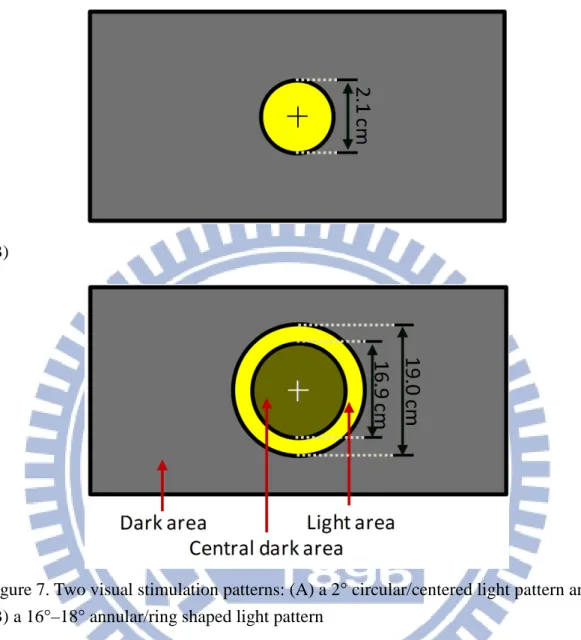
Two different visual stimulation patterns were used in this experiment [Figure 7]:
(a) a 2.1 cm or 2° circular or centered light source for arousing the foveal avascular
zone, and (b) a 16.9~19.0 cm or 16°~18° annular or ring shaped light source for stimulating the extra-fovea region.
EEG signals were captured using a 64-channel electrode cap (Quik-Cap, NeuroScan USA), an average of both mastoids that behind ears, was set as reference electrodes, a EEG acquisition device (SynAmps2,NeuroScan USA), responsible for receiving and amplifying the EEG signals, and saved the data using the dual-core computer that installed EEG software (Scan 4.5, NeuroScan USA). The electrodes were placed according to the International 10–20 system. Moreover, the TTL-SYNC signal produced by the waveform generator was fed into the EEG recording system and used as “time ticks” to mark the firing of the light pulses.
In order to strictly confirm our stimuli had perfect flickering, amplifier photodetector (PDA100A, THORLABS USA) and oscilloscope (TDS 2014B, Tektronix USA) have been used to inspect waveform of the signals. Chroma meter (CS-100, MINOLTA JPN) was used to examine luminance and CIE 1931 xy coordinate.
(A)
(B)
Figure 7. Two visual stimulation patterns: (A) a 2° circular/centered light pattern and (B) a 16°–18° annular/ring shaped light pattern
Two patterns consist of two materials, diffuser and foam board: one was used for unifying illumination of the graph and preventing light going through the subject’s eyes directly and the other was cut to modulate contour of the stimulus.
The patterns were designed based on measured curves density [Figure 5]. There was a cross on the center that would help subjects to concentrate on the stimulus. It was noted that both patterns had the approximate luminance. For ring pattern, we checked luminance of four points-top, down, left and right.
3.2 Participants
Eight healthy subjects (seven males and one female) with ages between 20 and 55 years old (mean: 27.7 years old, standard deviation: 11.8 years old) participated in the experiment. All subjects had normal or corrected-to-normal vision and suffered no vision impairment. To avoid complication, each subject was also confirmed to be comfortable with flashing lights and had no epileptic seizure in both personal and family medical history. All subjects were told the objectives, the potential risks and the detail procedures of the experiment and asked to sign an informed consent form before their participation.
3.3 Electrode Cap
(A)(B)
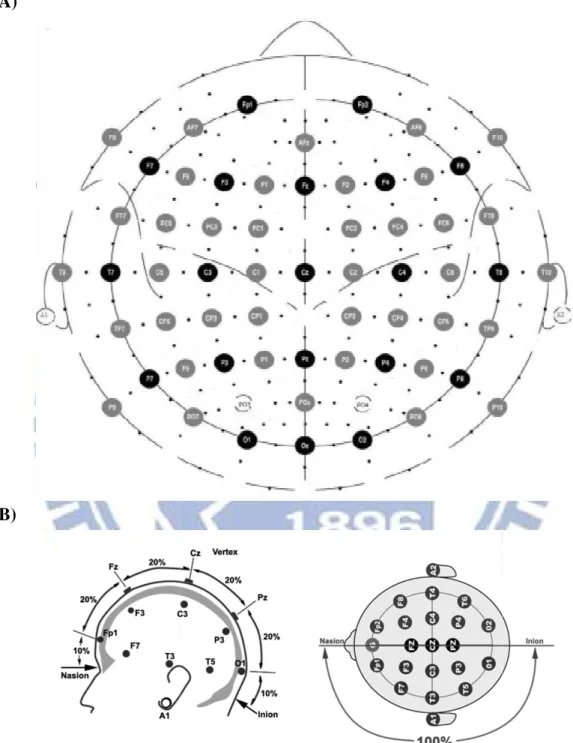
Figure 8. (A) The 64–channel system The 64 channels with 10
system is recognized standard to deploy electrodes on the scalp in EEG experiment. The letters F, T, C, P, and O stand for frontal, temporal centr
channel system (B) International 10-20 system The 64 channels with 10–20 international system are presented in
system is recognized standard to deploy electrodes on the scalp in EEG experiment. The letters F, T, C, P, and O stand for frontal, temporal central, parietal and occipital 20 international system are presented in Figure 8. The system is recognized standard to deploy electrodes on the scalp in EEG experiment. al, parietal and occipital
lobe.
Three kinds of cap can be used: 32–channel, 64–channel and 128–channel. The 64–channel system has been used in the experiment. The system has 9 channels in occipital lobe, which was enough to the following analysis, is greater than 6 channels of 32–channel system. The 128–channel system is not in our options because of time-consuming problem. Every electrode has to be injected gel to ensure impudence is lower than 5 ohm.
3.4 Stimulus
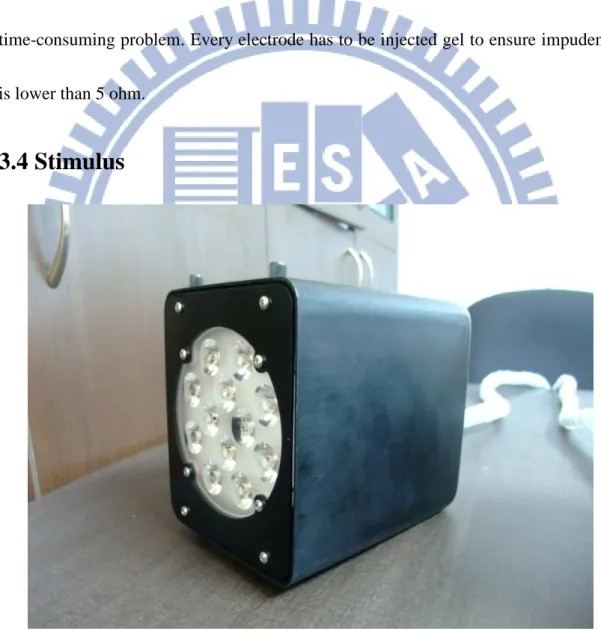
Figure 9. Monarch MVS 115230 Stroboscopes
The stroboscope is given in Figure 9. The stroboscope was driven by a waveform generator. To avoid noise as far as possible, the device was wrapped by copper wire
and connected it to the ground. Power cable also did the same protective measure. The device might be so exhausted that had a huge impact on the performance. After each round of the experiment, the device had to rest a period time that make sure to keep in good condition.
The LED lighting has been more suitable complicated BCI as mentioned in Chapter 1. In fact, there have been another reason should not be neglected. Different from stimulus driven by desktop, which would face some longer delay problems resulted from schedule algorithm of the varying operating systems, the stimulus driven by hardware was the best choice. We chose high accurate devices as our stimulation to assure the stability and precise flickering.
Table 2. Specifications of stroboscope
Range 1 to 9000 Flashes/Minute (150 Hz)
Flash Energy/Duration 450 m Joule up to 4000 FPM / 10-100 microseconds
Light Output Power 20 watts average
Trigger to Flash Delay 5 microseconds
Operating Temp 32° to 104°F (0° to 40°C) max 80% Humidity
Trigger Input 3-12 volt positive going pulse at least 10usec wide
Input Power 115 or 230 Vac 50/60 Hz
3.4 EEG acquisition device
Figure 10. EEG acquisition device
The device is advanced EEG recording equipment that can offer us a high-density recording and multi-channel amplifier system. It also allows us to check electrodes impedance to ensure signals quality. A trigger from the signal generator TTL-SYNC output can be simultaneously sent to the device through the parallel port when it is recording EEG signals.
Table 3. Specifications of SynAmps2
Analog inputs 64 unipolar
Sampling rate 125, 250, 500, 1000 Hz per channel
Input range ± 130 mv
Input Impedance Not led than 80 MOhm
3.4 Data acquisition
During the experiment, each subject sat in a comfortable chair, placed his/her head on a chin-rest and stared at the diffused light patterns appeared on the viewing screen. A sequence of circular (centered) and annular (ring) shaped stimuli flickering at frequencies between 5 and 65 Hz by 5 Hz increments were shown at random on the screen. The two stimulation patterns had to alternately stimulate the subjects in several trails, by this way that was to avoid fatigue influencing the results. Each stimulation session lasted one minute and was separated from one another with half-minute rest periods. The experiment totally cost about 40 minutes. Each subject was had to repeat the experiment with two different randomized sequences on two separate days in the time of the day when they were most alert. Their responses to the same stimuli were merged together during data analysis.
A waveform generator had to be modulated manually. In order to accomplish the experiments smoothly, two researchers had to participate in the experiment. One had to stay in the shield room to modulate the signal generator and remind the subject when to rest and gaze. The other had to stay outside to operate the computer that was used for recording the EEG signals and told the person in the shielding room which next frequency would be modulated.
Beside of recording their SSVEP signals, we also noted each subject to rate their feeling and comfort level towards the flickering stimuli in each session based on the following five point scale:
Table 4. Subjective stimulus flickering scores
Scores Feeling 1 Imperceptible
2 Perceptible but not annoying 3 Perceptible and slightly annoying 4 Quite annoying
Ⅳ
Ⅳ
Ⅳ
Ⅳ. Results and Discussions
4.1 Analyses
Figure 11. Flow of data analysis (A) FFT analysis (B) CCA analysis
The SSVEP signals of each subject were analyzed using both FFT and CCA techniques. Figure 11 depicts the standard procedure for analyzing the SSVEP signals, which include preprocessing (band pass filter 1-85 Hz and down sampling 1000 to 200 Hz), signal segmentation, 110 s (0~5 s and 115~120 s were be discarded and 1 second as 1 epoch), artifact removal (muscle activity and eye movement) and epoch averaging.
Although signals captured from all 64–channel were processed, special attention was paid to the nine occipital channels: P1, PZ, P2, PO3, POZ, PO4, O1, OZ and O2. Only the signals from those channels related to visual processing were used in CCA analysis. In order to study individual differences as well as the general trends, SSVEP of each subject and their averages have gone through both FFT and CCA analyses after they were segmented and preprocessed to remove artifacts.
Figure 12. Amplitude spectrum (A) 1 second (B) 50 segments average (C) 50 segments synchronized averaging
The flow of analysis is called synchronized averaging or Event-related potential (ERP) which needs phase-locked and stimulus-locked signal, uncorrelated noise and multiple realizations of the signal or event of interest. Important information after the step will reserve with a large number of segment signals. SSVEP signal is assumed
(A)
(B)
phase-locked; therefore, we averaged all epochs before calculating amplitude spectrum. Figure 12 shows the capability of synchronized averaging. Amplitude spectra of an EEG signal were acquired during 15 Hz visual stimulation. The amplitude spectrum of SSVEP responses had three peaks at fundamental frequency, 15 Hz, and harmonics, 30 Hz and 45 Hz. In comparison with these spectra, we could find that (A) reflected all frequencies component of a second epoch, (B) completely took on other frequencies content, and (C) had distinctive 15 Hz peak. The most different frequency component was that (B) had a peak at 10 Hz that higher than 15 Hz, the reason was that humans usually have strongest alpha rhyme (8-13 Hz) when stay “rest” state. (C) did not have 10 Hz component as (B) because 10 Hz was not phase-locked. In conclusion,
synchronized averaging could eliminate unrelated frequency components as far as
possible and enhance SNR.
4.2 Method of Analysis
Several methods will be introduced in more details. These include fast Fourier Transform (FFT), canonical correlation analysis (CCA), and signal-to-noise ratio (SNR). Fourier analysis using in SSVEP first appeared in 1977. The analysis has still been popularly utilized in the field until to now. Actually, Fourier analysis using has a huge pre-assumption. Any signal can be modeled perfectly by a series of sinusoid.
There is no doubt that brain’s signal is not similar to the harmonic generator. However, Fourier transform seems to work well in these studies which were applied. CCA analysis is another method that has been proposed recently [37]. The studies claimed that CCA analysis has more promising improvement than FFT analysis [48].
4.2.1 Fast Fourier Transform
Fourier transform is often useful to decompose signal into frequency components. Spectral analysis gives a different aspect, frequency domain, to realize the signal. The one of the spectral analyses is the discrete Fourier transform (DFT). DFT is an ineffective computation for modern signal. Then, FFT algorithm has been developed to enhance efficiency. In MATLAB, FFT uses the formula to calculate:
∑
− = −=
−
=
1 0 / 21
,...
0
,
)
(
)
(
N n N kn jN
k
e
n
g
k
G
π .The function can transfer time domain of a signal into frequency domain. The output are complex values, stand for a lot of sinusoid combination. These outputs multiply their conjugate then the energy of each component frequency can be acquired. Note that the frequency resolution would be decided by input signal length and sampling rate.
4.2.2 Canonical Correlation Analysis
CCA analysis can use multi-channel information to provide more accurate (2)
detection. [49] It was also applied in code-VEP [50], because it processes signals through the point of time course. As a result, it does not face the problem of Fourier transform. Consider two sets of random variable X and Y, CCA have ability to find two matrixes,
W
xandW
y, which maximize the correlation between x and y by solving the formula:] [ ] [ ] [ ] [ ] [ ] [ ) , ( , y T T y x Y T x y T T x T T T y x EW XX W EW YY W W XY W E y y E x x E y x E y x W W MAX = = ρ , X refers to the set of multi-channel signals. The reference signal Y can be defined:
• • = ) 2 cos( ) 2 sin( ) 2 cos( ) 2 sin( Nft Nft ft ft Yf
π
π
π
π
,where N is the number of harmonics that can be decided by demands. Along with number of targets, we have corresponding number of reference signals. X usually chooses 9 channels signals from occipital, because too many unrelated inputs will lower detection performance.
4.2.3 Signal-to-Noise Ratio
The indicator implies our interesting signal occupies percentage of the real signal. When brain evokes SSVEP signal successfully, the frequency of the SSVEP signal will strongly suppress other frequencies near the frequency. SNR can be defined as
(3)
the ratio of y(f) to the mean value of n adjacent points
)
]
|
)
(
|
|
)
(
[|
1
|
)
(
|
(
log
10
2 2 / 1 2 2 10k
f
f
y
k
f
f
y
N
f
y
SNR
N k+
∆
×
+
−
∆
×
×
=
∑
= ,where y is the amplitude spectrum calculated by 2m
-point FFT and f is the stimulus frequency. ∆f depends on a step of frequency of FFT. If sampling rate is 200 Hz
and the length of input data is 200 points, the value of f1is 1
× sec. 200 1 200 1 Hz .
The number of frequencies below and above the stimulus frequency can be decided by N. Then, we take decibel as the unit of the value.
Amplitude spectra, SNR responses, CCA response, flickering responses and classifier will take on in the next section. We will show and discuss the relevance mean response of the eight subjects in the results. 60 Hz responses will be an exception, because power line noise (60 Hz) will influence the EEG receiver.
4.3 Spectral analysis
The amplitude spectra (Oz channel) of foveal and extrafoveal SSVEP responses of 8 subjects averaging between 5 and 65 Hz is shown in Figure 13. Oz channel is the channel that was seen as larger SSVEP response in previous studies. Three scales are used to display the results: 0~3 µV for 5 Hz to 25 Hz, 0~1 µV for 30 to 45 Hz and 0~0.5 µV for 50 to 65 Hz respectively. As expected, the amplitude of SSVEP spectra decreases with increase in stimulus frequency. Nonetheless, the SSVEP spectral peaks including those at fundamental frequencies are noticeable up to 45 Hz. Power line noise (60 Hz) also can be observed in these figures. All amplitude spectra have a peak in that stimulation frequency. Alpha band also seems to have some reactions as Figure 12. Those responses are normal because human brain will generate strong alpha response, even through ERP technique was used to eliminate the responses that is asynchronized. Overall, foveal responses are higher than extrafoveal response except for frequency 5 Hz and 10 Hz.
4.4 SNR response
Figure 14. Distribution of SSVEP signal-to-noise ratios in response to fovea (red) and extrafoveal (blue) stimuli between 5 and 65 Hz
SNR is the most important indicator to examine the SSVEP intensity and it has often been used for detection of BCI application. Figure 14 is the candlestick chart of foveal and extrafoveal SSVEP responses captured at Oz channel showing their maximum, third quartile, median, first quartile, and minimum values. Outlier data that is represented as a small star, would exclude in the candlesticks. Obviously, the foveal SNRs are mostly higher than those of extrafoveal for twelve frequencies except the 5 Hz stimulation. [O1 (rod: 6.14 cone: 5.01), Oz (rod: 5.12 cone: 4.37), and O2 (rod: 5.16 cone: 4.50)]. The other two channels related to occipital (O1 and O2), also have similar tendency. Moreover, SNR response is not decay as amplitude spectrum. There are two peaks, 10 Hz and around 30 Hz, of the median points. The phenomenon is
similar to [13], while the SNR peaks were around 15 , 31 and 41 Hz in that study. There is a little difference with our results. The difference may be caused by other contributing factors: luminance, different reference electrode individual difference, size of stimulus pattern and different light source.
Figure 14 points out excited news for high-frequency SSVEPs, i.e., the SNRs of the foveal region in frequencies ranging from 25 to 45 Hz are high enough to get a SSVEP signal and that will not make users fatigue. Figure 15 further points out very important information that the differences of two patterns between 35 to 45 Hz is almost positive, this is to say, these frequencies may be a suitable band to be utilized on BCI system. Put it differently, the frequency band is less influence by peripheral vision. To confirm this exciting result, we further utilized the CCA method to analyze the SSVEPs data. Figure 14 also shows that extrafoveal still can generate SSVEP signal, but responses are not as strong as foveal region. Center vision is the area that mainly evoked SSVEP signal.
Figure 15. Distribution of SSVEP signal-to-noise ratios differences of two patterns stimulus between 5 and 65 Hz
Figure 16. Topography of average SSVEP signal-to-noise ratios in response to (A) foveal and (B) extrafoveal stimuli (C) differences
The SNR topography of fovea (center) and extrafoveal (ring) SSVEP responses are presented in Figure 16. The SSVEP is successful evoked in occipital lobe, which contained higher SNR. A low stimulation frequency of 5-15 Hz SSVEP signals are evoked over wide area of all head which is consistent with the results published in [41]. High frequency, 20-45 Hz, SSVEP signals are more intensive on the occipital lobe. As same as Figure 13 and 14, we also can find that the foveal responses are greater than extrafoveal responses. The most interesting finding is that the SNR of 25-45 Hz is even larger than that of 15 Hz which means high frequency band of SSVEP is possible to be utilized. Moreover, we can observe that the difference SNR topography between fovea and extrafoveal that was obtained by foveal SNR minus extrafoveal SNR. Most topographies have negative values around Pz channel, which means that extrafoveal response is mainly focused on the area. Overall, foveal responses are said to be larger than extrafoveal, which intensively gather at Oz channel. In summary, the SSVEP signal of two different patterns evoked different brain areas and Oz seems a fine electrode that will less be influenced by peripheral vision. Figure 17 shows 60 Hz SNR topography. Power line noise can also easily be observed in 60 Hz SNR topography: The highest SNR values occupy over the wrong lobe. Considering a viable BCI system, 60 Hz is not a good option in Taiwan.
(A) (B)
Figure 17. Topography of 60 Hz signal-to-noise ratios (A) foveal and (B) extrafoveal stimuli
4.5 Flicker Perception
Figure 18. Evaluation of subjects’ flicker perception (red and blue bars denote their responses towards center and ring stimuli respectively)
Figure 18 shows the distribution of subjects’ flickering perception scores in a candlestick chart. The red and blue bars represent the scores of foveal (center) and extrafoveal (ring) stimulation between 5 and 65 Hz. The two ends of the bars marked the first and the third quartile scores among the eight subjects. Averaging scores are marked by the red squares and blue circle while the entire range is marked by the thin lines.
As expected, subjects noticed less of the flickering as stimulation frequency increased and did not feel annoyed (with scores below 2) when the flickering frequencies lie above 40 and 45 Hz for fovea and extrafoveal stimulation respectively. Besides, the average scores of foveal stimulation are lower than those of extrafoveal stimulation. From these
data, we can postulate that stimuli flickering higher than 30 Hz may be suitable for SSVEP BCI applications as those frequencies will be regarded as slightly annoying for most subjects. No previous study probed this relationship in such wider frequencies and further noted subjects’ feeling.
There are some interesting articles related to the case. In [51] asserted that most amplitude of a transient VEP recorded in the response to stimulation of 15°-16° diameter disk was generated from the central 2° of the fovea. The further study of the same authors stated that 70 % of the response due to the central 3° of the visual angle. In [1], using stimulus parameters similar to the case (a 2.2° fovea field and an annulus with dimensions of 4° and 11°) found that the amplitude per unit retinal area of a steady-state VEP was about 6.5 times greater for fovea centralis compared to extra fovea stimulation. The references are tally with this experiment.
4.6 CCA response
(A)
Figure 19. Averaging CCA coefficients of SSVEP responses towards (A) foveal, (B) extrafoveal stimuli and (C) difference between 5 and 65 Hz
Using the CCA technique, SSVEPs of each stimulation frequency was computed to various samples and acquired 13 correlation coefficients. The averaging correlation coefficient map of various stimulation frequencies for the eight subjects with the center and ring light patterns are plotted in Figure 19. The results show a strong relationship between template frequency and stimulation frequency.
The correlation coefficients in center stimulus light pattern are larger than those in ring stimulus light pattern. For both light patterns, a diagonal line represent that there is a highest correlation coefficient exists when stimulation frequency is the same as reference frequency. In this diagonal line, the correlation coefficient is decreased along with stimulation frequency increasing. Each stimulation frequency exist high correlation coefficients in the several harmonic frequencies. For instance, the stimulation frequency
of 15 Hz has larger correlation coefficients in reference frequencies of 30, 45 and 60 Hz. The results are also consistence with those represented in Figure 13. On the map, there are three horizontal lines (undesired lines) appear in the reference frequencies: 5, 10 and 60 Hz. For those cases of 5 and 10 Hz, it must be caused by alpha wave of brain except 5 Hz and 10 Hz stimulation frequencies. For the case of 60 Hz, the power lines of electronic devices such as a signal generator and the stroboscope, caused by the noise even though the all power cables were shielded by grounded metal nets.
In CCA formula as mentioned before, we chose N=0 as our reference frequencies. From the view of BCI application, we can find that 10 Hz reference frequency might be high enough that will influence the responses and influence the BCI system accuracy as well. N may be set 1 or 2 to solve the problem. The 10 Hz reference frequency correlation will lower and ensure the truly responses stay high correlation. Foveal correlations are entirely higher than extra-foveal correlation. These results are also in line with FFT.
(A)
(B)
Figure 20. Averaging CCA weight value of SSVEP responses towards (a) foveal and (b) extrafoveal stimuli between 5 and 65 Hz
Figure 20 shows the weight map of each stimulation frequency. Weights of each channel to all frequencies can be acquired in CCA computation. High weights may imply that the channels are more important and include more information. Occipital 9 channels as input in CCA computation, we can therefore acquire 9 channels weights for all frequencies. If they distinctively concentrate on certain channels, it will very helpful for SSVEP-based BCI developing. Unfortunately, there is no clearly tendency in the weight matrixes. In low frequencies, 9 channels seemed to have the almost same level that also means their information is extracted with the same level. Move to higher frequencies, certain channels became more important. Oz and O1 seemed to keep higher weight in the range 20-50 Hz and 30-65 Hz for foveal pattern while POz is high in 25-55 Hz for extrafoveal pattern. These may tell us that the channels have better SSVEP component in these ranges.
4.7 Classifier
(A)(B)
Figure 21. Accuracy of 12 frequencies classification (A) foveal (B) extrafoveal
Simple BCI operation is replicated in the section. We put a period (1 s, 2 s with 1 s overlap and 4 s with 1 s overlap) of signal, which has already been analyzed by the methods in previous sections, to the classifier. The classifier transfers the data into frequency domain, then, it calculates SNR value of all 12 frequencies. The segment of data belongs to the frequency that has maximum SNR. Figure 20 shows that longer data have higher accuracy (4 s >2 s >1 s). The accuracy performance distribution is similar to
SNR response no matter in foveal and extrafoveal (fovea > extrafoveal) [Figure 14]. It proves that our offline analysis method highly correlate to real BCI performance. In fact, the accuracy will have huge enhancement if its harmonic frequencies and alpha band are excluded. The reason is that a large number of data after classifying belong to the two categories. Therefore, choose frequencies are chief consideration for a well-designed BCI system.
At last, the SNR of SSVEP signals and their correlation with sinusoidal waveforms at different stimulation frequencies were measured using FFT and CCA analysis. Data of each subject and their averages were analyzed in order to discover the general trends
as well as individual differences. Our results show that SSVEP from the 2° foveal
avascular zone captured at the nine occipital channels (P1, PZ, P2, PO3, POZ, PO4, O1,
OZ and O2) showed distinctively higher SNR between 25 and 45 Hz. Almost all subjects also noticed less flickering and felt more comfortable with stimulation to their foveal region between 30 and 45 Hz. These empirical evidences suggest that light sources with 30-45 Hz flickering frequencies may be used as effective and comfortable visual stimuli in high-frequency SSVEP-based BCI applications. In the mimic real time analysis, the data were tossed into the classifier which purely classified by SNR. Then, the results seem highly related with offline analyses.
Ⅴ
Ⅴ
Ⅴ
Ⅴ. Contribution and Future Works
5.1 Contribution and Implication
In this preliminary study, we confirmed the hypothesis that the SSVEP responses of fovea centralis have distinctively higher SNR in response to high frequency stimuli comparing with those from the extrafoveal region. This finding suggests that light sources flashing above the fusion thresholds may be used as effective and comfortable visual stimuli in SSVEP-based BCI applications. Moreover, we also made the following observation based on our experiment results:
1. Center’s responses are greater than ring’s, whereas flickering levels of ting are higher than center’s. Therefore, center seems to be a suitable target for BCI system.
2. Although variations of the EEG signal strength in different subjects are significant, the differences between the first and the third quartiles of SNR values remain distinct. Specifically, no overlap of mid-range values was found under the stimulation frequencies from 25 and 45 Hz condition.
3. Tends of CCA results is to produce more consistent results in detecting high-frequency SSVEP responses. However, only EEG signals from the occipital area can be used, including signals from the sensory-motor areas may hamper the accuracy of detection.
4. Our results showed that fovea SSVEP responses are located in highest SNR values around 10 (alpha band) and 30 Hz. The other SNR peak around 45 Hz reported in previous literature [52] seemed to be missing. A possible explanation was that due to SSVEP responses may differ from those of the entire foveal region, since we aimed at stimulating the foveola and the foveal avascular zone.
5. Almost all subjects reported that they noticed less flickering and felt more comfortable with stimulation of their foveal region. The difference was most notable between 30 and 45 Hz. One possible reason is that the area of the circular (fovea) stimulus was much smaller than the annular (extrafoveal) stimuli; hence, its flickering was much less irritating. Nonetheless, it was good to know that the visually acute region was not easily irritated.
6. Finally, we provide very useful guideline for SSVEP-based BCIs that is designed by FFT technique about best electrode and frequency band selection. Prevent from peripheral vision annoy, Oz is the best channel to deploy on the scalp. Frequencies 30-40Hz is the suitable frequency band.
5.2 Future Works
More experiments must be carried out in order to obtain the full picture of foveal vs. extrafoveal SSVEP responses. First, we indeed learn more about the effects of pulse width and intensity towards the responses. Mesopic responses would be worth exploring. Finally, we shall study the high-frequency and colored SSVEP responses of parafovea and perifovea in order to map out the VEP characteristics of central retina.
Appendix
Center Frequency 5 Hz 10 Hz 15 Hz 20 Hz 25 Hz 30 Hz 35 Hz 40 Hz 45 Hz 50 Hz 55 Hz 60 Hz YYC O1 11.3 3.8 3.5 5.9 5.5 9.7 9.5 11.7 4.4 7.8 3.3 0.3 Oz 11.6 5.4 2.0 3.8 4.5 8.3 9.6 11.8 3.3 6.2 3.0 0.4 O2 9.7 9.5 5.3 1.9 4.3 4.7 7.8 7.0 1.1 1.9 1.7 0.8 TKC O1 10.7 11.7 6.6 11.9 15.5 22.6 20.0 22.5 17.7 22.7 14.5 4.9 Oz 16.4 18.3 14.1 20.7 24.3 33.0 36.6 39.4 38.4 35.6 27.0 8.4 O2 12.7 13.7 9.4 9.3 14.7 18.8 21.6 23.4 29.8 19.7 13.3 4.0 LFC O1 14.2 12.2 17.2 7.0 9.5 19.5 15.2 10.1 12.8 5.2 2.6 2.2 Oz 16.2 25.6 21.4 7.2 11.6 16.6 9.7 8.5 13.2 4.3 2.0 1.9 O2 16.7 27.1 15.4 4.5 8.6 9.7 4.2 4.6 4.6 1.5 0.8 1.2 KHY O1 1.4 13.0 4.9 14.8 12.0 18.3 10.8 6.6 11.1 4.2 11.3 1.0 Oz 3.1 30.5 17.2 35.6 22.4 20.3 17.5 11.2 18.6 4.2 10.3 1.3 O2 3.9 23.5 15.4 27.8 24.8 16.6 20.2 13.8 24.3 3.4 6.5 0.4 LEL O1 10.2 44.1 18.7 4.9 37.3 36.1 30.1 14.0 18.7 11.8 8.4 12.9 Oz 10.2 41.9 17.8 4.9 30.3 38.7 27.6 12.2 16.4 9.9 7.8 12.9 O2 9.4 40.8 18.0 4.5 24.7 39.7 28.6 10.4 15.8 8.0 6.5 12.3 JKZ O1 6.4 3.6 8.6 3.9 5.1 6.6 13.6 8.6 5.9 1.4 1.4 1.9 Oz 4.0 3.2 12.6 4.8 8.1 4.3 11.9 9.4 7.3 1.9 1.2 2.1 O2 4.5 5.9 14.6 3.9 7.9 5.3 13.0 9.6 7.7 2.1 1.5 2.0 CGC O1 6.6 11.4 8.0 22.8 10.2 9.0 10.9 12.9 11.0 19.4 4.5 2.8 Oz 5.9 17.3 11.7 23.5 15.0 12.4 16.4 16.2 10.6 22.7 7.1 4.6 O2 6.2 15.8 12.8 16.6 13.8 14.5 17.9 13.4 8.2 17.2 4.9 2.7 CCC O1 8.4 21.0 4.9 5.1 17.8 11.7 15.8 12.6 3.4 6.8 3.7 0.8 Oz 6.5 36.9 1.4 7.2 26.8 12.7 10.9 3.7 2.5 6.9 6.6 3.4 O2 5.9 23.9 7.8 8.9 25.4 10.5 8.4 6.9 2.9 2.8 5.7 3.5 Table 5. Individual fovea SNRs of 3 channelsRing Frequency 5 Hz 10 Hz 15 Hz 20 Hz 25 Hz 30 Hz 35 Hz 40 Hz 45 Hz 50 Hz 55 Hz 65 Hz YYC O1 7.5 10.1 5.7 6.8 5.0 2.4 5.5 4.6 0.7 4.1 4.1 3.4 Oz 7.6 9.5 6.8 6.3 4.5 2.9 5.6 4.2 0.5 4.0 3.8 3.4 O2 8.5 6.6 5.7 4.8 4.4 3.4 5.0 3.8 0.8 2.3 2.7 3.1 TKC O1 5.6 10.1 3.8 1.1 3.0 2.1 4.7 5.2 2.2 3.2 3.4 1.6 Oz 7.2 7.6 3.6 4.3 5.2 4.9 6.9 7.3 4.7 6.3 5.9 2.7 O2 8.4 5.1 4.7 3.5 3.5 2.8 6.6 5.8 4.3 7.0 5.8 3.2 LFC O1 13.0 11.5 8.6 5.7 3.6 2.8 1.3 1.4 2.3 2.3 2.7 1.4 Oz 16.4 25.1 11.8 10.3 4.3 3.1 2.5 1.7 4.5 3.7 3.1 1.6 O2 18.1 27.9 6.0 6.2 3.3 2.3 2.1 0.3 4.1 3.4 3.3 2.1 KHY O1 7.8 8.2 5.9 5.3 4.0 4.2 3.3 1.3 1.0 1.3 4.3 2.9 Oz 10.7 6.7 8.2 4.4 5.9 6.9 7.2 2.3 1.7 4.0 9.0 3.5 O2 10.4 7.7 6.5 2.7 3.5 5.0 5.3 4.5 1.5 5.0 9.5 3.3 KEL O1 15.1 36.1 11.5 5.5 11.5 8.2 8.7 9.1 4.2 5.4 2.1 3.6 Oz 14.0 21.8 12.7 2.4 10.5 7.9 9.1 7.7 5.2 7.1 3.0 3.7 O2 12.9 16.6 12.4 0.8 8.6 7.6 9.7 7.4 5.6 6.6 3.6 3.8 JKZ O1 5.6 8.2 3.6 5.6 9.5 5.3 5.3 2.3 1.7 0.7 1.2 1.4 Oz 7.8 10.6 3.6 5.3 7.9 4.2 4.0 2.5 1.0 1.1 1.4 1.9 O2 12.3 11.0 3.3 4.0 6.5 4.9 5.7 3.4 1.1 0.5 1.4 1.8 CGC O1 8.8 7.2 0.4 2.6 5.6 4.1 1.4 0.8 1.5 2.5 1.1 3.6 Oz 6.3 7.6 1.0 4.9 7.7 5.4 3.3 1.1 2.6 2.6 3.6 3.6 O2 6.0 7.0 2.4 5.2 5.6 4.4 2.9 0.4 1.5 2.1 2.0 2.6 CCC O1 11.7 9.0 10.7 7.7 6.0 10.4 11.9 7.0 1.6 2.4 1.3 2.0 Oz 9.4 21.0 7.6 10.5 12.8 14.8 14.6 12.1 3.3 1.1 0.6 3.1 O2 10.9 21.6 6.6 5.3 10.6 11.6 10.1 7.6 2.7 1.8 0.5 2.3 Table 6. Individual extrafoveal SNRs of 3 channels
Table 7. Individual fovea flickering scores
Center LFC KEL CGC JKZ TKC KHY CCC YYC
Frequency Exp.1 Exp.2 Exp.1 Exp.2 Exp.1 Exp.2 Exp.1 Exp.2 Exp.1 Exp.2 Exp.1 Exp.2 Exp.1 Exp.2 Exp.1 Exp.2
5 Hz 5 5 3 3 4 5 5 5 5 5 5 3 5 5 5 5 10 Hz 5 5 4 4 3 4 4 4 5 4 4 3 5 5 5 5 15 Hz 5 5 4 5 4 4 4 4 5 4 3 2 5 4 4 4 20 Hz 5 5 2 4 2 3 3 3 4 3 2 2 4 5 4 4 25 Hz 4 4 2 3 2 2 3 3 3 3 2 2 4 4 4 4 30 Hz 4 4 3 2 2 2 3 3 3 2 2 2 3 4 4 4 35 Hz 3 3 2 2 1 1 2 2 2 2 3 2 3 3 3 4 40 Hz 2 2 1 1 2 1 2 2 3 2 2 1 3 2 4 3 45 Hz 2 1 1 1 1 1 1 1 2 2 1 1 2 2 3 3 50 Hz 1 1 1 1 1 1 1 1 2 1 1 1 2 2 2 2 55 Hz 1 1 1 1 1 1 1 1 1 1 1 1 1 1 1 1 60 Hz 1 1 1 1 1 1 1 1 1 1 1 1 1 1 1 1 65 Hz 1 1 1 1 1 1 1 1 1 1 1 1 1 1 1 1
Table 8. Individual extrafoveal flickering scores
Ring LFC KEL CGC JKZ TKC KHY CCC YYC
Frequency Exp.1 Exp.2 Exp.1 Exp.2 Exp.1 Exp.2 Exp.1 Exp.2 Exp.1 Exp.2 Exp.1 Exp.2 Exp.1 Exp.2 Exp.1 Exp.2
5 5 5 4 4 5 5 5 5 5 5 5 5 5 5 5 5 10 5 5 5 4 4 5 5 5 5 5 4 3 5 5 5 5 15 5 5 3 3 4 4 5 5 5 5 3 3 5 5 5 5 20 5 5 3 2 3 3 4 4 4 4 3 2 4 4 5 4 25 4 4 2 3 3 3 3 4 3 3 2 3 4 3 5 4 30 4 4 4 3 3 3 3 4 3 3 2 2 3 4 4 4 35 3 3 2 2 2 2 3 3 2 2 1 2 3 4 4 4 40 3 3 2 1 2 2 3 2 2 2 2 1 3 3 3 4 45 2 2 2 1 2 2 1 2 2 2 2 1 2 3 3 3 50 1 2 1 1 2 1 1 1 3 1 1 1 2 2 2 2 55 1 1 1 1 1 1 1 1 1 1 1 2 1 1 2 2 60 1 1 1 1 1 1 1 1 1 1 1 1 1 1 1 1 65 1 1 1 1 1 1 1 1 1 1 1 1 1 1 1 1
Reference
1. Regan, D., Some characteristics of average steady-state and transient responses
evoked by modulated light. Electroencephalography and Clinical Neurophysiology, 1966. 20(3): p. 238-248.
2. Regan, D., Human brain electrophysiology: evoked potentials and evoked
magnetic fields in science and medicine. 1989.
3. Beverina, F., et al., User adaptive BCIs: SSVEP and P300 based interfaces. PsychNology Journal, 2003. 1(4): p. 331-354.
4. Lee, P.L., et al., Visual evoked potential actuated brain computer interface: a
brain-actuated cursor system. Electronics letters, 2005. 41(15): p. 832-834.
5. Jeavons, P.M. and G.F.A. Harding, Photosensitive epilepsy: a review of the
literature and a study of 460 patients1975: Heinemann [for] Spastics
International Medical Publications.
6. DeTommaso, M., et al., Steady
‐
state visual‐
evoked potentials in headache: diagnostic value in migraine and tension‐
type headache patients. Cephalalgia,1999. 19(1): p. 23-26.
7. Wolpaw, J.R., et al., Brain-computer interfaces for communication and control. Clinical neurophysiology, 2002. 113(6): p. 767-791.
8. Nijholt, A., BCI for games: a ‘state of the art’survey. Entertainment Computing-ICEC 2008, 2009: p. 225-228.
9. Bashashati, A., et al., A survey of signal processing algorithms in
brain–computer interfaces based on electrical brain signals. Journal of Neural
Engineering, 2007. 4: p. R32-R57.
10. Lebedev, M.A. and M.A.L. Nicolelis, Brain-machine interfaces: past, present
and future. TRENDS in Neurosciences, 2006. 29(9): p. 536-546.
11. Middendorf, M., et al., Brain-computer interfaces based on the steady-state
visual-evoked response. Rehabilitation Engineering, IEEE Transactions on, 2000. 8(2): p. 211-214.
12. Cheng, M., et al., Design and implementation of a brain-computer interface with
high transfer rates. Biomedical Engineering, IEEE Transactions on, 2002. 49(10): p. 1181-1186.
13. Wang, Y., et al., A practical VEP-based brain-computer interface. Neural Systems and Rehabilitation Engineering, IEEE Transactions on, 2006. 14(2): p. 234-240.
![Figure 5. Distribution of cones and rods in a typical human retina [46]](https://thumb-ap.123doks.com/thumbv2/9libinfo/8762580.208520/22.892.135.753.399.989/figure-distribution-cones-rods-typical-human-retina.webp)