Research report
Comparison of touch- and laser heat-evoked cortical field potentials in
conscious rats
Fu-Zen Shaw
a, Ruei-Feng Chen
b, Hen-Wai Tsao
a, Chen-Tung Yen
b, ) aDepartment of Electrical Engineering, National Taiwan UniÕersity, Taipei, Taiwan b
Department of Zoology, National Taiwan UniÕersity, No. 1, Section 4, RooseÕelt Road, Taipei 106, Taiwan
Accepted 26 January 1999
Abstract
Field potentials and multiunit activities from chronically implanted cortical electrodes were used to study tactile and nociceptive information processing from the tail of the rat. Fourteen stainless steel screws implanted in the skull were used as electrodes to record field potentials in different cortical areas. Electrical, mechanical, and laser pulses were applied to the tail to induce evoked cortical field
Ž .
potentials. Evoked responses were compared before and after sodium pentobarbital anesthesia 50 mgrkg, i.p. . In both electrical- and
Ž .
mechanical-evoked potential EEP and MEP studies, two major peaks were found in the conscious animal. The polarity of the late
Ž .
component was modified after pentobarbital anesthesia. In the laser-evoked potential LEP study, two distinct negative peaks were found. Both peaks were very sensitive to anesthesia. Following quantitative analysis, our data suggest that the first positive peak of EEP and MEP corresponded to the activation of the Ab fiber, the second negative peak of MEP and the first peak of LEP corresponded to Ad fiber activation, while the second peak of LEP corresponded to C fiber activation. The absolute magnitudes of all cortical components were positively related to the intensity of the stimulation. From spatial mapping analysis, a localized concentric source of field potential
Ž .
was observed in the primary somatosensory cortex SI only after activation of the Ab fiber. Larger responsive cortical areas were found in response to Ad and C fiber activation. In an intracortical recording experiment, both tactile and nociceptive stimulation evoked heightened unit activity changes at latencies corresponding to respective field potentials. We conclude that different cortical areas are involved in the processing of A and C fiber afferent inputs, and barbiturate anesthesia modifies their processing. q 1999 Elsevier Science B.V. All rights reserved.
Keywords: A fiber; C fiber; Topographical mapping; Nociception; Somatosensory function; Electrical stimulation
1. Introduction
w x
Early in this century, Head and Holms 17 observed that the threshold for pain stimuli is preserved after dam-age to the cerebral cortex, but that pain thresholds and pain sensation change with damage to the thalamus in patients. These observations have led to the still widely held view that pain is sensed in the thalamus. Over the past two
w x
decades, however, results from humans 4,18,20,24,25,37 ,
w x w x w x
primates 16,22 , cats 30,32 , and rats 18,21,28,29,39 have indicated that the cerebral cortex participates in pain processing. Electrophysiological evidence from painful
)
Corresponding author. Fax: q886-2-2363-6837; E-mail:
ctyen@ccms.ntu.edu.tw
Ž
electrical stimulation transcutaneous stimulation, tooth-.
pulp stimulation or laser heat stimulation has been
re-w x
ported in the neocortex of anesthetized monkeys 23,24 ,
w x w x
cats 30,32 , and rats 18,21,28,29,33 . It is well known, however, that anesthesia strongly modifies nociceptive
re-w x
sponses 8,13,26,38 . One of the goals of the present study is to evaluate nociceptive-evoked responses in awake rats. Short-pulse noxious CO -laser radiation activates mainly2
w x w x
Ad and C nociceptors in rats 15 and humans 3,5 , without activating low-threshold mechanoreceptors. In
hu-Ž .
mans, CO -laser stimulation-evoked potentials LEPs have2 been recorded from the scalp, and such potentials are assumed to be of cerebral origin. Latencies of these
poten-w x
tials correspond to activation of Ad and C fibers 4,7,9 . These evoked potentials coincide with the perception of
w x
pricking and burning pains, respectively 4,7 . Similar 0006-8993r99r$ - see front matter q 1999 Elsevier Science B.V. All rights reserved.
Ž .
evoked potentials using CO -laser radiation have been2
w x
recorded in rats under halothane anesthesia 21 . In that
w x
study, Kalliomaki et al. 21 reported that late cortical LEP evoked from laser stimulation of glabrous skin of paws of rats corresponded to C fiber velocity. This late LEP occu-pies a larger area of the sensorimotor cortex as compared to the short latency-evoked potential elicited from innocu-ous mechanical stimulation. Using standard electrophysio-logical recording techniques, they found that the late LEP exhibited two intracortical foci: one at laminae IIIrIV and the other at laminae V–VI.
The major purpose of the present study was to use laser heat irradiation to study the processing of nociceptive input in the cerebral cortex and to compare LEPs with low-intensity tactile- and electrical stimulation-evoked
po-Ž .
tentials EEPs in conscious, awake rats. Topographical distributions of these LEPs were determined with 14 im-planted stainless steel screws evenly spaced over the top of the skull. To ascertain that these evoked potentials were of cortical origin, intracortical recording was performed with multichannel microwire bundles whose tips were exposed at different depths of the cortical layers. Preliminary
re-w x
sults have been presented in abstract form 34 .
2. Materials and methods
2.1. Implantation of surface electrodes
Ž .
Adult male Wistar rats 250–300 g were anesthetized
Ž .
initially with sodium pentobarbital 50 mgrkg b.wt. . Ke-tamine was administrated as necessary to maintain proper anesthetic depth during surgery. The dorsal surface of the animal’s head was shaved and placed in a stereotaxic apparatus. A midline scalp incision was made. Connective tissue was scraped away from the skull surface. The skull was roughened with a bone curette and then cleaned with saline. After exposure of the skull, a small concavity on each marked position of the skull was drilled first and then
Ž .
a stainless steel screw O.D.s 1 mm was securely driven into this position. The small screw electrodes were posi-tioned and symmetrically arranged 3 mm apart on both sides of the skull. The location of the recording channels is shown in the inset of Fig. 6. These skull electrodes did not penetrate the underlying dura. The impedance of these electrodes was 1.5–10 k V. Monopolar recordings were made from screws relative to the reference electrode, which was implanted 2 mm caudal to the lambda at the midline. Individual screws were connected to a pin in a connector module. To assure functioning of electrodes after surgery, evoked potentials were elicited by stimulat-ing the tail of the rat usstimulat-ing a 0.5-ms duration constant
Ž .
electrical current pulse Grass S44 . Subjects without iden-tifiable evoked potentials or with evoked potentials of negative polarity in channel 5 or 9, which overlay the tail
representative area of the primary somatosensory cortex ŽSI. ŽFig. 6, Ref. 14w x. and indicate penetration into the cerebral cortex, were eliminated from the study. Dental cement was then applied and the connection module was fastened to the surface of the skull. Finally, animals were
Ž .
injected with antibiotics Combion-S, 60,000 Urkg, i.p. and housed individually in cages.
2.2. Implantation of microwire bundle Ž
Formvar-insulated nichrome microwire A-M systems; .
a7610, 18 mm diam. was used to record the activity of SI neurons. In order to record the activity at different cortical layers, the microwire bundle was carefully arranged. A
Ž .
glass micropipette with a long shaft 5 mm diam. was Ž
made with a horizontal pipette puller Sutter Instrument .
model P-87 . With this micropipette serving as a center-piece, eight microwires were glued spirally in sequence onto the micropipette at different depths under a stereomi-croscope. The total width of the 8-channel microwire bundle was about 100 mm. Each microwire was soldered individually to a connection module. Prior to implantation, the cortical representative area of the tail was mapped using a glass microelectrode filled with a 3-M NaCl solution. The microwire bundle was then implanted at the location with maximal cortical response to tail stimulation. Two weeks following recovery from surgery, individual animals were placed in an acrylic recording chamber with a slit in the top. This chamber was designed to allow recording from unrestrained animals. The behavior of the rat could be clearly observed. We used a modified multi-strand printer cable line to connect the connection modules to the skull and amplifiers through the slit in the top cover of the chamber. To habituate rats to the experimental chamber, each animal was placed in a recording chamber 5
Ž .
times 2 hrday before the experiment. On the day of the actual recording, a 30-min period was allowed for the rat to become familiar with the environment. Surgical and
Ž .
recording procedures complied with NIH USA recom-mended procedures for animal use and care.
2.3. Tail stimulation
Three types of somatic stimuli were used: electrical stimulation, mechanical stimulation, and CO -laser irradia-2 tion. For electrical stimulation, multistrand stainless steel wires were wrapped around the tail base. They were held in place with adhesive tape, and electrode cream was applied to enhance the contact. Constant electrical current
Ž .
pulses of 2-ms duration Grass S44 were delivered to the tail. The intensity of the electrical current was set in the range from 0.1 to 0.5 mA. This current range was chosen for the activation of low threshold cutaneous receptors. For
Ž .
mechanical stimulation, a blunt probe 5 mm diam. at-tached to a coil was used. The probe was displaced by a
Ž .
short-lasting current pulse 2 ms generated by a Grass stimulator. The stimulator was adjusted to cause light
Ž .
pressure of the skin 15–20 g . The interstimulus interval of electrical and mechanical stimulation was kept at 1 s. To lessen the contamination of the recording, the stimulus
Ž
was interrupted when the rat was active such motion as .
grooming, chewing, etc. .
The skin was stimulated with radiant heat pulses emit-Ž
ted from a CO -laser medical surgical laser, Tjing Ling2 . a2, National Taiwan University, 10.6 mm wavelength
Ž . w x
operating in TEM00 mode Gaussian distribution 39 .
Ž .
The beam diameter was 3 mm unfocused . The duration of the stimulation pulse was kept at 10 ms. The output
w x
power was between 6 and 18 W 39 . These output ener-gies correspond to 60–180 mJ. These stimulation enerener-gies did not result in any visible damage to the skin. To minimize tissue damage, sensitization and habituation, the
Ž stimuli were randomly applied to a local skin area 1 cm
.
for Tb and Tm; 1.5 cm for Tp . The interstimulus interval was longer than 5 s. With each laser stimulation, a jerky movement of the tail was noted. For tail-tip and midtail stimulation, this movement was a flick of the tail; for tail-base stimulation, the observed movement was an arch-ing or curlarch-ing of the tail. Both response types were used in the calculation of the proportion of tail flick. Effects of pentobarbital on these somatic-evoked potentials were
Ž .
tested in a few rats see Section 3 . In these animals,
Ž .
sodium pentobarbital 50 mgrkg was administered i.p.; the same somatic stimuli were applied before and after pentobarbital anesthesia.
2.4. Recording and data analysis
Field potentials from skull electrodes were amplified Ž
with a 16-channel amplifier 4th order bandpass filter: .
0.3–1000 Hz, gain s 5000 = . These multichannel poten-Ž tials were digitized with a data acquisition card
AT-16-.
MIO-F5, National Instruments, Austin, TX with the exter-nal trigger locked. Sampling frequency for individual channels was 4 kHz. Unit activity was amplified in the
Ž .
frequency range of 300–3000 Hz 20,000 = . The sam-pling frequency was 20 kHz for individual channels. Data were stored on a computer hard disk and trials were averaged on-line. Each evoked potential was selected from an average of about 100 stimuli. Evoked data trials were rejected from averaging if they showed a contaminated movement artifact, large baseline shift, or spindle rhythm. To evaluate the spatial pattern of the responses, a topo-graphical map was used. Topotopo-graphical maps were
calcu-w x
lated with weight average interpolation 31,35 . Details of the analytical program were described in a previous
inves-w x
tigation 35 . Intracortical multiunit recordings were either Ž
rectified and integrated integrated multiunit activity, .
IMUA , or passed through a window discriminator. Num-bers of spikes and frequencies from the window discrimi-nator were calculated and analyzed with a software
pro-Ž
gram developed on a LabVIEW National Instruments, .
Austin, TX environment. 2.5. Histological procedures
After completion of the stimulation and recording ex-periment, the animal was overdosed with sodium pento-barbital and subsequently perfused with 10% formalin in saline. Special attention was given to ascertain that stain-less screws did not penetrate the dura. Serial 50-mm frozen sections of the brain were cut and stained with thionin. The location of the microwire bundle was determined with microscopic examination of the stained sections and docu-mented with a camera lucida attachment.
3. Results
3.1. Cortical responses to different somatic stimulation Three different types of somatic stimulation were used
Ž
on tails of rats. Three different sites on the tail tail base wTb , middle tailx wTm , and tail tipx wTpx. were given mechanical and CO -laser stimulation. The electrical stim-2
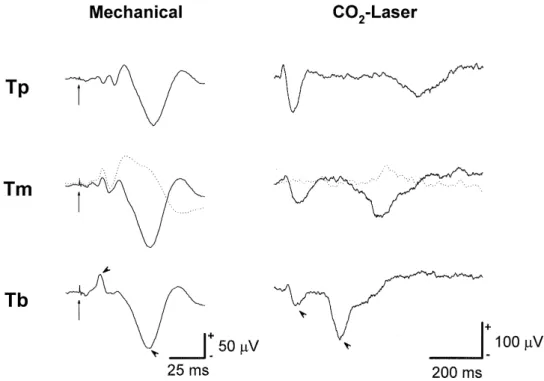
ulation was applied only to the tail base of the rat. Examples of field potentials elicited in the tail representa-tive area of SI, evoked by mechanical and CO -laser2 stimulation at these 3 sites, are shown in Fig. 1. For
Ž
mechanical stimulation, two major components Fig. 1, left
. Ž
column were observed: a biphasic waveform positive .
peak followed by a negative peak followed by a larger negative peak. For CO -laser radiation, two components2
were also observed: a biphasic waveform followed by a
Ž .
negative peak Fig. 1, right column . A cortical-evoked Ž
potential of biphasic waveform positive peak followed by .
a negative peak followed by a larger negative peak was Ž
observed following electrical stimulation indicated by ar-.
rowheads in Fig. 2A .
Under pentobarbital anesthesia, the first component of
Ž . Ž
mechanical-evoked potential MEP was enhanced n s 8, .
p - 0.001 while the second components of MEP was Ž
reversed in waveform dotted line in middle panel of left .
column of Fig. 1 . In contrast, all peaks of LEP were abolished during the first 90 min after pentobarbital anes-thesia. Two hours after pentobarbital administration, the rat showed spontaneous twitching movements and dis-played other signs of returning to consciousness. However, cortical responses did not completely recover. Interest-ingly, with the same laser irradiation, the late component
Ž
of LEP changed to a positive peak dotted line in middle .
panel of right column of Fig. 1 . Similar to the MEP changes, the first component of the EEP was enhanced, while the late component was changed 2 h after
pento-Ž .
Ž . Ž . Ž .
Fig. 1. Examples of MEPs left column and LEPs right column of SI evoked from stimulation at three different tail sites in awake solid line and
Ž . Ž . Ž . Ž .
anesthetized dotted line conditions. Intensities of CO -laser stimulation at the base of the tail Tb , middle tail Tm , and tip of tail Tp were 12, 12, and2
15 W, respectively. The major components of MEP and LEP are indicated by arrowheads in the bottom traces. Two hours after sodium pentobarbital
Ž .
injection 50 mgrkg, i.p. , patterns of MEP and LEP following Tm stimulation were still modified. The long arrows in the left column indicate the tactile stimulus artifact.
3.2. Peripheral afferent fibers mediating different eÕoked potentials
To estimate the conduction velocity of the peripheral afferent fibers mediating the MEPs and LEPs in freely
moving rats, the latency of these potentials to three differ-ent sites of the tail was measured. These latencies were used to estimate the peripheral conduction velocity of the major peaks in MEP and LEP. The average latencies Žmean " S.E.. of the first positive peak evoked from
Ž . Ž . Ž .
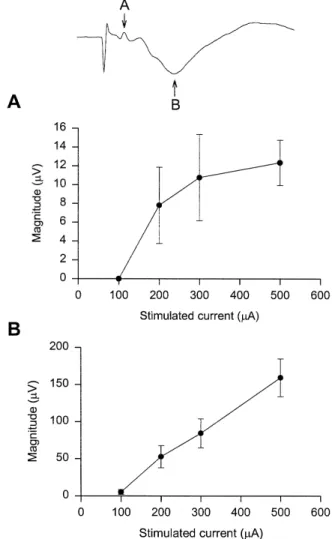
Fig. 2. Examples of EEPs after stimulation at tail base. A EEPs in awake solid line and anesthetized dotted line conditions. The intensity of the
Ž .
electrical current was 0.5 mA with a 2-ms duration. The major components are indicated by arrowheads. B EEPs following stimulation at three different
Ž .
Tb, Tm, and Tp following mechanical stimulation were 15.6 " 0.6, 16.4 " 0.8, and 21.4 " 0.8 ms, respectively. We found that peak latency increased linearly with
con-Ž .
duction distance along the tail Fig. 3 . Estimation of conduction velocity with the slope of the linear regression
Ž .
line was 35 mrs p - 0.001 . For the second component of the MEP, average latencies evoked from Tb, Tm, and Tp were 49.5 " 2.0, 50.8 " 1.0, and 56.5 " 1.7 ms, respec-tively. Estimation of conduction velocity was 28 mrs Žp - 0.005 . Latencies of the first negative peak evoked. from Tb, Tm, and Tp following laser stimulation were 70.6 " 2.9, 73.8 " 2.6, and 79.6 " 3.5 ms, respectively.
Ž Conduction velocity was approximately 22 mrs p
-.
0.05 . Latencies of the second negative peak from Tb, Tm, and Tp following laser stimulation were 246.7 " 8.0, 394.1 " 14.5, and 519.5 " 22.7 ms, respectively. Conduction
Ž .
velocity was 0.7 mrs p - 0.001 . Conduction velocity of the first positive peak to mechanical stimulation was medi-ated by the Ab fiber. Conduction velocities of the second negative peak of MEP and the first negative peak of LEP were in the range of the Ad fiber. The second negative peak of LEP was mediated by the C fiber.
3.3. Stimulus-response relations of EEP and LEP Ž
Four different current intensities 0.1, 0.2, 0.3, and 0.5 .
mA were used to evaluate the stimulus-response
relation-Ž .
ships in free-moving rats n s 8 . Fig. 2B shows EEP
Fig. 3. Relationship between conduction distance and peak latencies of MEPs and LEPs. The slopes of the linear regression line of the four components are 35, 28, 22, and 0.7 mrs, respectively. Data are presented
Ž
as mean"S.E. ) p- 0.05; )) p- 0.01; ))) p- 0.001 Student’s
t-.
test .
Ž .
Fig. 4. Changes in magnitude mean"S.E. of EEPs evoked from
Ž .
different current intensity stimulation at the tail base. A Magnitude of the positive component of EEP increases as stimulus current increases. A sigmoidal relationship was found between current intensity and EEP
Ž .
magnitude. B The magnitude of the negative component of EEP in-creases linearly with inin-creases in stimulus current.
traces under 0.2, 0.3, and 0.5 mA current stimulation. The
Ž .
magnitude mean " S.E. of the first and second compo-nent of the EEP at each stimulus intensity is shown in Fig.
Ž .
4. Amplitudes of both positive Fig. 4A and negative
Ž .
peaks Fig. 4B of EEPs became larger as the stimulation current increased. The threshold current for EEP was between 0.1 and 0.2 mA. The amplitude of the positive component of EEP showed a sigmoidal curve with increas-ing current intensity. The amplitude of the negative com-ponent of EEP showed a linear relation to the stimulated current. We did not apply intensities higher than 0.5 mA, because at this intensity rats sometimes indicated
uncom-Ž .
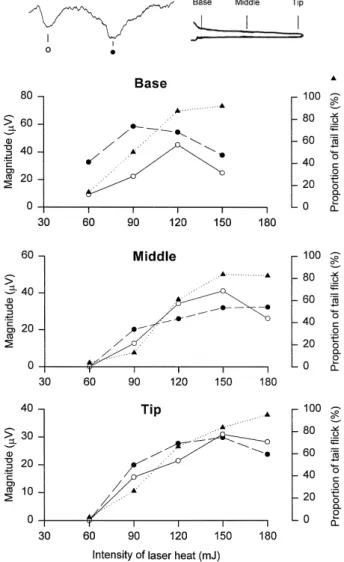
fortable behavior vocalization andror biting the bandage . Ž
Five different laser energies 60, 90, 120, 150, and 180 .
mJ were applied to tails of rats. The magnitude of LEPs Žn s 9 and the proportion of tail flick n s 11 vs. five. Ž . different stimulus energies applied to the tail base, the middle tail, or the tail tip are shown in Fig. 5. The proportion of tail flick increased as the stimulus energy
Fig. 5. Changes in magnitude of LEPs and the proportion of tail flick after laser heat indication for different tail regions. The x-axis represents
Ž
radiation heat energy. Note both the magnitude of LEPs first negative
.
component: open circles; second negative component: filled circles and
Ž .
the proportion of tail flick filled triangles become larger as the stimula-tion energy increases.
Ž .
increased filled triangles . The magnitudes of both the
Ž .
first negative component open circles and the second
Ž .
negative component filled circles of LEPs increased as stimulus energy increased. The threshold energy of LEPs evoked from the tail base was lower than 60 mJ. Threshold energies of LEPs evoked from the middle tail and tail tip were between 60 and 90 mJ. The response amplitude of LEPs and the proportion of tail flick reached a maximum at an energy of about 120 mJ following tail base
stimula-tion. The maximum response stimulation intensities for middle tail and tail tip stimulation were about 150 mJ. 3.4. Spatiotemporal distribution of stimulus-eÕoked poten-tials
The topographical distribution of cortical potentials evoked by mechanical, electrical, and CO -laser stimula-2
tion of the tail was studied. Examples of stimulation-evoked responses to the three types of stimulation are shown in Figs. 6–8. Evoked potentials recorded from the 12 record-ing sites to mechanical stimulation of the tail base in one rat are illustrated in Fig. 6A. The first biphasic waveform
Ž
can be clearly seen in channels 5 and 9 tail representative .
area of SI . The concentric source to first positive peak Žlatency s 15 ms was localized bilaterally over the tail.
Ž .
representative area of SI Fig. 6B . Bilaterally localized current sink of SI was present at the beginning stage of the
Ž .
large late negative component latency s 30 ms . The spa-Ž
tial distribution of the larger negative peak latency s 50 .
ms is shown at the lower right corner in Fig. 6B. This negative peak showed a localized contour central to the primary somatosensory area similar to the short positive peak. A similar phenomenon was also found in low inten-sity EEPs elicited by electrical stimulation. However, the topographical distribution of the slower negative EEP was
Ž .
much larger with stronger stimulation intensity 0.5 mA . At this intensity, the first biphasic waveform was localized in channels 5 and 9. The longer latency negative peak was,
Ž however, widely spread over several recording sites Fig.
. 7 .
Two distinct components of LEP following CO -laser2
Ž .
stimulation were found at all recording sites Fig. 8A . The faster component was a biphasic waveform. The positive
Ž .
peak of the faster component 48.5 ms had a bilateral concentric current sink at SI, followed by a widespread distribution of the negative peak in the frontal–parietal
Ž . Ž .
cortical area Fig. 8B . The slower component 245 ms also showed a widespread distribution in the topographical
Ž .
map Fig. 8B .
Spatiotemporal characteristics of MEP, EEP, and LEP, including their polarity, latency, conduction velocity, and spatial distribution over the cortical surface, are summa-rized in Table 1.
3.5. Cortical neuronal actiÕities eÕoked by mechanical and laser stimulation
To better understand the far-field or the near-field ori-gin of MEP and LEP, cortical neuronal activities were
Ž . Ž
Fig. 6. Spatial distribution of MEPs. A An example of 12-channel recording of MEPs displayed in related recording sites over the skull indicated at the
. Ž .
inset . Each trace represents the average of 200 trials. The units of the x-axis and y-axis are 25 ms and 50 mV, respectively. B Topographical maps of
Ž w x.
MEPs. The upper trace is the MEP at channel 5 see numbers in the inset of A . Four isopotential maps were made at latencies of 15, 20.5, 30, and 50 ms from the start of the mechanical stimulation, respectively. Note the localized potential peaks at the tail representation area of SI. The unit of the gray scale
Ž . Ž . Ž .
is in microvolts mV . The units of the horizontal and vertical scales are in millimeters mm . The zero point 0,0 is at the bregma. REF: reference electrode; GND: ground.
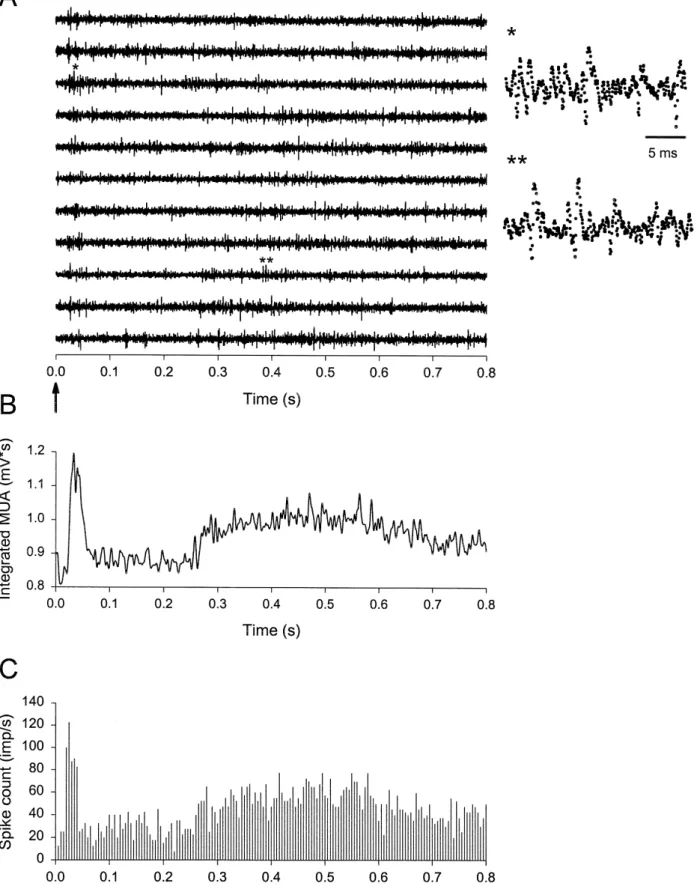
Ž .
recorded using microwires n s 3 . Activities recorded from 1 of the implanted microwire bundles in response to laser irradiation of the tail-base are illustrated in Fig. 9. Responses of individual trials are shown at the top portion of Fig. 9A. Short and long latency intracortical responses
Ž .
could be seen clearly in both the IMUA Fig. 9B and the
Ž .
average spike count Fig. 9C . The temporal relationship of these short and long latency intracortical responses with the short and long latency cortical LEPs can be better appreciated by putting the LEP of another rat along with
Ž .
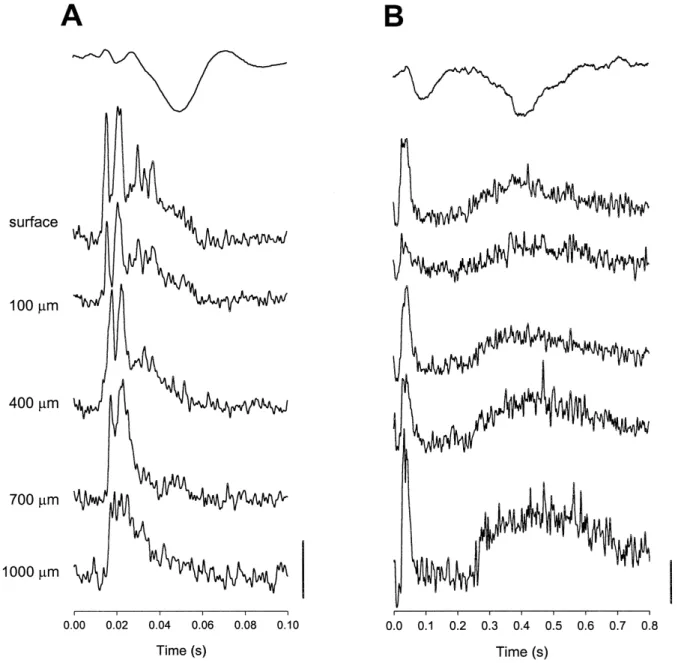
the IMUA traces Fig. 10B, top trace . There were higher multiunit activities in recording sites located at the surface and 400-mm and 1000-mm deeps, 30–60 ms after laser irradiation. For the late component, there were heightened activities throughout the layers. In comparison, the intra-cortical response to mechanical stimulation of the same region of the tail was large throughout the cortex at 15–25 ms, then it shifted to more superficial loci from 30 to 50
Ž .
ms Fig. 10A .
4. Discussion
In the present study, cortical responses to nociceptive inputs from the tail are described for the first time in conscious and freely moving rats. A short latency response corresponding to Ad fibers and a long latency response corresponding to C fibers were observed. Interesting simi-larities and differences were found between these nocicep-tive cortical responses and the tactile cortical responses. 4.1. Cortical response to innocuous stimulation
In the present investigation, mechanical stimulation evoked early surface positive potentials in the tail repre-sentative area of the SI. These findings are consistent with
w x
earlier investigations 1,21,33 . This surface-positive com-ponent is associated with unit activity and current sinks in
Ž .
the middle cortical layers layers IIIrIV , and appears to Ž signal the initial thalamocortical activation of SI Refs. w1,21,33 ; Fig. 10A . In a wakeful condition, a larger andx . more widespread negative peak followed. It is interesting to note that this negative peak is very sensitive to
anesthe-Ž .
sia dotted line in Fig. 1 . Using topographical mapping analysis, we showed that a bilateral negative current sink
Ž .
was generated first at the tail area of SI Fig. 6B , which then spread to frontoparietal areas. This negative peak appeared to be associated with current sinks in superficial
Ž .
cortical layers see Fig. 10A . Our current findings support those of a previous study, which demonstrated that behav-iorally relevant negative potentials may be associated with the most superficial cortical layers IrII in awake monkeys w11,12 . The somatosensory-evoked potential recorded inx awake humans is similar to that observed in the awake
w x
monkey 10 . In general, these results indicate that an early positive peak occurs at SI, followed by a superficial cur-rent sink in and around the SI area.
The low-intensity electrical stimulation-evoked cortical potential has almost identical temporal and spatial patterns compared to those of MEP. Our data are consistent with
w x
results from humans, monkeys and rats 1,21,27,33 . A localized current sink was generated at the middle layer of the primary somatosensory cortex for the fast, near-field initial positive-evoked potential. A large negative-evoked potential followed in the conscious human or animal
sub-w x
jects. This negative component 1,10–12 also has a local-ized origin in the primary somatosensory cortex but origi-nates from more superficial layers.
4.2. Cortical response to noxious stimulation
In the present study, we found that CO -laser stimula-2
tion evokes two major negative components in awake, freely moving rats. Using the same type of stimuli to stimulate paws of halothane-anesthetized rats, Kalliomaki et al. found a positive component with a conduction veloc-ity at 0.7–0.8 mrs, i.e., a C fiber response. It is interesting
Ž
to note that similar conduction velocity value 0.7 mrs, .
Fig. 3 was observed in the present study. This late negative component reversed to a positive wave when the
Ž .
rat was under light anesthesia Fig. 1, right panel . It is Ž
important to note that during this period 2-h after a .
standard i.p. pentobarbital dose , although a reversed form of the longer latency LEP had returned, there was no trace of the shorter latency LEP yet. The shorter latency compo-nent conducting at the Ad range seems to be even more sensitive to modification by anesthesia. Maybe this is why this component was not consistently observed in Kalliomaki
w x
et al. 21 .
Our topographic mapping analysis also confirms that the C fiber-mediated LEP component occupies a more widespread area than those evoked by mechanical or
elec-w x
trical stimulation 21,27 . The current sink of the C fiber-mediated LEP component seems to involve not only the primary somatosensory region but also the motor region of
Ž w x .
the cerebral cortex Ref. 21 ; Fig. 8 . Interestingly, the
Ž . Ž .
Fig. 7. Spatial distribution of EEPs. A A representative example of 12-channel recording of EEP stimulation intensity 0.5 mA is displayed in related
Ž .
recording sites over the skull indicated at the inset . Each trace represents the average of 100 trials. The units of the x-axis and y-axis are 50 ms and 100
Ž . Ž .
mV, respectively. B Topographical maps of the EEPs. The upper trace is the EEP at channel 5 tail representative area of SI . Four isopotential maps were
made at latencies of 16, 20.5, 27, and 49.5 ms from the start of the electrical stimulation, respectively. Note the localized peaks at latencies of 16, 20.5, and
Ž .
27 ms. The longer latency peak at 49.5 ms is represented in a widely distributed area. The unit of the gray scale is in microvolts mV . The units of the
Ž .
Table 1
Summary of spatiotemporal characteristics of MEP, EEP and LEP in freely moving rats
Component Polarity of Latency from Conduction Spatial distribution
Ž . Ž .
major peak Tb ms velocity mrs
MEP 1 Positive 15.6 " 0.6 35 Concentric at SI
2 Negative 49.5 " 2.0 28 Concentric at SI
Ž .
EEP low intensity 1 Positive 17.5 " 0.6 NA Concentric at SI
2 Negative 52.2 " 1.2 NA Concentric at SI
Ž .
EEP high intensity 1 Positive 16.9 " 0.5 NA Concentric at SI
2 Negative 50.3 " 0.8 NA Diffuse
LEP 1 Negative 70.6 " 2.9 22 Diffuse
2 Negative 247 " 8 0.7 Diffuse
Ž .1 Low intensity: 0.3 mA; high intensity: 0.5 mA.
Ž .2 Values are mean " S.E.
Ž .3 MEP: mechanical-evoked potential; EEP: electrical-evoked potential; LEP: laser-evoked potential; Tb: tail base; NA: not available.
same topographical distribution was found for the Ad
Ž .
fiber-mediated LEP component Fig. 8 . These spatial patterns indicate a close association of sensorimotor inte-gration for noxious information processing.
The intracortical data obtained in the present study show that cortical neurons are activated during both LEP components. This is supportive evidence that these compo-nents are cortical in origin. These data also add to the
w x
intracortical recording literature 21,28,29 . Our data are consistent with the laminar distribution of a middle and a deeper layer of cortical neuron activation from C fiber
w x
inputs in anesthetized rats 21 . In addition, we found heightened activities in the superficial cortical layer fol-lowing C fiber activation in freely moving rats. Superfi-cial, middle, and deeper layers of cortical neurons were
Ž .
also activated by Ad fiber input Fig. 10B , with the difference that cortical activation evoked from C fiber input lasted for a longer period. The result is also
consis-w x
tent with previous investigations by Lamour et al. 28,29 , which demonstrated a few superficial neurons responsive to nociceptive stimulation. Percentage-wise, nociceptive superficial cortical neurons were relatively rare in
w x
halothane-anesthetized rats 28,29 . Our data indicate that there may be many more superficial cortical neurons re-sponsive to nociceptive input in awake and freely moving rats.
4.3. Comparison of cortical innocuous and noxious re-sponses
Similarities and differences were found in cortical re-sponses to innocuous mechanical and noxious thermal
stimulation. For both stimuli, the most pronounced re-sponses were seen in the matched area of the primary somatosensory cortex. These larger responses over the primary somatosensory cortex showed intensity-dependent changes in magnitude, indicating their possible utility in the sensory-discrimination function of tactile and pain senses. On the other hand, the slower negative cortical wave seen after strong electrical current or noxious ther-mal heat application to the tail had a more widespread distribution over the cortical surface than did tactile-evoked potentials. The present study also reveals interesting differ-ential modulation actions by barbiturate anesthesia. The first positive peak evoked by innocuous mechanical
stimu-Ž lation was potentiated 5 times after a standard i.p. dose 50
.
mgrkg of sodium pentobarbital. In sharp contrast, the faster Ad peak evoked by radiant heat disappeared com-pletely for more than 3 h with the same barbiturate
treat-w x
ment 35 . Two hours after i.p. barbiturate administration, the slower component of the LEP returned but with a
Ž .
reversed polarity dotted line in Fig. 1 . Barbiturates act directly on vertebrate neurons by enhancing the effects of
Ž .
the inhibitory transmitter, g-aminobutyric acid GABA w2,40 . Shyu et al. 36 found that pentobarbital abolishesx w x field potentials of the superficial cortical layer without affecting those of the middle cortical layer for central lateral nucleus stimulation in chloralose-anesthetized cat.
w x
Other studies 10,38 also indicate that activities of neurons in the superficial layer of the cerebral cortex are very sensitive to anesthesia. Selectively abolishing superficial layer activity more than the activity in deeper cortical layers may cause the polarity changes observed in the Ad and C fiber-evoked potentials during pentobarbital
anesthe-Ž . Ž .
Fig. 8. Spatial distribution of LEPs. A An example of 12-channel recordings of LEPs 12 W at tail base displayed in related recording sites over the skull
Žindicated at the inset . Each trace represents the average of more than 50 trials. The units of the x-axis and y-axis are 100 ms and 100 mV, respectively.. Ž .B Topographical map of the LEPs. The upper trace is the LEP from channel 5. Three isopotential maps are made at latencies of 48.5, 82.5, 245 ms from
Ž .
the start of the CO -laser stimulation point, respectively. Note a localized distribution T s 48.5 ms followed by a widespread distributed component2 ŽT s 82.5 ms . A widespread potential distribution was also found for the second negative component T s 245 ms . The unit of the gray scale is in. Ž .
Ž . Ž .
Ž . Ž .
Fig. 9. Response of intracortical multiunit activity to laser irradiation 15 W of the middle tail region. A Eleven individual trials. Arrow points to the
Ž
start of the stimulation. On the right are expanded views of two segments relative to the two components of LEP )first component; ))second
. Ž . Ž . Ž . Ž .
component . Note multiunit sampling rate: 30 kHz activities. B Averaged 90 trials integrated rectified multiunit activity MUA obtained from the
Ž .
Ž . Ž .
Fig. 10. Responses of intracortical multiunit recording at different depths following mechanical A and laser heat B stimulation at the middle tail. Recording depth is indicated on the left side. Each trace represents averaged rectified and integrated multiunit activity from more than 50 trials. The
Ž . Ž . Ž .
vertical bars are 0.5 mV s for A , 0.1 mV s for B , and 10 mV for C .
sia in the present study. The other possibility is that barbiturate modulates the activity of the nociceptive input
w x
or the ascending nociceptive pathway 13,26,38 .
In summary, with chronically implanted cortical elec-trodes, two negative cortical potentials were found follow-ing laser stimulation of tails of awake and freely movfollow-ing rats. Peripheral conduction velocity calculations indicate that these two evoked potentials correspond to Ad and C fiber activation, respectively. These negative potentials, in contrast to the robust short latency positive potential, are highly susceptive to modulation by barbiturate anesthesia. Because of this state dependency, these cerebral potentials might be related to the cognitive and affective part of the pain sensation.
Acknowledgements
We thank Professors R.C.S. Lin and J.K. Chapin, Al-legheny University, USA, for their comments. We thank Mr. Daniel P. Chamberlin for English editing. The present study was supported by grants NSC84-2311-B002-027 and NSC86-2313-B002-123 from the National Science Council
Ž .
of the Republic of China Taiwan .
References
w x1 J.C. Arezzo, H.G. Vaughan Jr., A.D. Legatt, Topography and
mon-key: II. Cortical components, Electroencephalogr. Clin.
Neurophys-Ž .
iol. 28 1981 1–18.
w x2 J.L. Baker, D.A. Mathers, GABA analogues activate channels of
different duration on clustered mouse spinal neurons, Science 212
Ž1981 358–361..
w x3 B. Bromm, H. Neitzel, A. Tecklenburg, R.-D. Treede, Evoked
cerebral potential correlates of C fiber activity in man, Neurosci.
Ž .
Lett. 43 1983 109–114.
w x4 B. Bromm, J.E. Desmedt Eds. , Pain and the brain, from nocicep-Ž .
tion to cognition, Advances in Pain Research and Therapy, Vol. 22, Raven, New York, 1995.
w x5 B. Bromm, M.T. Jahnke, R.-D. Treede, Responses of human
cuta-neous afferents to CO -laser stimuli causing pain, Exp. Brain Res.2
Ž .
55 1984 158–166.
w x7 B. Bromm, R.-D. Treede, Human cerebral potentials evoked by
Ž .
CO -laser stimuli causing pain, Exp. Brain Res. 67 1987 153–162.2 w x8 J.N. Campbell, S.N. Raja, R.A. Meyer, Halothane sensitizes
cuta-Ž .
neous nociceptors in monkeys, J. Neurophysiol. 52 1984 762–770.
w x9 A. Carmon, Y. Dotan, Y. Sarne, Correlation of subjective pain
experience with cerebral evoked responses to noxious thermal
stimu-Ž .
lation, Exp. Brain Res. 33 1978 445–453.
w10 L.J. Cauller, Layer I of primary sensory neocortex: where top-downx
Ž .
converges upon bottom-up, Behav. Brain Res. 71 1995 163–170.
w11 L.J. Cauller, A.T. Kulics, A comparison of awake and sleepingx
cortical states by analysis of the somatosensory-evoked response of
Ž .
postcentral area 1 in rhesus monkey, Exp. Brain Res. 72 1988 584–592.
w12 L.J. Cauller, A.T. Kulics, The neural basis of the behaviorallyx
relevant N1 component of the somatosensory-evoked potential in SI cortex of awake monkeys: evidence that backward cortical
projec-Ž .
tions signal conscious touch sensation, Exp. Brain Res. 84 1991 607–619.
w13 J.K. Chapin, B.D. Waterhouse, D.J. Woodward, Differences inx
cutaneous sensory response properties of single somatosensory corti-cal neurons in awake and halothane anesthetized rats, Brain Res.
Ž .
Bull. 6 1981 63–70.
w14 J.K. Chapin, C.-S. Lin, The somatic sensory cortex of the rat, in: B.x Ž .
Kolb, R.C. Tees Eds. , The Cerebral Cortex of the Rat, MIT, Cambridge, 1990, pp. 341–380.
w15 M. Devor, A. Carmon, R. Frostig, Primary afferent and spinalx
sensory neurons that respond to brief pulses of intense infrared laser
Ž .
radiation: a preliminary survey in rats, Exp. Neurol. 76 1982 483–494.
w16 W.K. Dong, L.D. Salonen, Y. Kawakami, T. Shiwaku, M. Kauko-x
ranta, R.F. Martin, Nociceptive responses of trigeminal neurons in
Ž .
SII-7b cortex of awake monkey, Brain Res. 484 1989 314–324.
w17 H. Head, G. Holms, Sensory disturbances from cerebral lesions,x
Ž .
Brain 34 1911 102–254.
w18 R.F. Hellon, N.K. Misra, K.A. Provins, Neurons in the somatosen-x
sory cortex of the rat responding to scrotal skin temperature changes,
Ž .
J. Physiol. 232 1973 401–411.
w20 A.K. Jones, W.D. Brown, K.J. Friston, L.Y. Qi, R.S. Frackowiak,x
Cortical and subcortical localization of response to pain in man using positron emission tomography, Proc. R. Soc. London B 244
Ž1991 39–44..
w21 J. Kalliomaki, H.-R. Weng, H.-J. Nilsson, J. Schouenborg, Nocicep-x Ž .
tive C fiber input to the primary somatosensory cortex SI . A field
Ž .
potential study in the rat, Brain Res. 622 1993 262–270.
w22 D.R. Kenshalo, E.H. Chudler, F. Anton, R. Dubner, SI nociceptivex
neurons participate in the encoding process by which monkey
perceive the intensity of noxious thermal stimulation, Brain Res. 454
Ž1988 378–382..
w23 D.R. Kenshalo, O. Isensee, Responses of primate SI cortical neuronsx Ž .
to noxious stimuli, J. Neurophysiol. 50 1983 1479–1496.
w24 D.R. Kenshalo, W.D. Willis, The role of cerebral cortex in painx Ž .
system, in: A. Peter, E.G. Jones Eds. , Cerebral Cortex: Normal and Altered States of Function, Vol. 9, Plenum, New York, 1991, pp. 153–212.
w25 Y. Kitamura, R. Kakigi, M. Hoshiyama, S. Koyama, M. Shimojo, S.x
Watanabe, Pain-related somatosensory evoked magnetic fields,
Elec-Ž .
troencephalogr. Clin. Neurophysiol. 95 1995 463–474.
w26 E. Kochs, R.-D. Treede, J. Schulte am Esch, B. Bromm, Modulationx
of pain-related somatosensory evoked potentials by general
anesthe-Ž .
sia, Anesth. Analg. 71 1990 225–230.
w27 V. Kunde, R.-D. Treede, Topography of middle-latency somatosen-x
sory evoked potentials following painful laser stimuli and non-pain-ful electrical stimuli, Electroencephalogr. Clin. Neurophysiol. 88
Ž1993 280–289..
w28 Y. Lamour, G. Guilbaud, J.C. Willer, Rat somatosensory SmIx Ž .
cortex: II. Laminar and columnar organization of noxious and
Ž .
non-noxious inputs, Exp. Brain Res. 49 1983 46–54.
w29 Y. Lamour, J.C. Willer, G. Guilbaud, Rat somatosensory SmIx Ž .
cortex: I. Characteristics of neuronal responses to noxious stimula-tion and comparison with responses to non-noxious stimulastimula-tion,
Ž .
Exp. Brain Res. 49 1983 35–45.
w30 N. Matsumoto, T. Sato, T.A. Suzuki, Characteristics of the toothx
pulp driven neurons in a functional column of the cat somatosensory
Ž . Ž .
cortex SI , Exp. Brain Res. 74 1988 263–271.
w31 F. Perrin, J. Pernier, O. Bertrand, M.H. Giard, J.F. Echallier, Map-x
ping of scalp potentials by surface spline interpolation,
Electroen-Ž .
cephalogr. Clin. Neurophysiol. 66 1987 75–81.
w32 A. Roos, B. Rydenhag, S.A. Andersson, Cortical responses evokedx
by tooth pulp stimulation in the cat. Surface and intracortical
Ž .
responses, Pain 1982 247–265.
w33 J. Schouenborg, J. Kalliomaki, P. Gustavsson, I. Rosen, Field poten-x Ž .
tials evoked in the rat somatosensory cortex SI by impulses in
Ž .
cutaneous Ab- and C-fibres, Brain Res. 397 1986 86–92.
w34 F.-Z. Shaw, R.-F. Chen, E.H.-Y. Lee, H.-W. Tsao, C.-T. Yen,x
Mapping of cortical field potentials evoked by electrical, mechanical and laser heat stimulation of the rat tail, Soc. Neurosci. Abstr. 23
Ž1997 440..
w35 F.-Z. Shaw, R.-F. Chen, H.-W. Tsao, C.-T. Yen, A multichannelx
system for recording and analysis of cortical field potentials in freely
Ž .
moving rats, J. Neurosci. Methods in press .
w36 B.C. Shyu, B. Olausson, B. Rydenhag, Field potential analysis of thex
cortical projection of the central lateral nucleus in the cat, Acta
Ž .
Physiol. Scand. 137 1989 503–512.
w37 J.D. Talbot, S. Marrett, A.C. Evans, E. Meyer, M.C. Bushnell, G.H.x
Duncan, Multiple representations of pain in human cerebral cortex,
Ž .
Science 251 1991 1355–1358.
w38 B.A. Vogt, The role of layer I in cortical function, in: A. Peter, E.G.x Ž .
Jones Eds. , Cerebral Cortex: Normal and Altered States of Func-tion, Vol. 9, Plenum, New York, 1991, pp. 49–80.
w39 C.-T. Yen, C.-H. Huang, S.-E. Fu, Surface temperature change,x
cortical evoked potential and pain behavior elicited by CO2 lasers,
Ž .
Chin. J. Physiol. 37 1994 193–199.
w40 S.A. Zimmerman, M.V. Jones, N.L. Harrison, Potentiation of g-x
aminobutyric acid receptor Cly
current correlates with in vivo
A
Ž .