Real-Time Spectroscopy of Single-Walled Carbon Nanotubes for
Negative Time Delays by Using a Few-Cycle Pulse Laser
Takayoshi Kobayashi,*
,†,‡,§,#Zhaogang Nie,
†,‡Bing Xue,
†,‡Hiromichi Kataura,
⊥Youichi Sakakibara,
∥and Yasumitsu Miyata
▽†Advanced Ultrafast Laser Research Center, and Department of Engineering Science, Faculty of Informatics and Engineering,
University of Electro-Communications (UEC), 1-5-1 Chofugaoka, Chofu, Tokyo 182-8585, Japan
‡Core Research for Evolutional Science and Technology (CREST), Japan Science and Technology Agency, 4-1-8 Honcho,
Kawaguchi, Saitama 332-0012, Japan
§Department of Electrophysics, National Chiao-Tung University, Hsinchu 30010, Taiwan #Institute of Laser Engineering, Osaka University, 2-6 Yamada-oka, Suita, Osaka 565-0871, Japan ⊥Nanosystem Research Institute, AIST, Tsukuba, Ibaraki 305-8565, Japan
∥Nanoelectronics Research Institute, AIST, Tsukuba, Japan
▽Department of Chemistry, Nagoya University, Nagoya 464-8603, Japan
*
S Supporting InformationABSTRACT: Several investigations using the femtosecond pump−probe technique have been made for coherent phonon dynamics in single-walled carbon nanotubes (SWNTs), which are promising candidates as devices for nanoelectronics and photonics due to their unique properties. However, the most relevant spectroscopic analyses by far have been performed in the positive time range, with the pump pulse coming before the probe. We studied the real-time coherent phonon in SWNTs using 7.1-fs pump−probe measurements for negative time delays in which vibronic coherence between the ground state and exciton state can be observed. Coherent vibrations corresponding to the radial breathing mode caused by the wave packet generated in the exciton state were detected, in contrast to the ground-state wave packet dynamics for positive delays previously reported. The present results show that excited-state wave packets contribute greatly to radial breathing modes in four, (6,5), (6,4), (7,5), and (8,3), chiral systems, but very little to G modes, even though the oscillation period of the latter is 20 fs, which is much shorter than the 100 fs of the exciton life. We discussed the differences in dephasing times in the four different chiral systems.
1. INTRODUCTION
Single-walled carbon nanotubes (SWNTs) have unique mechanical, electronic, and optical properties due to their one-dimensional nanostructures and are promising candidates as devices for nanoelectronics and photonics.1−3 The peculiar optical properties of one-dimensional systems have been studied extensively in various other materials such as conjugated polymers4,5 and J-aggregates,6 providing a play-ground for studying the dynamics of confined electrons and phonons and their interplay.4,7Advances in optical studies such as Raman scattering and photoluminescence excitation spectroscopies have led to definitive assignments of spectral features to specific chirality classes given by a set of two integers (n,m).8−11 Recent theoretical and experimental studies have illuminated the importance of pronounced excitonic effects in interband optical processes and have revealed a variety of phonon-assisted peaks, suggesting strong exciton−phonon coupling,11−15 which is at the heart of many phenomena in SWNTs. Significant efforts have been made to investigate the
coherent phonon dynamics in SWNTs using the pump−probe technique in the femtosecond time regime, i.e., coherent phonon spectroscopy or real-time vibrational spectrosco-py.16−25 However, the most relevant spectroscopic analyses by far have generally been performed in the positive time range, with the pump pulse coming before the probe to perturb the absorption spectrum of the medium, which is subsequently probed after a set time delay. In comparison with Raman spectroscopy, which is relevant to ground-state vibrations,26 real-time spectroscopy is much more suitable for studying the excited-state electronic relaxation and vibrational dynamics of materials under the same excitation and environmental conditions. However, the coherent phonon vibrations observed in the femtosecond pump/probe experiment include wave packet motion effects in both the ground and excited states,
Received: September 14, 2013
Revised: November 20, 2013
Published: January 16, 2014
which make it difficult to ascribe the signals to either of the two states.27,28To date, only a limited number of experiments have overcome this difficulty by using chirped-pulse excitation29,30 and detailed analysis of the delay-time dependence of pump-dump pulses in stimulated Raman scattering.31
In contrast to investigation using positive time ranges, investigation of the real-time traces for negative time delays, whereby the probe pulse precedes the pump pulse, can provide information on vibronic polarization modulated by phonons only in the excited states.28Previous reports have discussed the experimental results observed in the negative time range in terms of perturbed free-induction decay and coherent coupling.32−37 The difference absorption spectrum has been calculated for a two-level system and has already been applied to molecular systems.38,39Theoretically, in this coherent regime it is the probe that“deposits” a polarization in the medium, and this subsequently relaxes over time. The pump then“probes” the decay by perturbing the probe polarization, although no pump energy is absorbed by the sample medium, and the signal is detected in the direction of the probe beam.32,33 The perturbed free-induction decay term, which occurs only in the negative time range, can be used to determine the electronic phase relaxation time and to study the vibrational phase relaxation dynamics in excited electronic states.28Recently, we reported the experimental observation of absorbance changes for several molecular systems for negative time delays.28,40This negative-time measurement is a powerful method for studying coherent phonon vibration in excited states without the effect of wave packet motion in the ground states under the same experimental condition as the real population relaxation associated with vibrational dynamics, including both the ground state and excited state. In addition, knowledge of electronic dephasing dynamics is very important for elucidating the properties of excited states and the dynamics of optical nonlinear processes, which offer information on the response dynamics of various device applications such as optical switching and optical signal processing.41,42The time sequences of twofields of the pump and one from the probe are the same pulse ordering as that denoted by type SIIIconfiguration in the two-dimensional spectroscopy.43,44 In this paper, we report what is to the best of our knowledge thefirst observation of the vibrational and electronic coherence dynamics of SWNTs in negative time delays using a pump−probe technique with an extremely short (7.1 fs) and broad bandwidth pulse in the visible spectrum and using an ultrahigh-sensitivity broadband detection system composed of a polychromator and a multichannel lock-in amplifier, which can detect 128 different wavelengths simultaneously. Vibrational and electronic phase relaxation dynamics studied under the same conditions are elucidated and compared with the results reported in the positive time range.
2. EXPERIMENTAL METHOD
2.1. Pump−Probe Experiment. The details of the ultrafast pump−probe experiment were described in our previous papers.28,45 In short, the main light source was a 7.1-fs pulse from a noncollinear parametric amplifier (NOPA) developed by our group.46,47The spectrum of the output pulse from the NOPA extended from 520 to 725 nm. The focus areas of the pump and probe pulses were about 100 and 75 μm2,
respectively, with a common center on the surface of the sample film. The polarizations of the pump and probe pulses were parallel to each other. In the pump−probe experiment,
the signal was spectrally dispersed with a polychromator (JASCO, M25-TP) over 128 photon energies (wavelengths) from 1.71 to 2.37 eV (from 722 to 524 nm). The pump−probe step size is 1 fs. All measurements were performed at room temperature (295± 1 K).
2.2. Sample Preparation. The details of the sample preparation were described in our previous paper. In short, a CoMoCat synthesized sample was prepared using a silica support and a bimetallic catalyst with a Co:Mo molar ratio of 1:3.48−50
3. RESULTS AND DISCUSSION
3.1. Stationary Absorption Spectrum. Figure 1 shows the stationary absorption spectrum of SWNTs without further
processes of fractionation of separation and extraction. More than 15 peaks and shoulders can be distinguished in the spectrum. Their assignment was made according to the relation between the transition energy and chiral index as set in the literature.8 The broadband visible laser pulse with photon energy in the 1.7−2.4 eV range was resonant with the second exciton transitions (E22) in the tubes. The chirality assignments
of some absorption bands and shoulders around 1.46, 1.7, 2.4, and 2.7 eV in the spectrum were not made because they might have been shared by more than one type of tube.
3.2. Two-Dimensional (2D) Real-Time Vibration Spectra. In the pump−probe experiment for a simplified two-level system, the differential absorbance ΔA(ω), propor-tional to the differences of the imaginary parts of the susceptibilities, can be given by
ω ω ω Δ + ⊗ * − ⊗ * ⎪ ⎪ ⎧ ⎨ ⎩ A f e E t N t E t F t E t E t E t F t E t E t F ( ): Im ( ) ( ) [ ( ) ( ) ( )[ ( ) ( ( ) ( ))] ( )[ ( ) ( ( ) ( ))]]} 2 pr pr pu(2) pu 1 pu pu pu 1 pu pr (1)
where Im stands for the imaginary part,⊗ denotes convolution, F[A(t)]is the Fourier transform of A(t), Epu(t) and Epr(t) are
the pump and probefields, respectively, and Npu(2)(t) represents
the population change induced by the pumpfield. Definitions Figure 1.Stationary absorption spectrum of SWNTs, showing the E11
and E22transitions in visible and infrared (1.2−2.7 eV) range, and the
of the remaining terms are given elsewhere.32The three terms contained in the right side of eq 1 represent the level population (LP) term, pump polarization coupling (PPC) term, and perturbed free-induction decay (PFD) term, respectively. Reports published recently have mostly focused on LP, thefirst term,16−25 which appears only after the onset of the pump pulse, corresponding to the positive time region. The PPC term arises from the coherent coupling between pumpfield-induced polarization and the probefield appearing only when the probe and pump overlap. In contrast to thefirst term, the third term, PFD, represents the case in which the probe pulse comes earlier than the pump pulse, contributing only to the negative time delay, and there is no temporal overlap between them.
The 2D differential absorption ΔA(Epr, t) as a function of
probe−photon energy Eprand pump−probe delay time t from
0 to −200 fs is displayed in Figure 2a. The real-time traces
show sharp and intense peaks (or spikes) around zero delay time and noticeable slow-decay signals with afinite size of ΔA delaying by as much as−150 fs. The peaks are caused by PPC when the pump and probe temporally overlap with each other, and the slow-decay signals are due to the PFD process. Because the coupling term is given by the convolution function of the pump and probe pulse and provides no contribution outside of this function, it is effective only when the pump pulse overlaps the probe pulse in time close to the zero time range on the order of the pump pulse duration (7.1 fs).32,33
Similar to the positive time results,16−18there are also some periodic structures in the time traces. For negative time delays, the preceding probe pulse at first generates macroscopic electronic polarization in the sample, and then later, the coming intense pump field interferes with the probe polarization, resulting in the formation of a grating. PFD, the third term in eq 1, is generated by another electronicfield component of the pump pulse to be diffracted into the probe direction, satisfying the causality. In the present case, the polarization generated by the probe pulse is not due to a pure electronic transition but to a vibronic transition. Therefore, the observed vibrations are theoretically due to the vibronic transition between the vibration levels in the ground electronic states and the vibronic excited states. The excited-state vibrational modes can still be observed without a population in the excited state in the negative time range because the vibronic polarization is modulated by lattice (or molecular) vibrations in the excited states when the vibrational mode is at the ground level in the ground electronic state.28The advantages of this method are summarized in the following way. In case of positive time the signal can both be due to the ground state or due to excited state and because of this ambiguity it is difficult to discuss clearly the vibrational dynamics. However, in the case of negative time experiment only the excited vibronic coherence can be studied. Another advantage is the ability of the study of the electronic excited-state coherence relaxation and vibrational coherence decay under the same condition of laser and samples. Usually the study of electronic and vibration requires two different sets of lasers and detection systems. Also by tuning the pump laser using a spectral filter, coherence phenomena in some spectral ranges can be studied with a bandwidth in a specific range with the expense of time resolution.
In the case of SWNTs the main absorption spectra in near-infrared and visible range originate from electronic transition from the highest valence band (v1) to the lowest conduction
band (c1) with E11 of about 8000 cm−1 and that from the
second highest valence band (v2) to the second lowest conduction band (c2) with energy E22 of about 16 000
cm−1.51,52 The laser spectrum used in the present study is extending in the range of 520−720 nm (corresponding to 19 200−13 800 cm−1) as described in our previous paper.45
Therefore vibronic coherence above-discussed is due to the electronic (vibronic coupling) connecting between the ground state and E22 state, which is the excitation from v2 to c2 in a SWNT. The electronic coupling and/or vibronic coupling between E11 and E22 excitons are not possible. The coupling including the ground state, E11, and E22is also not possible, and
hence electronic coherences between E11 and E22 are not
excited.
Figure 2b depicts the differential absorption (ΔA) lines obtained by intersecting the 2D plot ofΔA in Figure 2a at delay times from 0 to−100 fs with a 10-fs step. Three features are Figure 2.(a) 2D display ofΔA(Epr, t) as functions of probe photon
energy, Epr, and pump−probe delay time, t. The solid and dotted lines
are simulated traces of fringe peak and valley positions respectively. (b) Probe photon energy dependences ofΔA at the delay times from 0 to−100 fs with a 10-fs step. The blue dashed lines and the arrows are drawn as a guide to the eye, showing the peak position shifts with time passage.
shown in thisfigure. First is the prominent “bleaching” located at 2.18, 1.88, and 1.77 eV, which corresponds to the peak wavelength of the absorption (bleaching) spectra of (6,5), (7,5), and (9,7). There is an unclear structure at ∼2.08 eV, probably due to the shoulder from the spectrum of (6,4). The second feature is the hyperbolic contour curves asymptotically approaching these peaks. Third is the quasi-periodic line features present parallel to the zero-delay time line of the horizontal axis. The third feature is buried by the hyperbolic-appearing contour at the shorter negative delay time, and they start to be clear at longer negative delay than about−80 fs.
Thefirst feature, bleaching, appears in the same positions as in the positive delay time data.16,18The location of the intense bleaching is consistent with that of the E22transitions in Figure
1. Brito Cruz et al.32 and Joffre et al.53 also reported the existence of intense bleaching. It can be explained in the following way. The amplitude of the grating formed by the interference between the probe polarization and pumpfield is reduced when the probe field is virtually absorbed during interaction with the sample, even though it is not really absorbed in the sense of true energy transfer from the probe light to the sample. The virtual electronic energy oscillates between the sample electronic state and probefield, as in the case of Rabi oscillation. The diffracted pump field intensity is then reduced because of the smaller grating modulation amplitude. Then, the amplitude of the PFD signal has a similar spectral dependence to the electronic population observed in the positive delay time.45
The second feature of the hyperbolic structure can be explained in terms of frequency domain interference between the pumpfield at zero delay and probe-induced polarization of which fringe separation in the spectral interference pattern is inversely proportional to the separation between the two.
The negative time transmittance change is given by53
ω ω ω ω ω ω ω ω ω ω ω Δ ∝ − − × − − − − − + T t I t T t T t T ( , ) ( )exp( / ) [cos(( ) ) ( )sin(( ) )] /[( ) (1/ ) ] r p 0 2 0 2 0 0 02 22 (2)
Here, Ip(ω) is the probe light spectrum, T2 is the electronic dephasing time, and ω0 and ω are resonance frequency and
probe light frequency, respectively. The right-hand side is transformed into the following equations:
ω ω ω ω ω θ Δ ∝ − − − + T t I T t T t ( , ) ( ) exp( / ) [cos(( ) ) )] r p 0 22 2 0 (3) θ= tan ( (−1T2 ω−ω0)) (4) Equations 2 and 3 show that the coherent transient spectrum has a sinusoidal modulation with a modulation period given by 2π/(ω − ω0) with the initial phase (at zero delay time) ofθ. It
maintains the form of exponentially decaying Lorentzian function with half-width of half-maximum of (1/T2). Because
of the (co)sinusoidal modulation, the modulation can appear several times (in the frequency domain) as seen in the range of 2.35−2.18 eV, where the transient absorbances in both negative time and positive time ranges are most intense. There is a complex structure in the range of 2.07 eV because of the coherent perturbed decay interference between the converging signal to 2.18 and∼2.08 eV. There are two more converging frequencies at 2.89 and 1.78 eV. As these modulated spectra are
at the center of the resonance frequency ofω0in the coherent transient spectrum, this initial phase at the frequency is 0π, but at near resonance frequencyω a small phase shift determined by eq 4 is expected. Using the equation we plotted the fringe peak and valley positions with solid and dotted lines, respectively, in Figure 2a, and the theoretical expectation is found to be satisfied.
The third feature of the coherent transient spectrum is vibrational oscillation. As the limited life of the electronic phase decay signals which molecular vibration is providing modu-lation, it is difficult to determine the vibrational frequency precisely. It decays not only because of vibrational phase decay (including both homogeneous and inhomogeneous decay) but also because of electronic phase decay. In this way, the decay is different from that in the positive decay range, which is caused by both vibrational phase decay and electronic population decay. Therefore, it disappears even before the lattice system comes into equilibrium due to vibrational population decay.
As previously described, the PPC and PFD terms can both contribute to the differential absorption signals for negative time delays. TheΔA line at zero time is governed by the PPC term, which occurs only around zero delay, whereas for delays of longer than 10 fs, most of the signal should be due to the PFD term. In theory, the PPC term is proportional to the pump-induced polarization present at the time the probe is coexisting with the pump at the sample, whereas the PFD term is proportional to the remaining probe-induced polarization. This occurs because the presence of the pump field modifies the otherwise free decay of the polarization that is“deposited” by the probefield.32,33For the PPC term, with our ultrabroad optical pulses it is possible to excite polarizations in a band of states that are resonant with the pump energy. Because the PFD term represents the process of the relaxation of macroscopic polarization corresponding to the transition between the excited vibronic state and the ground state, the sign ofΔA and its vibrational and electronic decay should also be dependent on the relevant vibronic state belonging to the electronic excited states.
In addition, as shown in Figure 2b, there is a perceptible transition energy variation for the two strongest peak positions at ∼2.16 eV (572 nm) and ∼1.92 eV (650 nm) with the passage of time. This could occur for two reasons: the transition energy could be modulated by coherent phonon vibrations, as will be described later, or the macroscopic electronic coherent polarization dephasing time could be very different for different chiralities with absorption bands adjacent to each other. Then, their peak positions would be affected over time due to the overlap of the different decay components.
3.2. Electronic Phase Relaxation Time. We can use two methods to measure the electronic coherence decay time. The first uses eq 3, and the second uses the coefficient of the modulation term in the left side of eq 2.
In the negative time range, the PFD term increases with the electronic dephasing time constant, T2el, as described in eq 2,
and shuts off quickly for times later than the peak of the pump pulse because it is only responsive to the presence of the pump following the probe.32,33The vibrational dephasing time T2vibis
mostly on the order of picoseconds in many molecules, whereas the T2el of medium-size molecules at room temperature is
typically as short as a few tens of femtoseconds. Pulses that are at least shorter than 10 fs are thus required to study the electronic and vibrational dephasing times simultaneously.41 The appearance of the slow PFD process and oscillatory
structures discussed above is proof that T2elis much longer than
the pump duration (7.1 fs).
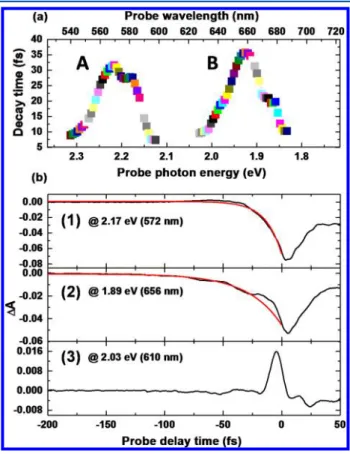
The dephasing time of the electronic coherence under the experimental conditions was determined by assuming that the time traces followed afirst-exponential decay in spectral ranges where the interference contribution was weak relative to that of the PFD. The results are displayed in Figure 3a. Second-order
exponential fitting was also performed because there were spectral overlaps for adjacent chiralities. However, the two time constants obtained were very close to each other and almost equal to the first-exponential fittings. The single-exponential fitting was thus approximately successful here, which also indicates that the dephasing times were very close for different chiralities in this sample.
Figure 3a shows that the decay time constant is also probe photon energy dependent, similar to the behavior of PFD as a
same function. There could be two reasons for this. First, the PFD could be the process of the relaxation of macroscopic polarization corresponding to the transition between the excited vibronic states and ground states, as described above. Then, the sign ofΔA and its decay would be dependent on the relevant vibronic state belonging to the same electronic excited states. Because the PFD term would be proportional to the unperturbed population differences in this scenario, the initial decay intensity would be different according to the absorption cross section of different transitions. Second, the PPC and PFD terms could have mixed contributions at negative time near the zero delay time. The sum of the two contributions could be either constructive or destructive depending on the sign of the two terms. Because the coherent term should provide no contribution outside the convolution function of pump and probe pulse, the decay could be steeper than that predicted based on T2el owing to the dominant contribution of the
coherent term with a minor contribution of the PFD term, especially when the sign of the PFD term is opposite that of the PPC term. Thus in some spectral ranges, it would be difficult to determine the exact time constants because of the mixed contributions of the two terms near the zero time delay, as represented by line 3 in Figure 3b. Therefore, the longest decay time is considered to be minimally affected by the PPC term and is consequently closest to the true electronic dephasing time.
The single-exponential fittings of the dephasing time corresponding to the two maxima in ranges A and B in Figure 3a are demonstrated by lines 1 and 2 in Figure 3b, respectively. The maximum phase relaxation time is 32± 1 fs in range A and 36 ± 1 fs in range B. The chiral systems of (6,5) and (7,5) mainly contribute to ranges of A and B, respectively. The spectral decomposition reported in our previous paper45gave the results of spectral half-widths of (6,5) and (7,5), which are 89.9 and 63.9 meV, respectively. If we assume that the widths are dominantly determined by homogeneous contribution only, the electronic dephasing time T2elof the coherence between the
ground state and the lowest excited state is determined to be in the range of 60−40 fs. They are 40.5, 59.7, 55.0, and 55.7 fs for (6,5), (6,4), (7,5), and (8,3), respectively. The electronic (polarization) dephasing time is substantially longer than the pump duration Tpu = 7.1 fs (T2el ≫ T
pu).
32
This is the prerequisite that needs to be fulfilled for a noticeable signal to be observed for negative delays in the case of the simple two-level system. In addition, the decay lines in Figure 3b are not following pure exponential decays. Clearly visible oscillatory modulation is superimposed on the exponential decay lines. These periodic oscillations are consistent with those in Figure 2a, indicating the modulation of the vibronic polarization by lattice vibrations in excited states.
Here, we discuss the various components that contribute to the electronic dephasing time of the four chiral systems, (6,5), Figure 3. (a) Probe photon energy dependence of electronic
dephasing time estimated by single-exponential function fitting. (b) Negative time traces (black lines) corresponding to the two maximum values in ranges A and B in (a), and theirfitting (red lines) with single-exponential function. A goodfitting by single-exponential for line (3) cannot be achieved because in this case the pump polarization coupling effect is too dominant to determine the decay time.
Table 1. Spectral Widths of the Chiral Components Separated by Simulation and Widths Obtained from the Electronic Dephasing Time by the Negative Time Method
chirality probe wavelength (nm) probe photon energy (eV) fwhm of absorption spectrum (meV)45
dephasing time from negative time measurement (fs)
calcd fwhm from dephasing time (meV)
1/(k2* + k20) (fs) k2* + k20 (1013s−1) (6,5) 569.5 2.18 90 31.6 262 47.0 2.13 (6,4) 580.4 2.14 65 27.8 198 58.0 1.72 (7,5) 658.6 1.88 64 35.7 232 60.5 1.65 (8,3) 675.8 1.83 49 19.4 426 26.7 3.75
(6,4), (7,5), and (8,3), obtained by the negative time experiment, which are listed in Table 1.
The observed dephasing time T2 = 1/k2 includes the contributions of the population decay τ1 = 1/k1 of the E22
exciton as determined in a previous paper,45 the inhomoge-neous broadening T*2= 1/k*2, and pure dephasing T02= 1/k20
using the following equation:
τ = + * + = + * + T T T k k k k 1 1 2 1 1 , (1/2) 2 1 2 02 2 1 2 2 0 (5) Using the equation, we can obtain the value of k*2+ k20, as
shown in Table 1. It is difficult to separate the effects of inhomogeneous broadening T*2 = 1/k*2 and pure dephasing T02= 1/k20from the calculation. However, we can tell that the
electronic decoherence time of the E22 exciton is longer than 47, 58, 61, and 27 fs in (6,5), (6,4), (7,5), and (8,3), respectively.
From the dephasing lifetime values, the width of each spectrum can be calculated, as listed in the table. The table shows that the spectra of several of the chiral systems heavily overlap but the spectral widths of the components can be separately obtained using the relation T2Δω = π between the
electronic dephasing time T2 and the full width at half-maximum (fwhm) Δω of the band if the absorption band is mainly determined by homogeneous broadening. Even in the case of a mixture of homogeneous and inhomogeneous broadening, the factor does not change much. This result suggests that the estimation of the spectral widths of bands that overlap with each other can be separated by the negative time method. In our previous paper,45we attempted to separate the spectral widths of chiral components by simulation with the Voigt function, as shown in Table S1 of the Supporting Information. The widths obtained by this simulation method suffered from the overlapping tail of the absorption spectrum. It is clear from the spectra of the sample in Figures S1 and S2 in the Supporting Information that there are broad basal widths in the spectrum. After removing the broad basal widths, the estimated widths become about three times narrower than those shown in Table 1. The corrected values of the fwhm of the bands are then nearly equal to those obtained from the dephasing time except for (8,3), which is only a shoulder of (7,5). Therefore, this method is very powerful for estimating the spectral widths of each component in SWNTs systems with many chiral systems.
3.3. Fourier Transform Power Spectra and Probe Photon Energy-Dependent Amplitudes. As previously described, excited-state vibrational modes can still be observed without a population excitation in the negative time range because the electric polarization can be modulated by lattice vibrations in excited states. Tofind the vibrational signals, the time traces in the negative and positive time ranges were compared by Fourier transform (FT), as shown in Figure 4. The FT was performed after removing the slowly varying exponential decay contributions, and the initial 40-fs time range near the zero-time delays was omitted to avoid the effect of the initial mixed contributions from the PPC term. The positive time FT plots in Figure 4a2, calculated from 40 to 200 fs and from 40 to 3000 fs, identify two well-known dominant vibrational modes,16,22the radial breathing mode (RBM) with frequency of∼320 cm−1(period of∼104 fs) and the G mode of∼1587 cm−1(∼21 fs), generated by the impulsive excitation with sub-5-fs laser pulses. Other vibrational modes are too weak
to be resolved. In contrast, for the FT calculated for negative time traces in both Figures 4 a1 and b1, obvious RBM signals appear in both the positive and negative time ranges, whereas the G-mode vibration at∼1587 cm−1in Figures 4a1 and b1 is too weak to be resolved well in the negative time range. There are bumps around 1300 and 1000 cm−1, respectively in parts a1 and b1, but they are probably the noise being covered by the broadened FT regions due to short time range of the PFD signal limited by the short electronic dephasing time. The high-frequency vibration of the G mode with a period of ∼21 fs should be able to be fully resolved in the negative time range, which is long enough for the lattice to vibrate nearly 10 times. Therefore, the most significant distinction in the FT power spectrum between the positive and negative time ranges is the intensity ratio between G mode and RBM mode. The high-frequency G-mode vibration is much weaker in the negative time due to exciton state than the positive time range due to the ground state, and the former is too weak to appear clearly in the FT power spectrum for negative delays.
To further substantiate the vibrational signals described above, the 2D FT power spectra calculated in the negative time Figure 4.(a1) FT amplitude spectra calculated for the real-time traces probed at 2.21 eV from−40 fs to −200 fs. (a2) FT amplitude spectra calculated for the real-time traces probed at 2.21 eV from 40 to 200 fs and from 40 to 3000 fs. (b1) FT amplitude spectra calculated for the real-time traces probed at 1.90 eV from−40 to −200 fs. (b2) FT amplitude spectra calculated for the real-time traces probed at 1.90 eV from 40 to 200 fs and from 40 to 3000 fs.
range,−40 to −200 fs, are shown in Figure 5a. For comparison, a part of the 2D FT power spectra of positive time range traces in the 40−3000-fs region is displayed in Figure 5b. The vibrational frequencies of below 1000 cm−1shown in Figures 5a and b are due to the low-frequency RBM vibrations. They are observed in the spectral ranges corresponding to the absorption
spectra of chiral system shown in Figure 1. The most significant distinction in the spectra between the positive and negative time ranges is the intensity ratio between G mode and RBM mode. The high-frequency G-mode vibration is too weak to be resolved for negative delays, as already shown in Figure 4, even though it is very intense in the positive time range and its Figure 5.(a) 2D FT power spectra of negative time traces from−40 to −500 fs in spectral range of 1.7−2.4 eV. (b) Part of 2D FT power spectra of positive time traces as a comparison from 40 to 3000 fs in range of 1.7−1.99 eV. (c) and (d) are the zoom-ins of A and B parts in (a). (e) Comparison of probe photon energy dependence of amplitude profiles (AP, red line) and the derivative (DER, black lines) profiles of (6,5) and (7,5) chiralities, respectively. The amplitude profiles were calculated by taking the square root of the FT powers.
vibrational period (∼21 fs) is short enough to vibrate many more times than RBMs (∼100 fs). As the negative time measurement is a powerful method for studying excited-state dynamics without the effect of wave packet motion in ground states, the observations above indicate that the RBM is intense in the exciton state while G mode is very weak.
To see better the RBM signal, the magnified images of spectral ranges A and B are shown in Figures 5c and d, respectively. In good contrast with previous positive time studies, the dependence on the probing photon energy is still clearly displayed for the RBMs. The modes show a clear dip around 2.16 eV (572 nm) for range A and 1.92 eV (650 nm) for range B, which correspond to the energies of the second excitonic transitions in the (6,5) and (7,5) tubes, respectively, and two further lobes at higher and lower energies, implying that the vibration becomes minimal at the resonance transition peak. Analogous to those in the positive time range, the vibrational properties were interpreted using modulation spectroscopy.17,22,45 In our previous paper, we discussed the probe−photon energy-dependent amplitude profiles in terms of the energy exchange between coherent lattice vibration and the probe opticalfield and phase modulation induced by molecular phase modulation.27,54
The mechanisms of the appearance of dips in Figures 5e and f are described in our previous paper. The essential points of the probe wavelength dependence are summarized as follows.
The molecular vibration changes electronic distribution, which causes susceptibility change described by nonlinear susceptibility (NS). The real part of NS induces the refractive index change, which changes the probe spectrum by molecular phase modulation. Because of this the amplitude dependence of the vibration due to this mechanism depends on the first derivative of the absorbed photon energy spectrum as seen in Figure 5c. The imaginary part of NS provides energy loss and gain of probe light through the stimulated Raman processes. It gives bumps of both sides of the most intensely interacting probe wavelength in the Stokes and anti-Stokes sides, which can be seen in Figure 5f. The wavelength dependence are discussed in our previous paper for positive delay time, where the S/N is higher.45 Figures 5e and f show the amplitude profiles and the first derivative of the relevant Gaussian components resulting from spectral deconvolution of the stationary absorption spectrum for different chiralities. To obtain the amplitude profiles, the transverse cutting lines through the 2D plot of the FT power spectra from 100 to 350 cm−1 were first averaged, and then the square root of the resulting profile was taken. To discuss in the same way as mentioned in our previous paper,54 we compared the profile with thefirst derivative (DER) of the absorbed photon energy spectra of chiral systems of (6,5) and (7,5) around 572 and 652 nm, respectively. It can be seen that the RBM amplitude profiles are close to the DER spectra. However, as in the previous paper discussing the positive time signal, there are substantial deviations in both cases. Especially the existence of sidebands in both higher and lower energy sides is clearly seen. This is due to the Raman interaction inducing energy exchange between two spectral regions through coherent vibration. It results in the appearance of the sidebands separated by the vibration frequency to both red- and blue-shifted directions forming difference (DIF)-type contribution as discussed in the previous paper.45Thefitting in the present case of the probe photon energy dependence of the vibrational amplitude with the sum of the DIF and DER is difficult because of low S/N
due to short time integration of Fourier in the negative time range. Therefore, it was not made to show thefitting using the sum of them.
So far, the low-frequency vibrational modes at ∼320 cm−1 have been assigned to RBMs. Usually, exact chirality assign-ment can be further achieved for RBMs by combining the resonance conditions described above with the mode frequencies of the vibrations in the 2D coherent phonon spectra.17,19,45However, compared to the electronic population decay time T1el determined in the positive time range, the
negative time data provide a much shorter electronic dephasing time T2el, which limits the precision of the vibrational frequency
together with the vibrational dephasing time by the FT. As a result, the mode patterns are severely distorted as seen in the 2D plots shown in Figures 5c and d. The most distinct distortion is that the central frequencies of the two lobes on both sides of the resonance position in the fingerprint belonging to the same vibrational mode are shifted away from their original values with respect to the frequency axis. The distortion of thefingerprint signal pattern makes it difficult to assign chirality. There are at least four overlapping absorption peaks that resonate with the laser spectrum, but resonant dips of only two appear in the 2D FT plot. The vibrational modes with resonance dips at 2.16 eV (572 nm) and 1.92 eV (650 nm) can be ascribed to the (6,5) and (7,5) tubes with vibrational frequencies close to their Raman shifts at 310 and 285 cm−1, respectively. The vibrational modes in the upper right corner of Figures 5c and d represent two small dips around 2.12 eV (584 nm) and 1.89 eV (653 nm), respectively, which are near the resonance positions of (6,4) at 590 nm and (8,3) at 670 nm. However, their average vibrational frequencies of more than 600 cm−1are much larger than their own Raman shifts at around 334 and 301 cm−1, respectively. Some other vibrational modes, such as D modes,21have also been reported below 2000 cm−1, but their vibrational amplitudes are usually much weaker than those of RBMs and their vibrational frequencies are higher than 1000 cm−1. Therefore the possibility of the D modes can be ruled out, and they may probably due to the overtones of RBMs of (6,4) and (8,3) appearing only in the exciton state as discussed made before using Figure 4.
■
CONCLUSIONSWe studied the vibrational and electronic coherence relaxation dynamics for negative time delays in CoMoCat-grown SWNTs using a 7.1-fs laser pulse. The real-time traces in negative time provide information on the electronic dephasing time and also the vibrational phase relaxation dynamics in excited electronic states. The electronic phase relaxation time was found to be in the range of 30−40 fs for this sample. The most interesting result is that the vibrations of the RBM could be detected, whereas those of the G mode are too weak to be resolved in the negative time range. This implies that the RBMs in the negative time are mostly due to wave packets generated in the exciton state. The dynamics of vibrational RBMs are studied from the negative time traces under experimental conditions that were identical to those of the vibronic dephasing process. Our findings indicate that the probe photon energy-dependent amplitude profiles of RBMs follow a first derivative behavior and difference type, analogous to the results in the positive time range.
■
ASSOCIATED CONTENT*
S Supporting InformationFigures S1 and S2 and Table S1 as discussed in the text. This material is available free of charge via the Internet at http:// pubs.acs.org.
■
AUTHOR INFORMATIONCorresponding Author
*E-mail: [email protected].
Notes
The authors declare no competingfinancial interest.
■
ACKNOWLEDGMENTSThis work was financially supported by the International Cooperative Research Project, Ultrashort Pulse Laser Project, Japan Science and Technology Agency. The authors thank Dr. Juan Du for reading the paper and helpful comments.
■
REFERENCES(1) Harris, P. Carbon Nanotubes and Related Structures: New Materials for the Twenty-First Century; Cambridge University Press: Cambridge, England, 1999.
(2) Dresselhaus, M. S.; Dresselhaus, G.; Avouris, P. Carbon Nanotubes: Synthesis, Structure, Properties and Applications; Springer: Berlin, Germany, 2001.
(3) Dresselhaus, M. Carbon Nanotubes: Synthesis, Structure, Properties, and Applications; Springer: New York, 2001.
(4) Saito, R.; Dresselhaus, G.; Dresselhaus, M. Physical Properties of Carbon Nanotubes; World Scientific: Singapore, 2003.
(5) Kobayashi, T.; Yoshizawa, M.; Stamm, U.; Taiji, M.; Hasegawa, M. Relaxation Dynamics of Photoexcitations in Polydiacetylenes and Polythiophene. J. Opt. Soc. Am. B 1990, 7, 1558−1578.
(6) Kobayashi, T. J-aggregates; World Scientific: Singapore, 1996. (7) Reich, S.; Thomsen, C.; Maultzsch, J. Carbon Nanotubes: Basic Concepts and Physical Properties; Wiley-VCH: Berlin, Germany, 2004. (8) Bachilo, S. M.; Strano, M. S.; Kittrell, C.; Hauge, R. H.; Smalley, R. E.; Weisman, R. B. Structure-Assigned Optical Spectra of Single-Walled Carbon Nanotubes. Science 2002, 298, 2361−2366.
(9) Fantini, C.; Jorio, A.; Souza, M.; Strano, M. S.; Dresselhaus, M. S.; Pimenta, M. A. Optical Transition Energies for Carbon Nanotubes from Resonant Raman Spectroscopy: Environment and Temperature Effects. Phys. Rev. Lett. 2004, 93, 147406.
(10) Telg, H.; Maultzsch, J.; Reich, S.; Hennrich, F.; Thomsen, C. Chirality Distribution and Transition Energies of Carbon Nanotubes. Phys. Rev. Lett. 2004, 93, 177401.
(11) Maultzsch, J.; Telg, H.; Reich, S.; Thomsen, C. Radial Breathing Mode of Single-Walled Carbon Nanotubes: Optical Transition Energies and Chiral-Index Assignment. Phys. Rev. B 2005, 72, 205438. (12) Reich, S.; Thomsen, C.; Robertson, J. Exciton Resonances Quench the Photoluminescence of Zigzag Carbon Nanotubes. Phys. Rev. Lett. 2005, 95, 077402.
(13) Spataru, C. D.; Ismail-Beigi, S.; Benedict, L. X.; Louie, S. G. Excitonic Effects and Optical Spectra of Single-Walled Carbon Nanotubes. Phys. Rev. Lett. 2004, 92, 077402.
(14) Wang, F.; Dukovic, G.; Brus, L. E.; Heinz, T. F. The Optical Resonances in Carbon Nanotubes Arise from Excitons. Science 2005, 308, 838−841.
(15) Srivastava, A.; Htoon, H.; Klimov, V. I.; Kono, J. Direct Observation of Dark Excitons in Individual Carbon Nanotubes: Inhomogeneity in the Exchange Splitting. Phys. Rev. Lett. 2008, 101, 087402.
(16) Gambetta, A.; Manzoni, C.; Menna, E.; Meneghetti, M.; Cerullo, G.; Lanzani, G.; Tretiak, S.; Piryatinski, A.; Saxena, A.; Martin, R. L.; et al. Real-Time Observation of Nonlinear Coherent Phonon Dynamics in Single-Walled Carbon Nanotubes. Nat. Phys. 2006, 2, 515−520.
(17) Lim, Y.-S.; Yee, K.-J.; Kim, J.-H.; Hároz, E. H.; Shaver, J.; Kono, J.; Doorn, S. K.; Hauge, R. H.; Smalley, R. E. Coherent Lattice Vibrations in Single-Walled Carbon Nanotubes. Nano Lett. 2006, 6, 2696−2700.
(18) Kim, J.-H.; Han, K.-J.; Kim, N.-J.; Yee, K.-J.; Lim, Y.-S.; Sanders, G. D.; Stanton, C. J.; Booshehri, L. G.; Hároz, E. H.; Kono, J. Chirality-Selective Excitation of Coherent Phonons in Carbon Nanotubes by Femtosecond Optical Pulses. Phys. Rev. Lett. 2009, 102, 037402.
(19) Sanders, G. D.; Stanton, C. J.; Kim, J.-H.; Yee, K.-J.; Lim, Y.-S.; Hároz, E. H.; Booshehri, L. G.; Kono, J.; Saito, R. Resonant Coherent Phonon Spectroscopy of Single-Walled Carbon Nanotubes. Phys. Rev. B 2009, 79, 205434.
(20) Lim, Y.-S.; Ahn, J.-G.; Kim, J.-H.; Yee, K.-J.; Joo, T.; Baik, S.-H.; Hároz, E. H.; Booshehri, L. G.; Kono, J. Resonant Coherent Phonon Generation in Single-Walled Carbon Nanotubes through Near-Band-Edge Excitation. ACS Nano 2010, 4, 3222−3226.
(21) Kato, K.; Ishioka, K.; Kitajima, M.; Tang, J.; Saito, R.; Petek, H. Coherent Phonon Anisotropy in Aligned Single-Walled Carbon Nanotubes. Nano Lett. 2008, 8, 3102−3108.
(22) Lüer, L.; Gadermaier, C.; Crochet, J.; Hertel, T.; Brida, D.; Lanzani, G. Coherent Phonon Dynamics in Semiconducting Carbon Nanotubes: A Quantitative Study of Electron−Phonon Coupling. Phys. Rev. Lett. 2009, 102, 127401.
(23) Makino, K.; Hirano, A.; Shiraki, K.; Maeda, Y.; Hase, M. Ultrafast Vibrational Motion of Carbon Nanotubes in Different pH Environments. Phys. Rev. B 2009, 80, 245428.
(24) Wang, J.; Graham, M. W.; Ma, Y.; Fleming, G. R.; Kaindl, R. A. Ultrafast Spectroscopy of Midinfrared Internal Exciton Transitions in Separated Single-Walled Carbon Nanotubes. Phys. Rev. Lett. 2010, 104, 177401.
(25) Jorio, A.; Dresselhaus, G.; Dresselhaus, M. S. Carbon Nanotubes; Topics Applied Physics; Springer-Verlag: Berlin, Heidelberg, Germany, 2008; Vol. 111, p 371.
(26) Rao, A. M.; Richter, E.; Bandow, S.; Chase, B.; Eklund, P. C.; Williams, K. A.; Fang, S.; Subbaswamy, K. R.; Menon, M.; Thess, A.; et al. Diameter-Selective Raman Scattering from Vibrational Modes in Carbon Nanotubes. Science 1997, 275, 187−191.
(27) Ishii, N.; Tokunaga, E.; Adachi, S.; Kimura, T.; Matsuda, H.; Kobayashi, T. Optical Frequency- and Vibrational Time-Resolved Two-Dimensional Spectroscopy by Real-Time Impulsive Resonant Coherent Raman Scattering in Polydiacetylene. Phys. Rev. A 2004, 70, 023811.
(28) Kobayashi, T.; Du, J.; Feng, W.; Yoshino, K. Excited-State Molecular Vibration Observed for a Probe Pulse Preceding the Pump Pulse by Real-Time Optical Spectroscopy. Phys. Rev. Lett. 2008, 101, 037402.
(29) Bardeen, C. J.; Wang, Q.; Shank, C. V. Femtosecond Chirped Pulse Excitation of Vibrational Wave Packets in LD690 and Bacteriorhodopsin. J. Phys. Chem. A 1998, 102, 2759−2766.
(30) Saito, T.; Kobayashi, T. Conformational Change in Azobenzene in Photoisomerization Process Studied with Chirp-Controlled Sub-10-fs Pulses. J. Phys. Chem. A 2002, 106, 9436−9441.
(31) Pausch, R.; Heid, M.; Chen, T.; Kiefer, W.; Schwoerer, H. Selective Generation and Control of Excited Vibrational Wave Packets in the Electronic Ground State of K2. J. Chem. Phys. 1999, 110, 9560− 9567.
(32) Brito Cruz, C. H.; Gordon, J. P.; Becker, P. C.; Fork, R. L.; Shank, C. V. Dynamics of Spectral Hole Burning. IEEE J. Quantum Electron. 1988, 24, 261−269.
(33) Baumberg, J. J.; Huttner, B.; Taylor, R. A.; Ryan, J. F. Dynamic Contributions to the Optical Stark Effect in Semiconductors. Phys. Rev. B 1993, 48, 4695−4706.
(34) Fluegel, B.; Peyghambarian, N.; Olbright, G.; Lindberg, M.; Koch, S. W.; Joffre, M.; Hulin, D.; Migus, A.; Antonetti, A. Femtosecond Studies of Coherent Transients in Semiconductors. Phys. Rev. Lett. 1987, 59, 2588−2591.
(35) Lindberg, M.; Koch, S. W. Transient Oscillations and Dynamic Stark Effect in Semiconductors. Phys. Rev. B 1988, 38, 7607−7614.
(36) Ultrafast Phenomena V; Shank, C. V., Fork, R. L., Brito Cruz, C. H., Knox, W. H., Fleming, G. R., Siegman, A. E., Eds.; Springer-Verlag: Berlin, Germany, 1986; pp 179.
(37) Cheville, R. A.; Grischkowsky, D. Far-Infrared Terahertz Time-Domain Spectroscopy of Flames. Opt. Lett. 1995, 20, 1646−1648.
(38) Bigot, J.-Y.; Portella, M. T.; Schoenlein, R. W.; Bardeen, C. J.; Migus, A.; Shank, C. V. Non-Markovian Dephasing of Molecules in Solution Measured with Three-Pulse Femtosecond Photon Echoes. Phys. Rev. Lett. 1991, 66, 1138−1141.
(39) Grossman, C. H.; Schwendiman, J. J. Ultrashort Dephasing-Time Measurements in Nile Blue Polymer Films. Opt. Lett. 1998, 23, 624−626.
(40) Wang, Y.; Kobayashi, T. Electronic and Vibrational Coherence Dynamics in a Cyanine Dye Studied Using a Few-Cycle Pulsed Laser. Chem. Phys. Chem. 2010, 11, 889−896.
(41) Hattori, T.; Kobayashi, T. Femtosecond Dephasing in a Polydiacetylene Film Measured by Degenerate Four-Wave Mixing with an Incoherent Nanosecond Laser. Chem. Phys. Lett. 1987, 133, 230−234.
(42) Walmsley, I. A.; Tang, C. L. The Determination of Electronic Dephasing Rates in Time-Resolved Quantum-Beat Spectroscopy. J. Chem. Phys. 1990, 92, 1568−1574.
(43) Khalil, M.; Demirdöven, N.; Tokmakoff, A. Coherent 2D IR Spectroscopy: Molecular Structure and Dynamics in Solution. J. Phys. Chem. A 2003, 107, 5258−5279.
(44) Fulmer, E. C.; Mukherjee, P.; Krummel1, A. T.; Zanni1, M. T. A Pulse Sequence for Directly Measuring the Anharmonicities of Coupled Vibrations: Two-Quantum Two-Dimensional Infrared Spec-troscopy. J. Chem. Phys. 2004, 107, 8067.
(45) Kobayashi, T.; Nie, Z.; Du, J.; Okamura, K.; Kataura, H.; Sakakibara, Y.; Miyata, Y. Electronic Relaxation and Coherent Phonon Dynamics in Semiconducting Single-Walled Carbon Nanotubes with Several Chiralities. Phys. Rev. B 2013, 88, 035424.
(46) Shirakawa, A.; Sakane, I.; Takasaka, M.; Kobayashi, T. Sub-5-fs Visible Pulse Generation by Pulse-Front-Matched Noncollinear Optical Parametric Amplification. Appl. Phys. Lett. 1999, 74, 2268− 2270.
(47) Baltuška, A.; Fuji, T.; Kobayashi, T. Visible Pulse Compression to 4 fs by Optical Parametric Amplification and Programmable Dispersion Control. Opt. Lett. 2002, 27, 306−308.
(48) Arnold, M. S.; Stupp, S. I.; Hersam, M. C. Enrichment of Single-Walled Carbon Nanotubes by Diameter in Density Gradients. Nano Lett. 2005, 5, 713−718.
(49) Bachilo, S. M.; Balzano, L.; Herrera, J. E.; Pompeo, F.; Resasco, D. E.; Weisman, R. B. Narrow (n,m)-Distribution of Single-Walled Carbon Nanotubes Grown Using a Solid Supported Catalyst. J. Am. Chem. Soc. 2003, 125, 11186−11187.
(50) Miyata, Y.; Yanagi, K.; Maniwa, Y.; Tanaka, T.; Kataura, H. Diameter Analysis of Rebundled Single-Wall Carbon Nanotubes Using X-ray Diffraction: Verification of Chirality Assignment Based on Optical Spectra. J. Phys. Chem. C 2008, 112, 15997−16001.
(51) Sinnott, S. B.; Andreys, R. Carbon Nanotubes: Synthesis, Properties, and Applications. Crit. Rev. Solid State Mater. Sci. 2001, 26, 145−249.
(52) Kataura, H.; Kumazawa, Y.; Maniwa, Y.; Umezu, I.; Suzuki, S.; Ohtsuka, Y.; Achiba, Y. Optical Properties of Single-Wall Carbon Nanotubes. Synth. Met. 1999, 103, 2555−2558.
(53) Joffre, M.; la Guillaume, C. B. à; Peyghambarian, N.; Lindberg, M.; Hulin, D.; Migus, A.; Koch, S. W.; Antonetti, A. Coherent Effects in Pump−Probe Spectroscopy of Excitons. Opt. Lett. 1988, 13, 276− 278.
(54) Kobayashi, T. Zhuan Wang Spectral Oscillation in Optical Frequency-Resolved Quantum-Beat Spectroscopy with a Few-Cycle Pulse Laser. IEEE J. Quantum Electron. 2008, 44, 1232−1241.