Extensive Monitoring System of Sediment
Transport for Reservoir Sediment Management
Chih-Ping Lin, I-Ling Wu, Chih-Chung Chung, Yin Jeh Ngui and Chih-Hsiang Yeh
Abstract
This study modified the TDR technique for better field practicality and demonstrated its application as a full SSC monitoring program for reservoir management through a case study in Shihmen reservoir, Taiwan. To capture the characteristics of density currents formed during flooding events, multi-depth monitoring stations were designed and deployed on multiple floating platforms in the reservoir. This study presented the historical SSC monitoring data during the 2013 Typhoon Soulik, demonstrating the measurement effectiveness and beneficial impact of this TDR-based monitoring program in major flooding events.
Keywords: reservoir sedimentation, density current, sediment monitoring, sediment transport, time domain reflectometry (TDR)
1 INTRODUCTION
Time domain reflectometry (TDR) is based on transmitting an electromagnetic pulse via a coaxial cable connected to a sensing waveguide and watching for reflections of the transmission due to changes in characteristic impedance along the sensing waveguide. Depending on the design of the waveguide and the analysis method, the reflected signal can be used to measure various engineering parameters, such as soil moisture content, electrical conductivity, displacement, and water level (Topp et al., 1980; Lin et al., 2007; O’Connor, K.M. and Dowding, C.H.,1996; Lin et al., 2007; Chung et al., 2013)..
This section demonstrates the application of the TDR SSC monitoring technique in an extensive SSC monitoring program for reservoir management through a case study in Shihmen reservoir, Taiwan. Due to geological weathering and climate change, sediment yields from soil erosion and landslides are experiencing unexpected increase in the Shihmen watershed in the last decade. The major strategy to slow down the sedimentation involves renovating an existing low-level outlet structure to increase its outlet capacity and plan new sluicing tunnels for sediment routing. Real time monitoring of sediment transport plays an important role in planning and operation of these facilities when completed. Monitoring stations were installed at the river bank of the major inflow river mouth and outflow channels with fixed protective structures to provide inflow and outflow sediment-discharge records. To capture the characteristics of turbidity currents, a multi-depth monitoring station was designed and deployed on a floating platform in the
reservoir. Some of the data collected during Typhoon events are presented as an example to demonstrate the effectiveness and benefits of the TDR-based monitoring program.
2 Planning of SSC Monitoring Program
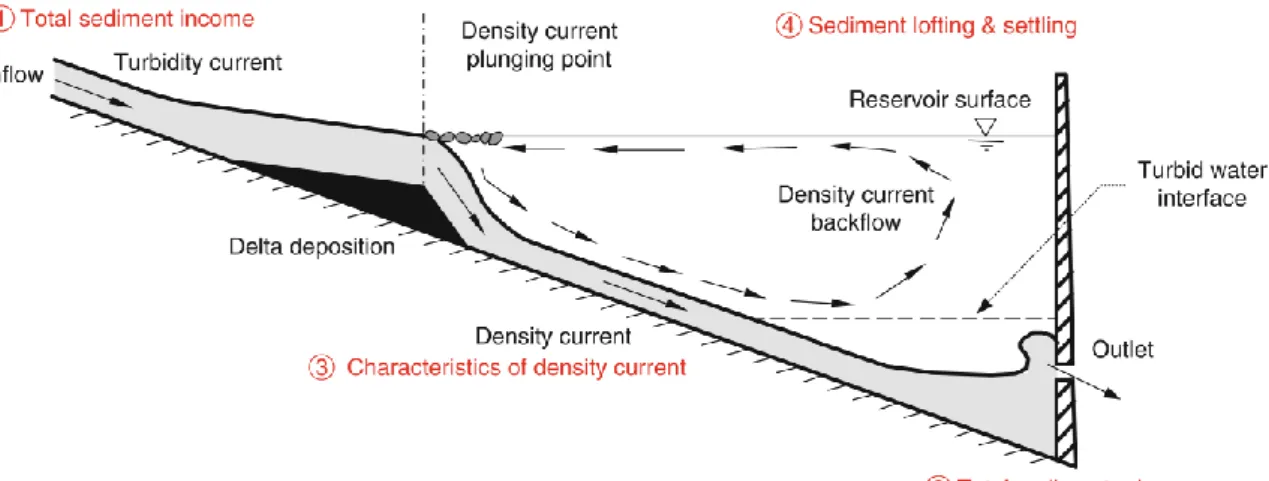
The primary questions to be answered by sediment transport monitoring scheme in a reservoir are first defined and illustrated in Figure 1. These include (a) sediment inflow into the reservoir, (b) discharge of sediments through outlets, (c) characteristics of turbidity currents (including the occurrence time, corresponding SSC, thickness, and moving speed), and (d) sediment lofting and settling of stagnant muddy water. As a result, a sediment monitoring program was initiated in 2008. The program began with manual SSC samplings at the upstream reservoir boundary of the main tributary and all outlets. The location of the upstream boundary was selected at Loufu (at Section 32 in Figure 2). The outlets monitored included spillway, tunnel spillway, power plant outlet, permanent river outlet (PRO), and Shihmen canal outlet. Measurements of SSC at Loufu and the discharge open channel of Shihmen canal outlet were first automated using the TDR technique. TDR probes were installed at desired elevations with fixed protective structure at the upstream riverbank and Shihmen canal outlet channel. Measurements of SSC at the rest of outlets were later subsequently automated by a TDR probe in a monitoring tank in which an electromagnetic valve periodically opens and takes water from the outlet by tubing.
To capture the characteristics of density currents, a multi-depth monitoring station was designed and deployed on a floating platform at Section 24 of the reservoir in 2008. Section 24 is located downstream not far from the expected plunging point of density currents. A plan view of the distribution of current monitoring stations is shown in Figure 2. More automated monitoring stations on floats were added subsequently following the success of the first float station on Section 24. These include two stations at Section 20 (close to the intake of Amuping sediment access tunnel ), a station at Section 15, two stations at Section 12 (close to the intake of Dawanping sediment sluice tunnel), a station at Section 7 (close to the intake of tunnel spillway), and a station at Section 4 (close to the dam, but now under construction in summer 2014).
Figure 1 Main questions defined for the SSC monitoring program in a reservoir
Figure 2. Plan view of the distribution of sediment monitoring stations.
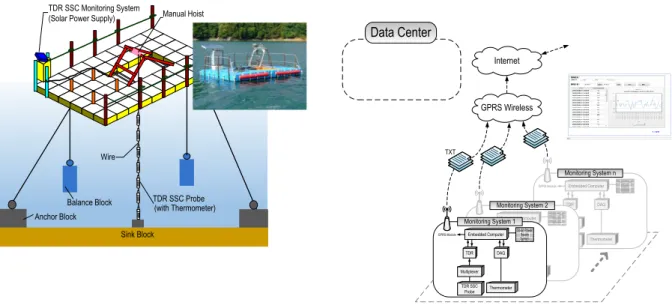
Implementation of monitoring station on a float is a challenging work. It was considered too challenging to install a winch for profiling measurements during storm events. Instead, multiple TDR probes are attached to a hanging wire and lowered down to the reservoir with the lowest probe located 1 m above the reservoir bed. Since the water level does not change significantly during wet season, such a design should serve the purpose for monitoring the density current. Figure 3 displays the layout of the TDR SSC system on a floating platform. An automated TDR measurement system with solar power supply is responsible for the TDR waveform acquisition and SSC data reduction. Multiple TDR sensing waveguides are connected to a TDR pulser through a multiplexer and automated, hence improving both temporal and spatial resolutions. One 8-channel multiplexer was installed on the platform to connect 8 SSC waveguides (or probes) and provide SSC data at different depths. More probes can be added simply by adding multiplexers. Each probe
2. Spillway 3. Tunnel spillway 4. Power plant outlet 5. PRO
6. Shihmen canal outlet Outlet monitoring stations
2,4,5 3 6 2008鳳凰颱風資料 S4 S24 S24 S20R S20L S15 S12R S12L S7 S32 1 Loufu - S32
is coupled with a thermometer to obtain water temperature for compensation of temperature effect on dielectric constant of water.
An embedded system was adopted to control TDR devices, measure temperatures and process TDR waveforms in real time to yield SSC data. This automated system reduced the amount of data for efficient wireless communication via GPRS. A data center was also implemented to facilitate management of multiple monitoring stations (Hsieh et al., 2012). A schematic diagram of the connection between the TDR monitoring system controlled by a field embedded system and data center is shown in Figure 4. In the diagram, it encompasses three major components, i.e., the front-end module (Clients), the TDR monitoring system, and the back-end services (Data Center) including database servers. The front-end module handles user interfaces via browsers. It establishes user sessions to provide services via Internet. The TDR monitoring system is shown at the bottom of the diagram. The back-end module facilitates services and databases management. The architecture supports communication and connectivity via Internet as well as General Packet Radio Service (GPRS) mechanism.
Figure 3. Schematic and photo of the TDR SSC monitoring system on a floating platform.
Figure 4. Schematic diagram of the information platform for TDR SSC monitoring program.
3 Full-Event Monitoring
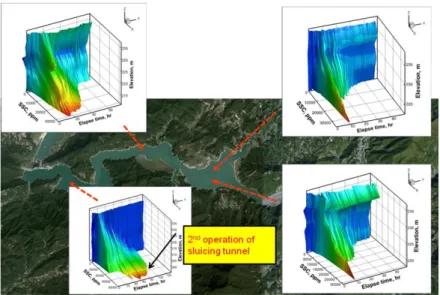
The sediment monitoring program in Shihmen reservoir was initiated in 2008. Since then, full runoff measurements were conducted for every typhoons event. SSC profile monitoring in the reservoir began with a single float station on Section 24. It was expanded subsequently and now has seven float stations in the deep water. A clearer and more refined picture of the density current movement can be captured by the extensive monitoring program. Figure 5 shows the SSC profile with time at several float stations in
Sink Block Wire TDR SSC Probe (with Thermometer) Balance Block Anchor Block Manual Hoist TDR SSC Monitoring System
(Solar Power Supply)
Monitoring System n Embedded Computer TDR DAQ Multipelxer TDR SSC Probe Thermometer Solar Power Supply System GPRS Module Monitoring System 2 Embedded Computer TDR DAQ Multipelxer TDR SSC Probe Thermometer Solar Power Supply System GPRS Module Monitoring System 1 Embedded Computer TDR DAQ Multiplexer TDR SSC Probe Thermometer Solar Power Supply System GPRS Module GPRS Wireless TXT Internet Data Center Clients
Web Server Firewall
TXT TXT
a recent event during Typhoon Sulik, 2013. Section 20 near the planned intake of Amuping sediment access tunnel is wide and instrumented with two float stations. Both stations, located not far from the expected plunging point, clearly show density current taking shape. Some subtle differences can be observed since the left station is located in the deep channel and the right station is toward the right bank closer to the intake location and the junction of a small creek. Before the density took place, the increase in SSC at shallow depth is more pronounced at the station near the deep channel due to dispersion of incoming turbid water. When the density current occurred, the main density current spread almost the entire cross section and is picked up simultaneously by both monitoring stations with a peak SSC about 30 g/L. It is worth noting that the peak rainfall intensity of the Shihmen watershed broke the record during Typhoon Sulik. The peak hourly precipitation was more than twice the precious record high. Fortunately it did not last long and the density current dissipated after about 10 hrs. The density current migrated downstream and was observed subsequently by the float stations downstream. The high SSC profile dissipated more slowly in the middle (Section 15) and lower region than the upper region at Section 20. In the lower region, the deep turbid water brought in by density current was accumulated and settled. During settling, a distinct interface was observed between the mass of settling solids in the sludge zone and the clear supernatant above formed from the water of separation. The zone settling of the stagnant muddy lake took place quite slowly due to the high SSC. The monitoring program in the reservoir realized by TDR technique provided detailed field observation of density current that was unprecedented. The spatial distribution of SSC observed by the monitoring program provides valuable information for sluicing operation.
Figure 5. SSC profile with time at several float stations during Typhoon Sulik, 2013.
The monitoring station at Section 32 is responsible for estimating the sediment load delivered to Shihmen reservoir for each single storm event. During Typhoon Sulik, the suspended sediment hydrographs at Section 32 and float stations’ lowest points are shown
in Figure 6. With the monitoring points in series from the upstream to downstream, it clearly depicts the migration of high concentration flow. It also shows that the peak SSC in the density current is at least 50% less than that in the shallow water region at Section 32, indicating a significant proportion of larger particles settles down along the way in the shallow water region.
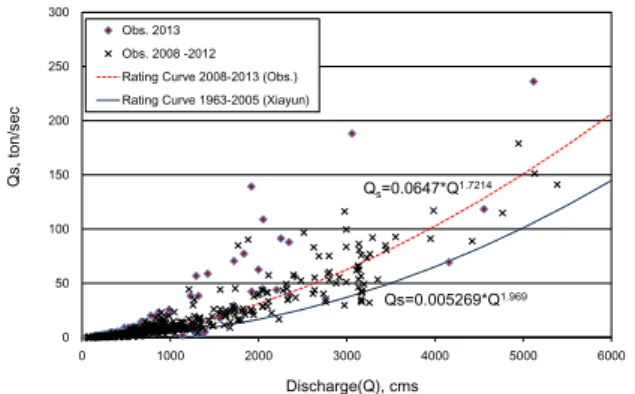
In Figure 7 using all full event data obtained in the past 5 years at Section 32 and compared to the sediment discharge rating curve previously established at a nearby gauging station using sparse data collected from 1963 to 2005 mostly under low discharge conditions. In particular, the data points collected during Typhoon Sulik is separately shown. The effect of record-breaking rain fall intensity is clearly seen when comparing the data from Typhoon Sulik with the rest of the data. A subgroup of data after the peak hourly precipitation shows apparent higher trend in the sediment load-discharge relation. The study of dynamics of sediment transport, sediment yield characteristics, and watershed management will certainly benefit from the full event monitoring program.
Figure 6. Suspended sediment hydrographs at Loufu (Section 32) and float stations’ lowest points during Typhoon Sulik.
Figure 7. Sediment load (Qs) vs. discharge (Q) data observed by the monitoring program since 2008 in comparison with the sediment-discharge rating curve from historical data at Siayun gauging station.
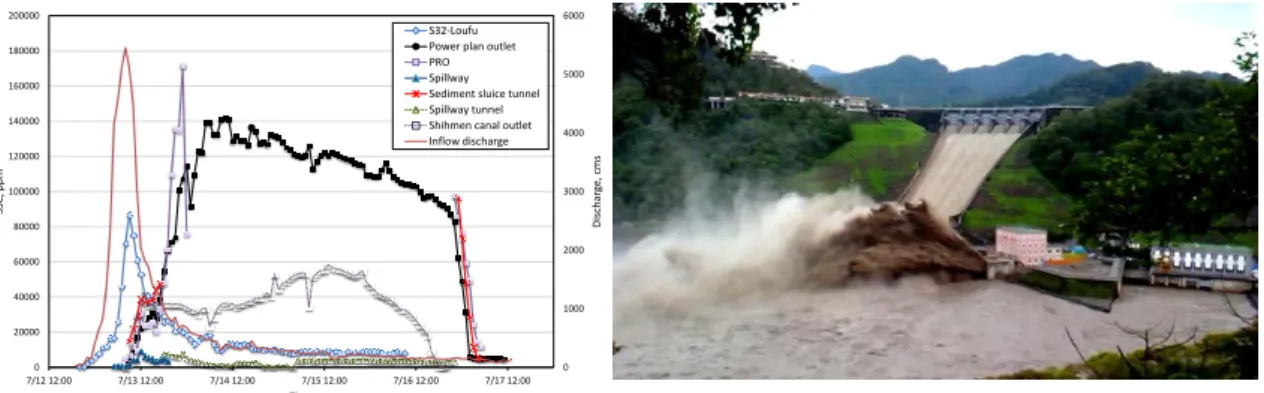
As a first measure to increase the low-level outlet capacity, the penstocks of Shihmen power plant were to be reconstructed as illustrated. The first reconstruction phase involving the Penstock #2 was completed in 2012. The maximum discharge capacity was increased from 68 cms to 300 cms. The Penstock #2 was later renamed as the sluice tunnel and officially operated for the first time during Typhoon Sulik, 2013. The operation records of all outlets in terms of sediment hydrograph were shown in Figure 8 together with the inflow sediment and discharge hydrograph. The low-level outlets, including permanent river outlet (EL. 169.5 m ), power plant (Penstock #1, EL. 173 m ), sluice tunnel (Pensotck #2, EL. 173 m), and Shihmen canal outlet ( EL. 193.5 m), for a long period of time discharged muddy water with SSC much higher than the initial SSC of the
0 10000 20000 30000 40000 50000 60000 70000 80000 90000 100000 7/12 12:00 7/13 0:00 7/13 12:00 7/14 0:00 7/14 12:00 7/15 0:00 SSC, p p m Time S32-Loufu S20R S20L S15 S7
Shihmen canal outlet
0 50 100 150 200 250 300 0 1000 2000 3000 4000 5000 6000 Qs , t on /se c Discharge(Q), cms Obs. 2013 Obs. 2008 -2012 Rating Curve 2008-2013 (Obs.) Rating Curve 1963-2005 (Xiayun)
Qs=0.005269*Q1.969
density current due to hindered settling and compression settling. The bathymetry revealed that the reservoir bed near the dam is at EL. 185 m. Dredging and a buttress wall kept the intakes of the low-level outlets from being buried by the sedimentation. Based on the monitoring results, the sluice tunnel was fully opened as the density current reached the dam. It effectively sluiced out the muddy water brought in by the density current, as vividly shown in Figure 9. After about 10 hrs of operation, the sluice tunnel was shut down because the released muddy water caused the turbidity to rise to an unacceptable level at the intake of a water treatment plant downstream. Other low-level outlets with lower discharge continued to release muddy water, which was diluted by more clear water from spillway to keep the water supply within acceptable turbidity level. After the sluice tunnel was shut down, the SSC in the rest of low-level outlets continued to rise and reached over 140 g/L in the power plant outlet and PRO. Typhoon Aere, 2004, brought in significant amount of large woody debris. Some of the driftwood sink into the reservoir and blocked the trash rack of low-level outlet intakes. Cleaning and repair work were carried out by divers but some remained buried in the mud. Since then, low-level outlets, especially the PRO, often experienced sudden increase and dropdown in SSC during sediment sluicing, as also shown in Figure 8. After Typhoon Sulik, the zone settling velocity of the stagnant muddy reservoir was so slow that the ultra high SSC in low-level outlets lasted for over 3 days. It was decided to open the sluice tunnel again during off-peak hours of water supply of the water treatment plant downstream. The SSC in all outlets drop dramatically and the water cleared out after 4 hours of sluicing operation. This can also be seen in Figure 5, in which the spatial distribution of the muddy water was revealed by the float monitoring stations. The second operation of the sluice tunnel quickly drained out the stagnant muddy water in the lower region.
Figure 8. The operation records of all outlets in terms of sediment hydrograph together with the inflow sediment (from Luofu station) and discharge hydrograph.
Figure 9. Photo showing muddy water sluiced out from the sluice tunnel as the density current reached the dam.
Since 2008, full-event monitoring was carried out for every typhoon that affected Shihmen reservoir. By the end of 2013, a total of 9 typhoon events were recorded. For
0 1000 2000 3000 4000 5000 6000 0 20000 40000 60000 80000 100000 120000 140000 160000 180000 200000 7/12 12:00 7/13 12:00 7/14 12:00 7/15 12:00 7/16 12:00 7/17 12:00 Dis ch ar ge, c m s SS C , ppm Time S32-Loufu Power plan outlet PRO Spillway Sediment sluice tunnel Spillway tunnel Shihmen canal outlet Inflow discharge
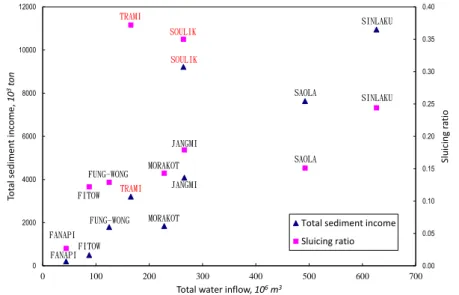
each typhoon event, the reservoir inflow, total sediment income from Shihmen watershed, reservoir outflow, and total sediment released were inventoried. It was found that the total sediment income has a good linear correlation with reservoir inflow except for the Typhoon Sulik, during which the peak rainfall intensity exceeded two times the previous record high, as shown in Figure 10. The ratio of reservoir outflow to inflow is mostly about 1.0 by the flood control operation in Shihmen reservoir during typhoons, which means Shihmen reservoir has abundant water for sluicing operation during typhoons. The sluicing ratio is defined here as the ratio of sediment released to sediment income. Before the sluice tunnel was in service, it was also found that the sluicing ratio had a linear correlation with reservoir inflow under the operation practice at that time. In 2013, the sluicing tunnel was operated during two typhoon events, Typhoon Sulik and Tami. These two data points soar above the previous trend in the relation between sluicing ratio and reservoir inflow, as revealed in Figure 10. The addition of the sluice tunnel in the reservoir operation significantly increased the efficiency of sediment sluicing. At present, the operation of the sluice tunnel is constrained by the condition that the turbidity at the water intake of the water treatment plant downstream should not exceed the purification capability. The Jhong Jhuang bank-side reservoir project is under construction, that when completed will supply clean water to the water treatment plant during typhoon and release the constraint on sluicing operation in Shihmen reservoir. It is believed that the extensive sediment monitoring program will provide needed detailed data to develop an empirical model that will optimize future sluicing operation.
Figure 10. Total sediment income and sluicing ratio in relation with total water inflow.
4 Conclusions
A new technique based on time domain reflectometry (TDR) was recently introduced. It possesses several advantages, including particle-size independence, low-cost transducers, high durability, and cost-effective multiplexing. TDR-based monitoring stations were
0.00 0.05 0.10 0.15 0.20 0.25 0.30 0.35 0.40 0 2000 4000 6000 8000 10000 12000 0 100 200 300 400 500 600 700 Slu icing r at io Tot al se di me n t in com e , 10 3ton
Total water inflow, 106m3
Total sediment income Sluicing ratio SINLAKU JANGMI MORAKOT FUNG-WONG FANAPI SAOLA SINLAKU JANGMI MORAKOT FUNG-WONG SAOLA FANAPI SOULIK SOULIK TRAMI TRAMI FITOW FITOW
installed at upstream riverbank and outflow channels with fixed protective structures, in order to provide inflow and outflow sediment-discharge records. This TDR-based monitoring program have been in operation since year 2005 and monitored over 19 major typhoon events up until year 2018.
References
Topp, G.C., Davis, J.L., and Annan, A.P. (1980). Electromagnetic determination of soil water content and electrical conductivity measurement using time domain reflectometry, Water Resour. Res., Vol. 16, p. 574–582.
Lin, C.-P., Chung, C.-C., and Tang, S.-H. (2007). Accurate TDR Measurement of Electrical Conductivity Accounting for Cable Resistance and Recording Time, Soil Sci. Soc. Am. J., Vol. 71, No. 4, p. 1278–1287.
O’Connor, K.M. and Dowding, C.H. (1999). Geomeasurements by Pulsing TDR and Probes. CRC Press, Boca Raton.
Lin, C.-P., Chung, C.-C., Tang, S.-H., and Lin, C.-H. (2007). Some innovative developments of TDR technology for geotechnical monitoring, in: 7th International Symposium on Field Measurement in Geomechanics, September 24–27, 2007, Boston, MA.
Chung, C.-C., Lin, C.P., Wu, I.-L, Chen, P.-H., and Tsay, T.-K. (2013), New TDR waveguides and data reduction method for monitoring of stream and drainage stage, J. Hydrol., Vol. 505, p. 346–351. Hsieh, S.-L., Hung, S.-H., Chung, C.-C., and Lin, C.-P. (2012). Development and implementation of geo-nerve monitoring system using time domain reflectometry, International Review on Computers and Software, Vol. 7, No. 6, p. 3238-3244.
Authors (Text style: Authors Address)
Chih-Ping Lin
(corresponding Author) (Department of Civil Engineering, National Chiao Tung University, Taiwan)
I-Ling Wu
(Disaster Prevention and Water Environment Research Center , National Chiao Tung University, Taiwan)
Chih-Chung Chung
(Department of Civil Engineering, Department of Civil Engineering, National Central University, Taiwan)
Yin Jeh Ngui
(Department of Civil Engineering, National Chiao Tung University, Taiwan) Chih-Hsiang Yeh
(Disaster Prevention and Water Environment Research Center , National Chiao Tung University, Taiwan)