Yu-Fen Huang1 Cheng-Kang Chiang1 Yang-Wei Lin1 Kungtien Liu2 Chou-Chen Hu3 Ming-Jong Bair4 Huan-Tsung Chang1, 3 1Department of Chemistry,
National Taiwan University, Taipei, Taiwan 2Radiation Application Technology Center, Institute of Nuclear Energy Research, Taoyuan, Taiwan 3Department of Natural Science Education, National Taitung University, Taitung, Taiwan
4Gastroenterology Division, Department of Internal Medicine, Mackay Memorial Hospital, Taitung Branch, Taiwan
Received July 22, 2007 Revised November 15, 2007 Accepted November 21, 2007
Research Article
Capillary electrophoretic separation of
biologically active amines and acids using
nanoparticle-coated capillaries
This manuscript describes dynamic coating of capillaries with poly(L-lysine) (PLL) and silica nanoparticles (SiO2NPs) and use of the as-prepared capillaries for the separation of
bio-genic amines and acids by CE in conjunction with LIF detection. The directions of EOF are controlled by varying the outmost layer of the capillaries with PLL and SiO2NPs,
respec-tively. Over the pH range 3.0–5.0, the (PLL–SiO2NP)n–PLL capillaries have an EOF toward
the anodic end and are more suitable for the separation of acids with respect to speed, while the (PLL–SiO2NP)ncapillaries have an EOF toward the cathodic end and are more suitable
for the separation of biogenic amines regarding speed and sensitivity. The separations of standard solutions containing five amines and two acids by CE with LIF detection using (PLL–SiO2NP)2–PLL and (PLL–SiO2NP)3 capillaries were accomplished within 10 and
7 min, providing plate numbers of 3.8 and 5.06104plates/m for 5-hydroxytryptamine (5-HT), respectively. The LODs for 5-HT and 5-hydroxyindole-3-acetic acid (5-HIAA) are 32 and 2 nM and 0.2 and 1.5 nM when using the (PLL–SiO2NP)2–PLL and (PLL–SiO2NP)3
capillaries, respectively. Identification and quantification of 5-HIAA, homovanillic acid, and
DL-vanillomandelic acid in urine samples from a male before and after drinking green tea
were tested to validate practicality of the present approach. The results show that the (PLL– SiO2NP)2–PLL capillary provides greater resolving power, while the (PLL–SiO2NP)3
capil-lary provides better sensitivity, higher efficiency, and longer durability for the separation of the amines and acids.
Keywords:
Catecholamines / CE-LIF / Poly(L-lysine) / Silica nanoparticles
DOI 10.1002/elps.200700534
1
Introduction
The determination of biologically active amines, including epinephrine (E), dopamine, tryptamine (TA), 5-hydro-xytryptamine (serotonin; 5-HT), and their metabolites (acids) such as 5-hydroxyindole-3-acetic acid (5-HIAA), homo-vanillic acid (HVA), and DL-vanillomandelic acid (VMA) in biological samples like urine and cerebral spinal fluids is of great interest because they are important neurotransmitters in central and peripheral nervous systems. Improper
reg-ulation of those compounds has been found to be associated with several neurological disorders, including Parkinson’s disease, schizophrenia, anxiety disorders, and memory impairment [1–4]. Changes in the catecholamine levels, par-ticularly in central neuronal cells, are considered to be relat-ed to the side effects of many anticancer drugs [5, 6]. Because of low concentrations (mM–nM) of the analytes in compli-cated biological samples, determination of the analytes is not an easy task. Thus, there is a great demand for developing techniques that are highly sensitive and efficient for deter-mination of the analytes.
Although HPLC is still the most common method for the analysis of biogenic amines and their metabolites, CZE, MEKC, and CEC have recently become attractive [7–11]. CZE is easy but does not provide enough resolving power for the separation of the analytes. To optimize separation resolution of amines and acids by CZE, buffer pH value close to 4.0 is favorable. In addition, the analytes are more stable and also possess strong intrinsic fluorescence characteristics at low pH when excited by using a UV laser at 266 nm [7, 8]. In order to increase EOF mobility at low pH, strategies such as
Correspondence: Professor Huan-Tsung Chang, Department of
Chemistry, National Taiwan University, Taipei, Taiwan
E-mail: [email protected] Fax: 1886-2-33661171
Abbreviations: HIAA, hydroxyindole-3-acetic acid; HT,
5-hydroxytryptamine; Dopa,DL-3,4-dihydroxyphenylalanine; HVA, homovanillic acid; PLL, poly(L-lysine); SiO2NPs, silica nanoparti-cles; TA, tryptamine; Trp,L-tryptophan; VMA,DL-vanillomandelic acid
use of CTAB as well as anionic and cationic polymers to form bilayers or multilayers on the capillary wall have been sug-gested [12–16]. Alternately, the separation of biogenic amines and their metabolites by CE in conjunction with LIF detec-tion has been conducted under discontinuous condidetec-tions using a capillary treated with 0.5 M NaOH prior to each run [8].
Band broadening that leads to poor efficiency and irre-producibility is common in the separation of small solutes by CE [17–20]. Based on our own experience, we have learned that band broadening and irreproducibility is due to adsorp-tion of the biogenic amines and their metabolites (hetero-aromatic compounds) through electrostatic attraction, hydrogen bonding, and hydrophobic patches at pH around 4.0. We note that the compounds (especially acids) are rela-tively hydrophobic when compared to those at higher pH values. To minimize analyte adsorption, adding salt or organic solvent such as ACN to aqueous electrolytes or using polymer solution like poly(ethylene oxide) as the separation matrix is effective [8].
We have recently demonstrated the use of formic acid solutions (pH,4.0) containing silica nanoparticles (SiO2
NPs) for the separation of biogenic amines and their meta-bolites by CE with LIF detection [7]. As a result of adsorption of SiO2NPs on the capillary wall, a small and constant EOF at
high electric field was generated, and analyte adsorption was minimized. In addition, the selectivity and sensitivity (e.g., 0.09 nM for TA) of the analytes both improved. When com-pared to preparation of capillaries covalently bonded with NPs such as polystyrene particles and SiO2NPs [21–23], our
method is simpler. However, dynamic coating of SiO2NPs
after each run is required to ensure good reproducibility and efficiency. Different NPs have also been used in CE for improved separation. Gold NPs which are easily prepared were separately added to aqueous electrolytes and poly (ethylene oxide) solutions to optimize resolution for small solutes, as well as DNA and proteins [24–31]. Continuous filling and partial filling of polymeric NPs that serve as pseudostationary phases are both useful for the separations of three amines by CEC, without conducting time-consum-ing particle packtime-consum-ing and ustime-consum-ing retaintime-consum-ing frits [32].
Although SiO2NP-t treated capillaries provide improved
efficiency for amines, they are unsuitable for simultaneous separation of biogenic amines and their metabolites as a result of small EOF at low pH [7]. In order to generate EOF with desired directions and magnitudes, we treated capillaries with a positively charged polyelectrolyte – poly(L-lysine) (PLL) – and SiO2NPs by a layer-by-layer assembly technique. By
control-ling the outmost coating layer of the capillary wall with cationic PLL or anionic SiO2NPs, we were able to select the direction of
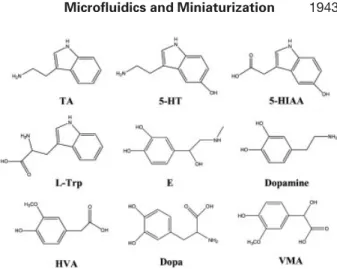
EOF for the separations of biogenic amines and their metabo-lites that are displayed in Fig. 1. Owing to a moderate magni-tude and constant EOF flow generated at low pH (,4.0) and minimum analyte adsorption, the separation of the analytes in standard solutions and urine samples by CE with LIF detection using a UV laser is fast, sensitive, and reproducible.
Figure 1. Chemical structures of the analytes.
2
Materials and methods
2.1 Apparatus
The basic design of the CE with LIF detection system has been previously described [33]. Briefly, a high-voltage power supply (Gamma High Voltage Research, Ormond Beach, FL, USA) was used to drive electrophoresis. For safety, the high-voltage end of the separation system was housed in a plexi-glass box. The entire CE with LIF detection system was enclosed in a black box with a high-voltage interlock. After passing a UG1 filter (Barrington, Edmund, NJ, USA) to minimize the plasma interference, the light from a diode pumped solid-state nanolaser (JDS Uniphase, Manteca, CA, USA) at 266 nm with a 5 mW output was focused with a UV lens. The emitted light from the analytes that were excited by the focused light was collected with a 106objective (numer-ical aperture = 0.25) before reaching the photomultiplier tube (R928 from Hamamatsu, Shizuoka-Ken, Japan). The amplified currents were transferred directly through a 10 kO resistor to a 24-bit A/D interface at 5 Hz (Borwin, JMBS Developments, Le Fontanil, France), and the data were stored in a personal computer. Fused-silica capillaries (Polymicro Technologies, Phoenix, AZ, USA) with 75 mm id and 365 mm od were used.
2.2 Chemicals
PLL andL-tryptophan (Trp; pKavalues = 2.46 and 9.41) were
both from Sigma (St. Louis, MO, USA). Colloidal solution of 13-nm SiO2NPs (20.4 wt.% solid, pH 3.4) was a gift from
Taiwan Nissan Chemical Industries (Taipei, Taiwan). The concentration of SiO2NPs is about 1.1461017particles/mL
and is denoted to be 16in this study. Formic acid, TA (pKa= 10.2), 5-HT (pKavalues = 9.8 and 11.1), epinephrine
(pKavalues = 8.66 and 9.95),DL-3,4-dihydroxyphenylalanine
(Dopa; pKavalues = 2.32, 8.72, 9.96, and 11.79), 5-HIAA (pKa
values = 4.41 and 10.52), VMA (pKavalues = 3.42), and ACN
were obtained from Aldrich (Milwaukee, WI, USA). The pH values of 10 mM formic acid solutions were 3.0 (without adding NaOH), 3.7 and 5.0 (the last two were adjusted with 0.5 M NaOH). 1,3-Dihydroxynaphthalene was purchased from Jassen Chemical (Beerse, Belgium). Green tea (soft drink) was a commercial product of Uni-President (Taoyuan, Taiwan).
2.3 Preparation of multilayer capillaries using PLL and SiO2NPs
Fused-silica capillaries were conditioned with water and then equilibrated with 2% PLL prepared in 10 mM formic acid (pH 3.7) for 12 h at room temperature. Using this condition, a long coating process is required to ensure stable dynamic coating of the PLL on the capillary wall. We note that the coating process can be shortened to less than 2 h if higher concentrations of PLL solutions (e.g., 10%) are used. After PLL was flushed out, the capillaries were further equilibrated with 10 mM formic acid (pH 3.7) containing 0.36SiO2NPs
for another 2 h. The procedures were repeated to the desired number of layers besides the times that were kept for 30 min for PLL coating and 2 h for SiO2NP coating in each cycle. In
this study, we denote the capillaries having PLL in the out-most layer to be (PLL–SiO2NP)n–PLL capillaries, where n is
an integral number between 0 and 4, and those with SiO2
NPs in the outmost layer to be (PLL–SiO2NP)n capillaries,
where n is between 1–5.
2.4 Electrophoretic separation
Prior to use, the coated capillaries were equilibrated with 10 mM formic acid solution (pH 3.0–5.0) at 15 kV for 10 min. When (PLL–SiO2NP)n capillaries were used, they
were filled with 10 mM formic acid solutions (pH 3.0–5.0) containing 0.00036SiO2 NPs. On the other hand, (PLL–
SiO2NP)n–PLL capillaries were filled with 10 mM formic acid
solutions (pH 3.0–5.0) containing 0.002% PLL and ACN (0– 5%). The CE system was operated at ambient temperature and pressure. The standard samples prepared in deionized water were injected into the capillaries at 1.0 and 21.0 kV for 10 s when using (PLL–SiO2NP)n and (PLL–SiO2NP)n-PLL
capillaries, respectively. When using (PLL–SiO2NP)n and
(PLL–SiO2NP)n–PLL capillaries, the electrophoretic
separa-tions were conducted at 375 and 2375 V/m (15 or 215 kV for 40-cm capillaries), respectively. The EOF mobility values under different conditions at 375 or 2375 V/cm were sepa-rately determined by injecting 1.0 mM 1,3-dihydroxy-naphthalene.
2.5 Urine analysis
All urine samples were collected from a healthy male adult volunteer (24 years old, 77 kg body wt., nonsmoker) in the laboratory, who avoided flavonoid-rich foods, tea or
tea-relat-ed beverages for at least 1 wk prior to the experiment. After fasting for 12 h, the volunteer drank 600-mL green tea with-out drinking other beverages besides water. Urine samples were collected prior to drinking tea, and after drinking tea for 2, 4, 6, and 8 h. Each urine sample was subjected to cen-trifugation at 18 000 rpm for 15 min, and then the super-natants were collected for CE analysis. Prior to the analyses, the samples were diluted with water by a factor of 100 or 5 v/v and kept at 47C during CE analysis. The pH values of the diluted samples are the same as those in the original sam-ples. (PLL–SiO2NP)2–PLL and (PLL–SiO2NP)3 capillaries
were used for the analyses of the urine samples. The as-pre-pared urine samples were separately injected at 1.0 or 21.0 kV for 10 s and then were separately analyzed at 15 or 215 kV using the same conditions as those for the analysis of standard solutions at pH 3.7. In order to determine the concentrations of the analytes, 5 mL of TA (0.01–5.0 mM), 5-HIAA (0.2–4.0 mM), HVA (1.0–100 mM), and VMA (1.0– 100 mM) were separately spiked into 495 mL urine samples. Linear plots of the peak heights against the concentrations of the standard analytes were depicted, and the plots were used to determine the concentrations of analytes in the urine samples.
3
Results and discussion
3.1 (PLL–SiO2NP)n–PLL and (PLL–SiO2NP)ncapillaries
For simultaneous analysis of the biogenic amines and acids at low pH, it is essential to generate EOF that is greater than the electrophoretic mobilities of the acids and/or the amines. Although a high EOF toward the anodic side can be gener-ated by using CTAB, we have found loss in resolution for the biogenic amines, poor reproducibility as a result of analyte adsorption and Joule heating, and greater fluorescence background as well as an unstable baseline when conducting CE with LIF detection using a UV laser. We thus turned our attention toward the use of NPs and PLL for generation of moderate EOF at low pH in this study. In order to generate a moderate EOF at low pH, we modified capillaries with PLL and SiO2NPs by using a layer-by-layer assembly technique.
At pH,4.0, PLL is cationic due to protonation of its amino residues, the surface of SiO2NPs is negatively charged as a
result of the dissociation of SiOH and adsorption of formate. When treating the capillaries with PLL at pH 3.7, PLL mole-cules were adsorbed on the capillary wall mainly through electrostatic interactions and hydrogen bonding. As a result, EOF toward the anodic end was generated at high electric field when using PLL capillaries. By further treating the PLL capillaries with SiO2NPs (pH 3.7), SiO2NPs were adsorbed
on the PLL layer mainly through electrostatic interactions, leading to having negative charges on the capillary wall. As a result, EOF toward cathodic end was generated when apply-ing high electric field. Thus, the direction of EOF can be simply controlled by multilayer coating of PLL and SiO2NPs
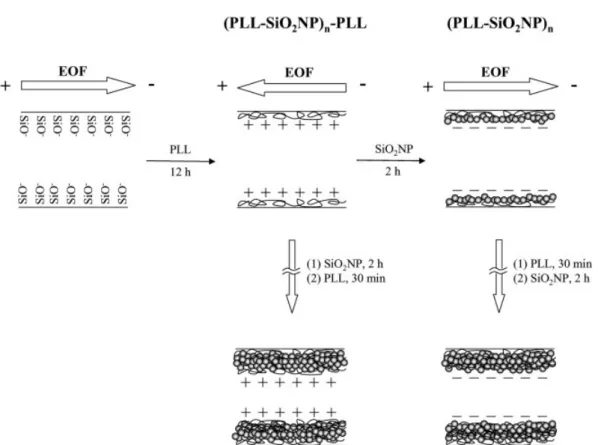
Scheme 1. Coating processes of preparing (PLL–SiO2NP)n–PLL (n = 0–4) and (PLL–SiO2NP)ncapillaries (n = 1–5).
through layer-by-layer assembly; the (PLL–SiO2NP)n–PLL
capillaries have EOF toward the anodic end, while the (PLL– SiO2NP)n capillaries have EOF toward the cathodic end.
Scheme 1 summarizes the coating processes for preparing (PLL–SiO2NP)n–PLL and (PLL–SiO2NP)ncapillaries and the
directions of the EOFs of the capillaries generated at high electric field. In the case of using (PLL–SiO2NP)n–PLL
capil-laries, the amines migrate against EOF, while the acids migrate with the same direction as that of EOF. On the other hand, when using (PLL–SiO2NP)n capillaries, the amines
migrate with the same direction as EOF while the acids migrate against EOF.
The formation of multilayer coating on the capillary was indirectly supported by the UV–Vis extinction spectra of the (PLL–SiO2NP)n glass slides (n = 0–5) as depicted in Fig. 2.
Owing to a difficulty of monitoring the coating on the capil-lary surface using a commercial spectrometer; glass slides were used. The representative UV–Vis extinction over the wavelength range 400–900 nm increases with increasing number of coating layers, indicating the formation of multi-layer coating. The increase in extinction is mainly due to diffuse scattering from the increased amounts of SiO2NPs
[34] and changes in refractive index of the surface. We note that the increases in extinction are not proportional to the number of layers after n.3, mainly due to instability or nonuniform of the coating after the third layer. We also observed greater variation (.30% based on the extinction at
Figure 2. UV–Vis extinction spectra of the (PLL–SiO2NP)nglass
slides (n = 0–5). Extinction spectra were plotted with an arbitrary unit (a.u.).
450 nm) of the extinction spectra of five different (PLL– SiO2NP)nglass slides when n.3.
In order to determine the EOF mobilities when using (PLL–SiO2NP)n–PLL capillaries (n = 0–4) and (PLL–
Table 1. Comparison of EOF mobility and its reproducibility of
the (PLL–SiO2NP)n–PLL and (PLL–SiO2NP)ncapillaries
(PLL–SiO2NP)n–PLL (PLL–SiO2NP)n Number of layers (n) EOFa) (RSD, %)b) Number of layers (n) EOF (RSD, %) 0 25.30 (1.57) 1 3.51 (0.49) 1 25.18 (0.92) 2 3.33 (0.78) 2 25.03 (0.86) 3 2.94 (0.60) 3 24.41 (1.14) 4 2.68 (1.07) 4 24.37 (1.31) 5 2.31 (0.98)
a) (6 1024cm2V21s21), the direction of EOF from anode to
cathode is denoted to be positive. The BGEs are 10 mM formic acid solutions (pH 3.7) containing 0.002% PLL and 0.00036SiO2 NPs for the (PLL–SiO2NP)n–PLL and (PLL–
SiO2NP)ncapillaries, respectively. 1,3-Dihydroxynaphthalene
(1.0 mM) is the neutral marker. Other conditions are the same as those in Fig. 3A or 4.
b) n = 3.
used as a neutral marker. For simplicity, the EOF values are denoted to be positive and negative when the EOF toward the cathodic and anodic ends, respectively. Their EOF directions and mobility values at pH 3.7 listed in Table 1 clearly show the success in controlling EOF directions by multilayer coat-ings of the capillaries with PLL and SiO2NPs. When
com-paring the EOF values in the (PLL–SiO2NP)ncapillaries, we
found that the EOF mobility decreased from 3.5161024to
2.3161024cm2V21s21upon increasing the number of lay-ers from 1 to 5. The results suggest that the zeta potentials decreased with increasing the coating cycles. A similar decreased trend of the EOF mobility also occurred when using (PLL–SiO2NP)n–PLL capillaries. This is mainly due to
weaker electrostatic interactions of PLL with the capillary wall than with SiO2NPs. PLL molecules that are directly
attached to capillary wall surface tend to toward bulk solu-tion, while they were in flat structures to a greater extent in the (PLL–SiO2NP)n–PLL (n = 1–4). It has been suggested that
molecules have weaker interactions with the bulk materials than with their corresponding spherical NPs [35, 36]. As a result, the positively charged densities were higher in the PLL capillaries than those in the (PLL–SiO2NP)n–PLL
capil-laries (n = 1–4). Upon increasing the coating cycles, the lay-ers became more compact and the charged densities decreased, leading to having a smaller EOF. Because PLL molecules have greater charged densities (positive) than does SiO2 NPs (negative) at pH 3.7, the (PLL–SiO2NP)n–PLL
capillaries provide greater EOF mobilities (absolute values) than do the (PLL–SiO2NP)ncapillaries. It is also important to
point out that the in-capillary and capillary-to-capillary RSD values of EOF were less than 1.6 and 5.6% for the (PLL– SiO2NP)n–PLL capillaries, respectively, while those were less
than 1.1 and 4.6% for the (PLL–SiO2NP)ncapillaries,
respec-tively. The (PLL–SiO2NP)3capillaries were stable at pH 3.7
for more than 100 runs, while (PLL–SiO2NP)2–PLL
capil-laries are relatively less stable (,100 runs). The durability of (PLL–SiO2NP)2–PLL capillaries can be improved when the
capillaries were treated with PLL for 5-min after each run. Our CE separation results also show relatively poor in-col-umn and colin-col-umn-to-colin-col-umn reproducibility when using the (PLL–SiO2NP)nand (PLL–SiO2NP)n–PLL capillaries at n.3,
which agree with our UV–Vis extinction data. The greater variations are mainly due to aggregation of SiO2NPs.
When using a bare column, the EOF value
(3.961025cm2V21s21) is very low and analyte adsorption is
serious in 10 mM formic acid solution (pH 3.7). The migra-tion time for epinephrine was 4.76 min and the peaks corre-sponding to Trp and 5-HIAA were not detected within 30 min. In addition to a long separation time, the RSD for the migration time of 5-HIAA was greater than 4.5% and its sensitivity was also lower (about eight-fold) than that using a (PLL–SiO2NP)3capillary.
3.2 pH effects
Although we have demonstrated that the separation of bio-genic amines and their metabolites by CE with LIF detection is proper at pH around 4.0 when using bare fused capillaries, we realized that the optimum condition might be different when using the (PLL–SiO2NP)n–PLL and (PLL–SiO2NP)n
capillaries because pH may have different impacts on the EOF and the electrophoretic mobilities of the analytes through their interactions with the capillary wall. Over the pH range of 2.0–5.0, we expected that upon decreasing pH the EOF mo-bilities for the (PLL–SiO2NP)n–PLL capillaries increase, while
those for the (PLL–SiO2NP)n capillaries slightly decrease.
Upon decreasing pH, the electrophoretic mobilities of cati-onic biogenic amines toward the cathodic end increase, while those of the acids toward the anodic end decrease. By con-ducting the separations using 10 mM formic acids (pH 2.0– 5.0) as an electrolyte, we found the optimum separation pH value to be around 3.7 when using the (PLL–SiO2NP)n–PLL
capillaries. However, the peaks corresponding to Trp and Dopa were only partially resolved at pH 3.7. The separations of the analytes were failed when using the capillaries (PLL– SiO2NP)n; Trp and Dopa were not resolved. In addition, the
peaks corresponding to 5-HIAA and HVA were not detected in 10 min at pH 5.0, mainly because the two analytes migra-ted against small EOF. In terms of resolution, the (PLL– SiO2NP)2–PLL capillaries are more suitable. Table 2
sum-marizes the pH effects on the EOF mobility values as well as the migration times, efficiencies, and relative peak intensities of 5-HT and 5-HIAA when separately using the (PLL– SiO2NP)2–PLL and (PLL–SiO2NP)3capillaries. As expected,
the EOF decreased with increasing pH when using the (PLL– SiO2NP)2–PLL capillaries. In contrast to our expectation, the
EOF slightly decreased with increasing pH when using the (PLL–SiO2NP)3 capillary. This is because ionic strength
(NaOH was used to adjust the solution from pH 3.0 to 5.0) plays a greater role than that of the dissociation of SiOH in affecting the zeta potential. Because salt also plays a
signifi-Table 2. EOF and the migration times (t; min), efficiencies (N;6 104), and peak heights (h) for 5-HT and 5-HIAA at different pH values (PLL–SiO2NP)2–PLL (PLL–SiO2NP)3 pH 3.0 pH 3.7 pH 5.0 pH 3.0 pH 3.7 pH 5.0 EOFa) 26.10 25.03 24.32 3.31 2.94 2.71 Analytes t N hb) t N h t N h t N h t N h t N h 5-HT 5.08 5.5 1.6 7.89 3.8 1.1 10.2 5.1 1.0 2.08 2.6 2.1 2.22 5.0 3.0 2.32 4.0 5.4 5-HIAA 2.38 0.2 4.0 2.50 3.4 6.7 2.24 3.0 7.1 4.21 3.0 7.9 5.46 2.8 5.7 14.04 2.2 2.0 a) (6 1024cm2V21s21) and the direction of EOF from anode to cathode is denoted to be positive.
b) Peak heights are presented by an arbitrary unit. The BGEs are 10 mM formic acid solutions (pH 3.7) containing 0.002% PLL and 0.00036SiO2NPs for the (PLL–SiO2NP)n–PLL and (PLL–SiO2NP)ncapillaries, respectively. Other conditions are the same as those in
Fig. 3A or 4.
cant role in determining the structure of PLL and thus the surface charged density, the change in the surface morphol-ogy is likely another reason for decreases in EOF mobility. Although the (PLL–SiO2NP)3capillary could not provide the
separation of Trp and Dopa at pH 3.7, it provided greater intensities and efficiencies for the amines than did the (PLL– SiO2NP)2–PLL capillary. Because the migration times for the
amines are much shorter when using the (PLL–SiO2NP)3
capillary than those using the (PLL–SiO2NP)2–PLL capillary,
we suggest that diffusion is a main contributor for loss in efficiency and peak height when using the (PLL–SiO2NP)2–
PLL capillary. The widths of the peaks for 5-HT when using the (PLL–SiO2NP)2–PLL and (PLL–SiO2NP)3capillaries were
0.14 and 0.02 min, respectively.
3.3 Multilayer coating effects
By conducting multilayer coating, the direction and magni-tude of EOF could be well controlled to optimize the separa-tion resolusepara-tion and speed of amines and acids. Table 3 sum-marizes the multilayer coating effects on the migration times, efficiencies, and resolutions for the analytes when using the (PLL–SiO2NP)n–PLL and (PLL–SiO2NP)n capillaries. As the
number of layers increases, the migration times of the ana-lytes in both (PLL–SiO2NP)n–PLL and (PLL–SiO2NP)n
capil-laries increased as a result of decreases in EOF. However, the RSD values for the migration times and the separation effi-ciencies of 5-HIAA and 5-HT were better when using the (PLL–SiO2NP)2–PLL and (PLL–SiO2NP)3 capillaries. With
multilayer coating, there is less access for analyte adsorption, mainly due to smaller exposed area of the bare silica surface and long diffusion paths. As a result, the repeatability is greater at n = 3 than those at n = 1 and 2. On the other hand, at n.3, unstable coating of the capillaries is problematic.
3.4 Separation of standard biogenic amines and acids
In order to further improve the resolving power of the (PLL– SiO2NP)2–PLL capillary, we added ACN to the electrolyte.
Figure 3 shows the separations of the analytes by CE with LIF
Figure 3. Effects of ACN on the separation of seven analytes by
CE with LIF detection using a (PLL–SiO2NP)2–PLL capillary. BGEs
are 10 mM formic acid solutions (pH 3.7) containing 0.002% PLL and (A) 0%, (B) 1.5%, (C) 3.0%, (D) 5.0% ACN. Analytes: 1, HVA (1 mM); 2, 5-HIAA (50 nM); 3, Trp (50 nM); 4, epinephrine (50 mM); 5, 5-HT (0.5 mM); 6, dopamine (10 mM); 7, TA (0.5 mM). Capillary total length is 40 cm (effective length 30 cm). Electrokinetic injection was conducted at 21 kV for 10 s and the separations were carried out at 215 kV (2375 V/cm).
detection using a (PLL–SiO2NP)2–PLL capillary filled with
10 mM formic acid (pH 3.7) containing 0.002% PLL and 0– 5% ACN. The electropherograms show that at different ACN
Table 3. Comparison of migration times (t; min), efficiencies (N;6104), and resolution (R) for the analytes using the (PLL–SiO 2NP)n–PLL and (PLL–SiO2NP)ncapillaries Number of layers (n) (PLL–SiO2NP)2–PLL (PLL-SiO2NP)3 t (min) (RSD, %)a) N R Number of layers (n) t (min) (RSD, %) N R
5-HIAA 5-HT 5-HIAA 5-HT HVA/ 5-HIAA
5-HIAA/ Trp
5-HT 5-HIAA 5-HT 5-HIAA TA/5-HT 5-HT/ epinephrine 0 2.36 6.80 4.1 2.4 1.9 34.7 1 2.05 4.43 4.1 4.4 2.1 2.3 (1.86) (1.81) (1.22) (1.60) 1 2.45 7.25 3.9 2.8 2.6 34.1 2 2.11 4.71 4.0 4.3 1.8 2.3 (1.73) (1.58) (0.87) (1.13) 2 2.50 7.89 3.4 3.8 2.8 36.0 3 2.22 5.46 5.0 2.8 2.1 2.6 (0.50) (1.10) (0.72) (0.87) 3 3.23 12.5 NRb) 3.9 3.4 NR 4 2.35 6.12 4.4 2.7 1.7 2.4 (1.28) (1.35) (0.80) (1.40) 4 3.26 12.9 NR 4.2 3.4 NR 5 2.51 7.37 4.4 1.8 1.4 2.5 (1.89) (2.10) (1.14) (3.37) a) n = 3.
b) Not resolved. The BGEs are 10 mM formic acid solutions (pH 3.7) containing 0.002% PLL and 0.00036SiO2NPs for the (PLL–SiO2NP)n–
PLL and (PLL–SiO2NP)ncapillaries, respectively. 1,3-Dihydroxynaphthalene (1.0 mM) is the neutral marker. Other conditions are the same
as those in Figs. 3A or 4.
concentrations the migration times for the analytes were different and all of the separations were accomplished within 10 min. Because the EOF is toward the anodic end, anionic acids were detected earlier than the cationic amines. In the presence of different amounts of ACN, the EOF and the electrophoretic mobilities of the analytes var-ied, mainly because of different zeta potentials and slight changes in viscosity and their dissociation capabilities [8, 37, 38]. In addition, they are also due to changes in the interactions between the analytes and the capillary wall. The peak heights increased and the migration times were slightly shorter when the concentration of ACN was increased from 0 to 1.5%. In the presence of ACN at the concentrations greater than 3.0%, the resolution between 5-HT and dopamine improved but the signals for the ana-lytes were slightly lower. The standard sample was also separated by CE with LIF detection using a (PLL–SiO2NP)3
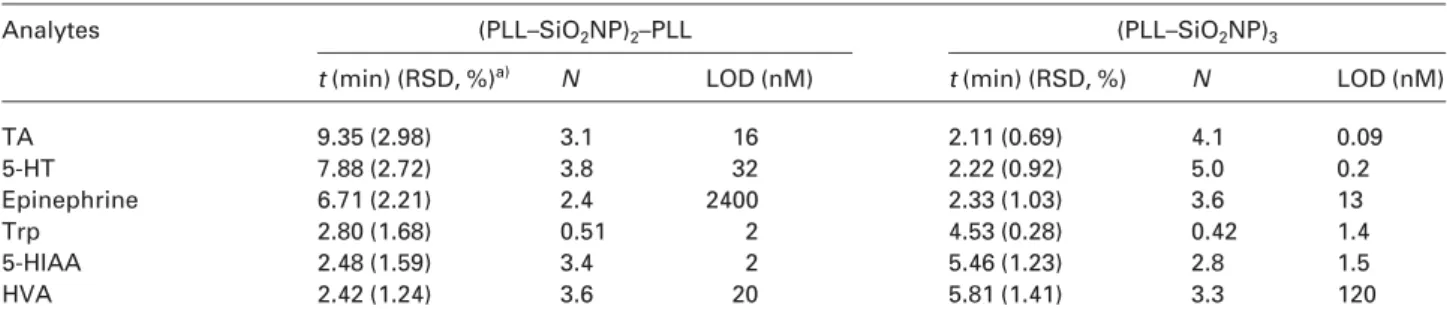
capillary. The electropherogram depicted in Fig. 4 show that the analytes besides the pair of Try and Dopa were well resolved within 7 min. Table 4 further summarizes the RSD values of the migration times, efficiencies, and LODs of the analytes. The (PLL–SiO2NP)2–PLL and (PLL–
SiO2NP)3capillaries provided the plate numbers of 3.8 and
5.06104plates/m for HT, respectively. The LODs for
5-HT and 5-HIAA were 32 and 2 nM, and were 0.2 and 1.5 nM when using the (PLL–SiO2NP)2–PLL and (PLL–
SiO2NP)3capillaries, respectively. Slightly lower sensitivity
of the two analytes when using the (PLL–SiO2NP)2–PLL
capillary is mainly related to greater diffusion and their stronger interactions with PLL. In addition, quenching of the analyte fluorescence by PLL is a contributor. Our
Figure 4. Electropherograms of the seven analytes by CE with LIF
detection using a (PLL–SiO2NP)3capillary. The separation was
conducted in 10 mM formic acid solution (pH 3.7) containing 0.00036SiO2NPs. Analytes: 1, TA (5.0 nM),; 2, 5-HT (5.0 nM); 3,
epinephrine (0.5 mM); 4, Trp (0.1 mM); 5, Dopa (1.0 mM); 6, 5-HIAA (50 nM); 7, HVA (1.0 mM). Electrokinetic injection was conducted at 1 kV for 10 s and the separation was carried out at 15 kV (375 V/ cm). Other conditions are the same as those in Fig. 3A.
reasoning is supported by the fact that the fluorescence intensities of 5-HT and epinephrine decreased about 20% in the presence of 2.0% PLL.
3.5 Urine analysis
The results demonstrated in Figs. 3C and 4 show that the separation of amines and acids by CE with LIF detection using the (PLL–SiO2NP)2–PLL and (PLL–SiO2NP)3
capil-Table 4. Comparison of migration times (t; min), efficiencies (N;6104), and LODs for the analytes using the (PLL–SiO
2NP)2–PLL and (PLL–
SiO2NP)3capillaries
Analytes (PLL–SiO2NP)2–PLL (PLL–SiO2NP)3
t (min) (RSD, %)a) N LOD (nM) t (min) (RSD, %) N LOD (nM)
TA 9.35 (2.98) 3.1 16 2.11 (0.69) 4.1 0.09 5-HT 7.88 (2.72) 3.8 32 2.22 (0.92) 5.0 0.2 Epinephrine 6.71 (2.21) 2.4 2400 2.33 (1.03) 3.6 13 Trp 2.80 (1.68) 0.51 2 4.53 (0.28) 0.42 1.4 5-HIAA 2.48 (1.59) 3.4 2 5.46 (1.23) 2.8 1.5 HVA 2.42 (1.24) 3.6 20 5.81 (1.41) 3.3 120
a) n = 3. Other conditions are the same as those in Figs. 3C or 4.
laries, respectively, offer the advantages of rapidity, efficiency, and repeatability. To test the diagnostic potential of the pro-posed method, urine samples that were collected from heal-thy people were analyzed. Two representative electro-pherograms are depicted in Figs. 5A and B. In addition to the five identified analytes (VMA, HVA, 5-HIAA, Trp, and TA), the other peaks likely correspond to fluorescent analytes such as benzoic compounds, heterocyclic compounds, pep-tides, nucleopep-tides, and/or oligonucleotides. The peaks for Trp are relatively broad when compared to others, mainly be-cause of overlaps of Trp with Dopa and possibly other ana-lytes. Because the compositions in various urine samples are different, depending on several factors such as the diet and >body conditions, we did not intend to quantitatively deter-mine the concentrations of the identified analytes in all urine samples. Qualitative results from separating ten samples suggest that the present method is reproducible; the RSD values of the migration times for the analytes are all less than 2.5% in ten different samples (each with at least three runs). In order to quantitatively determine the concentrations of the identified analytes, we spiked the standards to one of the urine sample. The results are listed in Table 5, which are comparable and are both in a good agreement with the reported data [39, 40]. The concentration of TA was not determined when using the (PLL–SiO2NP)3capillary, mainly
because of the corresponding peak was not well resolved from another peak. Our result suggests a great potential of this method for diagnosis and neuron study.
Great efforts have made to determine 5-HIAA, HVA, and VMA in urine for neurological diagnosis and for monitoring the response of therapy in illnesses such as neuroblastoma and pheochromocytoma [41]. We further used the (PLL– SiO2NP)3capillary to analyze urine sample from a male after
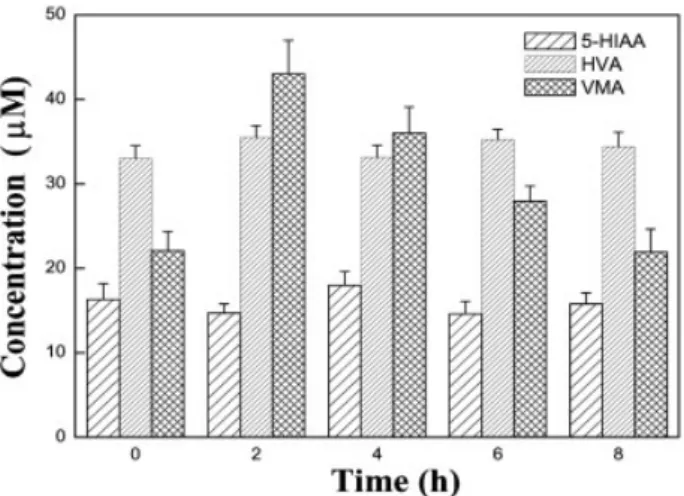
drinking tea for a period of 8 h. A representative electro-pherogram for the urine sample that was taken after drink-ing tea for 2 h is depicted in Fig. 5C. In a comparison of Figs. 5B and C, we notice that the concentration of VMA and HVA both increased, but that for 5-HIAA did not. The increased concentration in VMA (from 22.1 to 43.0 mM) is greater than that of HVA (33.0–36.4 mM). Without drinking
tea, the concentrations of VMA and HVA did not vary appar-ently (less than 5%) in a period of 6 h with a 2-h collection each. We note that HVA and VMA are the major products of the catecholamine metabolism. It has been suggested that green tea containing greater amounts of theanine, which induce release of dopamine [42]. We summarized the con-centration changes of 5-HIAA, HVA, and VMA in the urine excretion samples before and after tea ingestion in Fig. 6. The data suggest that the concentrations of the acids returned to normal after drinking tea for about 6–8 h.
4
Concluding remarks
In this report, we demonstrate use of polymers and NPs to control the direction and magnitude of EOF. By using the (PLL–SiO2NP)n, and (PLL–SiO2NP)n–PLL capillaries, the
separations of biogenic amines and acids at low pH values were demonstrated, with the advantages of rapidity, sensitiv-ity, efficiency, and reproducibility. When compared to prepa-ration of capillaries covalently coated with NPs, our approach is simpler. The results show in this study clearly indicate that the (PLL–SiO2NP)n, and (PLL–SiO2NP)n–PLL capillaries
have different performance on the separation of biogenic amines and acids with respect to sensitivity, speed, migration order, and resolution. For the separation of biogenic amines only, (PLL–SiO2NP)3capillaries are more suitable regarding
speed and sensitivity. While (PLL–SiO2NP)2–PLL capillaries
are superior over (PLL–SiO2NP)ncapillaries for the
separa-tion of acids with respect to speed. Overall, the performance of (PLL–SiO2NP)3 capillaries is better than that of (PLL–
SiO2NP)2–PLL capillaries. Our method offers several
advan-tages over HPLC methods, including efficiency, rapidity, sensitivity, and requirement of smaller amounts of sample and solution. When compared to other CE methods, our method allows simultaneous analysis of amines and acids, with high sensitivity. However, problems of having relatively poor resolution for amines and long migration times for some strong acids needed to be overcome when using the (PLL–SiO2NP)3and (PLL–SiO2NP)2–PLL capillaries,
respec-Table 5. Quantification of four analytes in a urine samplea)
Analytes (PLL–SiO2NP)2–PLL (PLL–SiO2NP)3 Normal level
Linear regressionb) Concentration (mM) Linear regressionb) Concentration (mM)
TA y = 2.249x 1 58.46 0.26 6 0.01 NDc) NDc) 6.4 mg/day R2= 0.996 (0.1–0.4 mM) (20 nM–0.5 mM) 5-HIAA y = 18.80x 1 373.55 20 6 2 y = 0.84x 1 712.74 16 6 1 2 mg/day R2= 0.9919 R2= 0.9965 (,50 mM) (20 nM–0.4 mM) (0.5–5 mM) HVA y = 1.034x 1 29.03 28 6 4 y = 0.17x 1 27.96 33 6 2.8 6 mg/day R2= 0.9987 R2= 0.9977 (,40 mM) (0.2–10 mM) (0.5–10 mM) VMA y = 0.64x 1 14.33 23.1 6 2.7 y = 4.96x 1 25.67 22.1 6 2.3 3.5 mg/day R2= 0.9948 R2= 0.9986 (,45 mM) (0.2–10 mM) (0.5–10 mM)
a) Urine samples were diluted with water 100- or 20-fold, respectively. Other conditions are the same as those in Figs. 3C or 4. b) y is peak height (mV), x is the concentration of standards added, and the linear ranges are showed in parentheses. c) Not determined.
Figure 5. Electropherograms of
a urine sample by CE with LIF detection using (A) a (PLL– SiO2NP)2–PLL as well as (B) and
(C) a (PLL–SiO2NP)3 capillary.
The separations were con-ducted in 10 mM formic acid so-lution at pH 3.7 containing (A) 3.0% ACN and 0.002% PLL, as well as (B) and (C) 0.00036SiO2
NPs. Urine samples (A) and (B) were collected prior to drinking green tea, and urine sample (C) was collected after drinking green tea for 2 h. The urine samples were diluted with water (A) 100-fold, and (B) 5-fold for the analyses, respectively. The urine sample used to obtain the electropherogram depicted in the inset of (A) was diluted ten-fold with water. Peak identities: s, system peak; 1, VMA; 2, HVA; 3, 5-HIAA; 4, Trp; 5, TA. Other conditions for (A) as well as (B) and (C) are the same as those in Figs. 3C and 4, respectively.
Figure 6. Evaluation of urinary excretion of 5-HIAA, HVA, and
VMA after drinking green tea by CE-LIF using a (PLL–SiO2NP)3
capillary. Other conditions are the same as in Fig. 5C.
tively. In order to further improve the resolving power of the (PLL–SiO2NP)n capillaries for biogenic amines and acids,
several strategies are worthy being tested. Modification of SiO2 NP with stronger acids to generate higher EOF is
required for high-speed separation of the acids. When EOF mobility is too high, adding metal ions to form complexes with the amines and acids to reduce their migration mobility may be useful for optimum resolution and speed. Finally, different buffer electrolytes shall be tested.
This work was supported by the National Science Council of Taiwan under Contract NSC 95-2113-M-002-026-MY3 and NSC 96-2627-M-002-013. We are grateful to Mr. Yi-Shou Chang of the Taiwan Nissan Chemical Industries Corp. for kindly providing us SiO2NPs.
The authors have declared no conflict of interest.
5
References
[1] Grace, A. A., Gerfen, C. R., Aston-Jones, G., Adv. Pharmacol. 1998, 42, 655–670.
[2] Laverty, R., Drugs 1978, 16, 418–440.
[3] Axerlord, J., in: Stolk, J. M., U’Prichard, D. C., Fuxe, K. (Eds.),
Epinephrine in the Central Nervous System, Oxford
Uni-versity Press, New York 1988, pp. 3–7.
[4] Matthews, C. K., van Holde, K. E., Biochemistry, Benjamin/ Cummings Publishing Co., Redwood City, CA 1990.
[5] Vogel, W. H., Neuropsycology 1985, 13, 129–135. [6] Villanueva, V. R., Progr. HPLC-HPCE 1998, 7, 461–494. [7] Kuo, I.-T., Huang, Y.-F., Chang, H.-T., Electrophoresis 2005, 26,
2643–2651.
[8] Hsieh, M.-M., Chang, H.-T., Electrophoresis 2005, 26, 187–195. [9] Benturquia, N., Couderc, F., Sauvinet, V., Orset, C. et al.,
Elec-trophoresis 2005, 26, 1071–1079.
[10] Cao, L., Wang, H., Ma, M., Zhang, H., Electrophoresis 2006,
27, 827–836.
[11] Matyska, M. T., Pesek, J. J., Boysen, R. I., Hearn, M. T. W.,
Anal. Chem. 2001, 73, 5116–5125.
[12] Katayama, H., Ishihama, Y., Asakawa, N., Anal. Chem. 1998,
70, 2254–2260.
[13] Katayama, H., Ishihama, Y., Asakawa, N., Anal. Chem. 1998,
70, 5272–5277.
[14] Wang, C., Lucy, C. A., Electrophoresis 2004, 25, 825–832. [15] Kapnissi-Christodoulou, C. P., Lowry, M., Agbaria, R. A.,
Geng, L., Warner, I. M., Electrophoresis 2005, 26, 783–789. [16] Kamande, M. W., Fletcher, K. A., Lowry, M., Warner, I. M., J.
Sep. Sci. 2005, 28, 710–718.
[17] Palonen, S., Jussila, M., Porras, S. P., Riekkola, M.-L.,
Elec-trophoresis 2004, 25, 344–354.
[18] Ghosal, S., Electrophoresis 2004, 25, 214–228.
[19] Porras, S. P., Marziali, E., Gasˇ, B., Kenndler, E.,
Electropho-resis 2003, 24, 1553–1564.
[20] Xuan, X., Li, D., Electrophoresis 2005, 26, 166–175. [21] Guihen, E., Glennon, J. D., Anal. Lett. 2003, 36, 3309–3336. [22] Yang, L., Guihen, E., Glennon, J. D., J. Sep. Sci. 2005, 28,
757–766.
[23] Hsieh, Y.-L., Chen, T.-H., Liu, C.-P., Liu, C.-Y., Electrophoresis 2006, 27, 4288–4294.
[24] Pumera, M., Wang, J., Grushka, E., Polsky, R., Anal. Chem. 2001, 73, 5625–5628.
[25] Neiman, B., Grushka, E., Lev, O., Anal. Chem. 2001, 73, 5220– 5227.
[26] Huang, M.-F., Huang, C.-C., Chang, H.-T., Electrophoresis 2003, 24, 2896–2902.
[27] Lin, Y.-W., Huang, M.-J., Chang, H.-T., J. Chromatogr. A 2003,
1014, 47–55.
[28] Chiou, S.-H., Huang, M.-F., Chang, H.-T., Electrophoresis 2004, 25, 2186–2192.
[29] Huang, M.-F., Kuo, Y.-C., Huang, C.-C., Chang, H.-T., Anal.
Chem. 2004, 76, 192–196.
[30] Yu, C.-J., Su, C.-L., Tseng, W.-L., Anal. Chem. 2006, 78, 8004– 8010.
[31] Nilsson, C., Nilsson, S., Electrophoresis 2006, 27, 76–83. [32] Viberg, P., Jornten-Karlsson, M., Petersson, P., Spégel, P.,
Nilsson, S., Anal. Chem. 2002, 74, 4595–4601.
[33] Huang, Y.-F., Hsieh, M.-M., Tseng, W.-L., Chang, H.-T., J.
Proteome Res. 2006, 5, 429–436.
[34] Yancey, S. E., Zhong, W., Heflin, J. R., Ritter, A. L., J. Appl.
Phys. 2006, 99, 0343131–03431310.
[35] Demers, L. M., Mirkin, C. A., Mucic, R. C., Reynolds, R. A. I.
et al., Anal. Chem. 2000, 72, 5535–5541.
[36] Minko, S., Kiriy, A., Gorodyska, G., Stamm, M., J. Am. Chem.
Soc. 2002, 124, 3218–3219.
[37] Luong, J. H. T., Electrophoresis 1998, 19, 1461–1467. [38] Kuldvee, R., Vaher, M., Koel, M., Kaljurand, M.,
Electropho-resis 2003, 24, 1627–1634.
[39] Tsuchiya, H., Hayashi, T., Tatsumi, M., Hoshino, Y. et al., Clin.
Chem. 1989, 35, 43–47.
[40] Paquette, D. M., Sing, R., Banks, P. R., Waldron, K. C., J.
Chromatogr. B 1998, 714, 47–57.
[41] García, A., Heinänen, M., Jiménez, L. M., Barbas, C., J.
Chromatogr. A 2000, 871, 341–350.
[42] Yokogoshi, H., Kobayashi, M., Mochizuki, M., Terashima, T.,