2007 Special Issue 399-417 2007 , Vol. 24, No. 4 , 399- 417
Going Private Decision and Firm Characteristics:
Evidence from the Regulation Change in Taiwan
Chan-Jane Lin
a, and Hong-Da Wang
a aDepartment of Accounting, National Taiwan University, Taiwan
Abstract
Firms in Taiwan had been required to go public if their capital exceeds 200 million NT dollars since 1981. However, this capital threshold was lifted in November 2001. The main purpose of this research is to investigate the factors that may influence the going private decision due to the regulation change. The empirical results show that firms with distorted capital formation process at or after mandated public offerings choose to go private immediately after the deregulation. The results also indicate that firms with poor financial performances are more likely to go private. We conjectured it is due to the profitability requirement for firms to be listed in Taiwan Security Exchange or traded Over the Counter. Therefore, public firms will have incentives to go private if the listing seems mission impossible. The above finding provides the evidence that firms going private take consideration of costs and benefits of staying public.
Keywords: Mandated IPO, Going private, Firm performance, Corporate governance, Compliance costs
1. Introduction∗
It’s a crucial issue to raise sufficient fund for expansion during a firm’s growth period. Take U.S. capital market an example, this task is accomplished via three major platforms, i.e., American Stock Exchange (ASE), New York Stock Exchange (NYSE), and Nasdaq. While many researches have discussed the reasons for firms to go public (e.g., Pagano et al., 1998; Pastor et al., 2006), what’s more striking is that a lot of public companies go private in recent years. It is estimated that nearly 4,000 companies have deregistered from Nasdaq for the past five years, accounting for one-fifth of firms that are newly listed in Nasdaq each year.1 As a result, the reasons for
∗
Chan-Jane Lin, E-mail: cjlin@ntu.edu.tw,
Hong-Da Wang, E-mail: d91722001@ntu.edu.tw;
Comments from two anonymous reviewers are highly appreciated. Also we would like to thank Shuen-Zen Liu, Shu Yeh, and seminar participants at Feng Chia University, National Taiwan University, the 2005 TAA annual conference, the Emerging Issues in International Accounting and Business Conference 2006 for their helpful comments. Financial support from the National Science Council (NSC94-2416-H-002-032) is greatly acknowledged.
1
For firms to deregister from the three major exchanges in the U.S., two major steps should be followed. First, a firm should delist from the exchange, which means that trading in a firm’s common stock ceases on that exchange. Second, by deregistering with the SEC, a firm will no longer provide
firms to go private are also widely discussed. For instance, Macey et al. (2004) and Panchapagesan and Werner (2004) investigate the impact of involuntary delisting on liquidity, trading costs, and volatility, while Marosi and Massoud (2004) discuss the reasons why firms go private voluntarily. In addition, Weir et al. (2005) examine corporate governance characteristics of deregistered firms from the major exchange in U.K.. In 2002, the enactment of Sarbanes-Oxley Act (SOX) after the Enron failure demands more requirements such as disclosure transparency, corporate governance, internal control mechanism, etc., toward publicly traded corporations, thus causing dramatic increasing costs of staying public and substantial voluntary delistings (Reason, 2003).2
Beginning 1981, to pursue the goal of “capital securitization, security publicization”, firms in Taiwan were required to go public when their capital exceeded a certain amount. As a result, some companies might have
financial statements and other disclosures through mandatory SEC filings (Marosi & Massoud, 2004).
2
Financial Executives International and the SEC estimate it costs at least 2 million US dollars for large-cap companies and 5 hundred thousand dollars for small-cap companies to comply with SOX each year. As a result, many public companies (especially small-cap) decide to go private, and private companies postpone their plans for public offering. Statistics show that delisting companies tripled in 2003 (The Asian Wall Street Journal).
chosen suboptimal financing instruments to avoid public offerings. For example, some family firms, for fear of loss of privacy, might obtain funds needed from related parties such as major shareholders (Liu, 1997; Mai & Hsueh, 2000; Hsueh, 2000). Furthermore, owing to the low capital threshold to go public, many companies mange to maintain capital level far below their real needs to avoid public offerings, resulting in distortion of capital structure (Lin et al., 2004). Appendix A illustrates the historical events of mandated IPO legislation in Taiwan.
Considering that the capital threshold regulation reduced firm autonomy, the Ministry of Economics first raised the threshold from 200 million to 500 million NT dollars in 2000, and further removed it completely in Nov. 2001. As a result, many public companies made their reverse IPO (going private) decisions shortly after the deregulation. The number of firms that went private increased significantly in 2001 and 2002 comparing to the period before and after the change. To our knowledge, setting a public offering threshold is rarely seen in the major capital markets worldwide.3 Lin et al. (2004) document that there exists IPO avoidance among Taiwanese firms during the mandated period. The deregulation of the above public offering requirement therefore provides a unique opportunity to investigate policy effects and implications. Extending the research finding in Lin et al. (2004), we attempt to examine whether firms that avoid public offerings during the mandated period tend to go private immediately after the deregulation. In addition, we examine other factors that may influence the going private decision based on extant literature and the peculiar environment in Taiwan. The factors examined mainly include capital formation, financial performances, growth opportunities, corporate governance, and compliance costs. This paper contributes to the extant literature by providing evidence of the cost-benefit tradeoffs between staying public and going private decisions, and also, feedback to the capital markets in other countries. Furthermore, the empirical results can aid the authorities to assess the economic consequences of regulation change.
The rest of the paper proceeds as follows. Section 2 discusses going private literature in general. Section 3 proposes the hypotheses based on the distinctive environment in Taiwan. Section 4 presents our research
3
Under the 1964 amendment of Exchange Act in the U.S., initial registration is triggered when the asset size of a company exceeds 10 million dollars and the number of holders of a class of its equity securities reaches 500.
methodology. Sample selection and data in our research are described in Section 5. Section 6 presents empirical results. Finally, conclusions are discussed in Section 7.
2. Literature Review
Research on going private transactions can be categorized into two parts. The first one is related to involuntary going private, with the main focus on the consequences of mandated delisting on investors.4 For example, Macey et al. (2004) document that more than 7,350 firms have delisted from U.S. stock exchanges and markets since 1995, with almost half of these being involuntary.5 Moreover, they find huge costs to delisting, with percentage spreads tripling, volatility doubling. Panchapagesan and Werner (2004) argue that Nasdaq should consider revising some of its listing criteria because shareholders face a tremendous increase in trading costs when a firm is delisted.
Besides involuntary going private, voluntary delisting, which mainly occurred during two distinct periods (1980s and post 2000), account for another significant portion of going private transactions. During 1980s, the mechanism of going private was often a leveraged buyout (LBO) by managers and private equity investors, and the change in the governance structure of these firms towards more concentrated residual claims created a new organizational structure, which is more efficient than its predecessor (Muscarella & Vetsuypens, 1990). Moreover, going private transactions often result in significant wealth gains for target stockholders (DeAngelo et al., 1984; Lehn & Poulsen, 1989). But for firms that deregistered from the SEC post 2000, stockholders hold their claims in an electronic form with street names, thus reducing the number of shareholders of record to be less than 300
4
Take NYSE listed companies for example, three numeric requirements for delisting are set out. First, listed companies must meet minimum distribution requirements for their shares. Specifically, the NYSE will consider delisting a firm if the total number of shareholders drops below 400. Second, a company will be considered delisting if it fails to meet certain market capitalization requirements. The NYSE will consider delisting when the average “global market capitalization” over a consecutive 30 trading-day period is less than 15 million US dollars. Third, the NYSE will consider delisting if the average closing price of a security is less than one dollar over a consecutive thirty-trading-day period (Macey et al., 2004).
5
In the U.S., once firms delist from a major exchange, they can choose to trade over-the-counter on Nasdaq’s Bulletin Board (OTCBB) or on the Pink Sheets. For a firm to trade on OTCBB, filing its financial statement with SEC is still necessary, which does not apply to a firm that trades on the Pink Sheets.
(Marosi & Massoud, 2004).6 Reason (2003) argues that onerous regulations, depressed stock prices, and investor hostility are sparking a wider withdrawal.
To provide bases for empirical model in this study, both benefits and costs of staying private will be discussed in the rest of this section.
2.1 Benefits of Going private
2.1.1 Mitigation of Agency Problem and Information Asymmetry
Many scholars such as Jensen and Meckling (1976) have recognized the potential conflict of interest, the agency problem, between managers and shareholders in “publicly” traded firms. As pointed out by Lehn and Poulsen (1989), the above conflict of interest may be mitigated through going private transactions by concentrating on the residual claim among management. As a result, the wealth consequence of managerial decisions can be internalized. Previous studies did document the significant increase in profitability after going private transactions (e.g., Muscarella & Vetsuypens, 1990).
With respect to the information asymmetry, since managers often possess private information, Lehn and Poulsen (1989) suggest that this information asymmetry may offer an explanation for management-led going private transactions. Marosi and Massoud (2004) also predict that when insiders of a public company believe that some of the firm’s assets are undervalued, they would be more likely to lead the going private transactions, since insiders can profitably exploit those assets once the firm is private. For example, within two years following a management-led LBO, Metromedia’s value was increased from $1.3 billion to $4.6 billion (Stein, 1988). The above argument, known as financial incentive hypothesis, is also confirmed by Weir et al (2005) and Weir and Laing (2004) while examining UK firms.
2.1.2 Redistribution from Bondholders
Lehn and Poulsen (1989) argue that stockholder gains could be partially due to wealth transfers from the bondholders of the target firms since debt-equity ratios increase substantially in LBO type of going private transactions. Some well-known going private transactions
6
Under the 1964 amendment of the Securities Exchange Act in 1934, a firm with total assets of at least $10 million must continue to be registered if it has at least 300 shareholders of record.
have experienced substantial drop in bond value. For example, in response to an announcement of a LBO offer in 1980s, RJR Nabisco’s stock price increased by 62% while bond price dropped 16.5% (Wallace, 1988).
2.1.3 Autonomy and Concentration of Control Rights
Family firms, characterized by concentration of voting rights, tend to stay private for the need of corporate control. Pagano and Roell (1998) argue that going public will result in control loss due to dispersion of shareholder rights. To be more concrete, the corporate governance regime in place exposes the firm to exogenous controls in public markets, so that management may lack the autonomy it desires. By contrast, private ownership can provide management the desired autonomy due to the possibility of precisely-calibrated private contracting (Boot et al., 2006). Similarly, concerning the possible loss of corporate control, the ineffective hypothesis proposed by Halpern et al. (1999) and Weir et al. (2005) also predicts that low managerial equity may facilitate going private transactions either through outside-led or inside-led LBOs.
2.1.4 Reduction of the Adverse Effects of Disclosure
Public corporations are required to disclose specific information periodically. The disadvantage of disclosure, on the one hand, is that disclosure is costly. As a result, disclosure costs would reduce the incentives for firms to go IPO (Pagano & Roell, 1998; Ritter, 1987), especially after the enactment of Sarbanes-Oxley Act in 2002.7 Reason (2003) indicates that onerous disclosure requirements following Sarbanes-Oxley Act trigger a wave of public-to-private transactions. On the other hand, corporate strategies may be known to its competitors when public firms periodically disclose its operating and financial information required by the disclosure rules of stock exchanges (Brigham, 1995; Pagano et al., 1998). On the contrary, going private could reduce disclosure costs substantially and retain confidentiality of its competition strategies.
2.1.5 Improvements in Operating Performance
Firms going private produce the change in the
7
An article titled “The downside to staying public”, published on the 3 June 2004 Financial Times points out that after the Enron failure, auditors anticipate that their fees will increase by 25 to 35 percent. In addition, a 2003 Price waterhouse Coopers survey reported that 44% of executives considered compliance with Sarbanes-Oxley Act at least somewhat costly.
governance structure towards more concentrated residual claims so as to create a new organizational structure which is more efficient than its predecessor. Muscarella and Vetsuypens (1990) find that firms which underwent a full or divisional LBO experience significant improvements in profitability due to their ability to reduce costs. In addition, Bae et al. (2000) and Weir et al. (2005) also provide evidence consistent with monitoring hypothesis, which predicts that firms with efficient boards tend to accept the public-to-private offer since concentrated ownership following LBOs leads to better monitoring, which in turn leads to the improvement of operating performance.
2.1.6 Tax Savings
Going private transactions via LBO result in debt-equity ratio increase to a large scale, and so do the tax deductibility of interest payments on corporate debt. On the other hand, incentives also come from the tax advantages of financing going private transactions with employee stock ownership plans (ESOPs).8 The empirical evidence, however, is mixed. Muscarella and Vetsuypens (1990) support this argument, while Lehn and Poulsen (1989) find no significant impact of tax savings on going private transactions.
2.2 Costs of Staying private9
2.2.1 Borrowing Constraints
As indicated in Pagano et al. (1998), the opportunity to tap public markets for funds is particularly attractive for companies with large current and future investments, high leverage, and high growth. Therefore, it is conjectured that firms with these characteristics will face more borrowing constraints if they stay private. On the contrary, firms demanding less for external fund due to higher profitability or lower future growth opportunities have higher incentives to go private. Marosi and Massoud (2004) and Weir et al. (2005) show that lower future growth opportunities do increase the probability of going private transactions.
2.2.2 Higher cost of Capital
By disseminating information to the general public in the stock market, a public company elicits outside competition to its lender and ensures a lower cost of credit (Pagano et al., 1998; Rajan, 1992). With low corporate
8
See Lehn and Poulsen (1989) for a discussion of tax advantages on going private decisions.
9
Please see Lin et al. (2004) for details.
transparency, reputation, and bargaining power with banks, a private company is more unlikely to benefit from this advantage.
2.2.3 Liquidity Puzzle
If the initial owners of a company raise funds from dispersed investors, they factor in the liquidity benefit provided by being listed on an exchange. Moreover, taking a company public provides to its owners opportunities for diversification (Pagano et al., 1998). Boot et al. (2006) also point out that the disadvantage of private ownership (relative to public ownership) is that it imposes the cost of illiquidity on those who provide financing. Furthermore, Marosi and Massoud (2004) find that investors of a target company are left holding significantly less liquid shares after the company deregistered from the SEC.
2.2.4 Less Investor Recognition
In a capital asset pricing model with incomplete information, the stock prices are higher the greater the number of investors aware of the company’s securities (Merton, 1987). Under this argument, a private company is more likely to experience low stock prices due to the lack of advertisement effects by listing on a major exchange.
3. Hypotheses Development
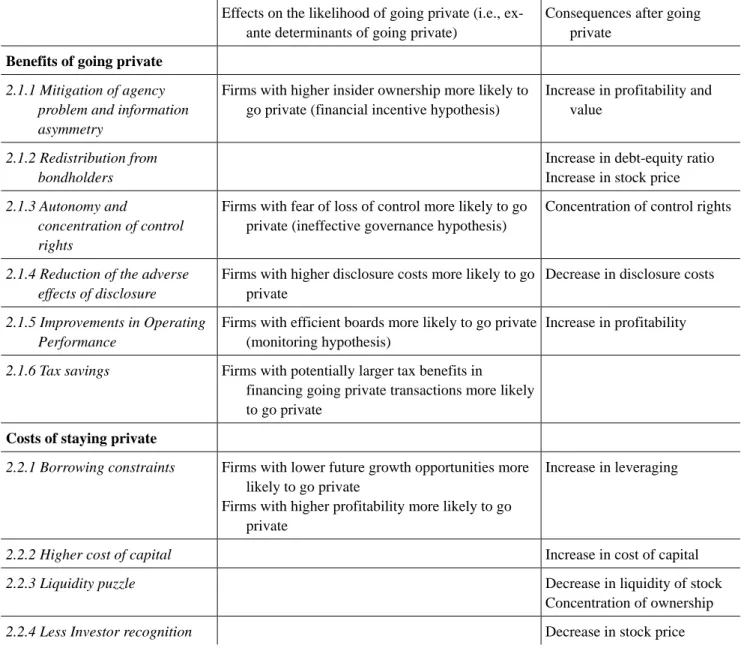
According to the literature reviewed in Section 2, two types of predictions can be derived: first, predictions on the factors that are expected to affect the likelihood of going private decisions and second, predictions on the possible consequences of being private. We summarize these two types of predictions, ex ante determinants and consequence of going private, in Table 1. Since this paper focuses on the decisive factors driving going private transactions, only the ex ante determinants are investigated. The tax savings incentive mentioned in Sec. 2.1.6, however, is not examined because it occurs mostly in LBOs, which often involve substantial tax deductions from interest payments. This scenario can hardly be found in Taiwan. The testing hypotheses are developed based not only on the above determinants but also the particular institutional features in Taiwan, such as mandated IPO, corporate governance environment and profitability requirement for listed firms. Our final testing model, however, is also constrained by the data availability in Taiwan.
Table 1. Classification of the Empirical Predictions on Going Private from its Benefits and Costs
Empirical predictions
Effects on the likelihood of going private (i.e., ex- ante determinants of going private)
Consequences after going private
Benefits of going private
2.1.1 Mitigation of agency problem and information asymmetry
Firms with higher insider ownership more likely to go private (financial incentive hypothesis)
Increase in profitability and value
2.1.2 Redistribution from bondholders
Increase in debt-equity ratio Increase in stock price
2.1.3 Autonomy and
concentration of control rights
Firms with fear of loss of control more likely to go private (ineffective governance hypothesis)
Concentration of control rights
2.1.4 Reduction of the adverse effects of disclosure
Firms with higher disclosure costs more likely to go private
Decrease in disclosure costs
2.1.5 Improvements in Operating Performance
Firms with efficient boards more likely to go private (monitoring hypothesis)
Increase in profitability
2.1.6 Tax savings Firms with potentially larger tax benefits in
financing going private transactions more likely to go private
Costs of staying private
2.2.1 Borrowing constraints Firms with lower future growth opportunities more likely to go private
Firms with higher profitability more likely to go private
Increase in leveraging
2.2.2 Higher cost of capital Increase in cost of capital
2.2.3 Liquidity puzzle Decrease in liquidity of stock
Concentration of ownership
2.2.4 Less Investor recognition Decrease in stock price
3.1 Capital Formation
It is well recognized that firms would trade-off between costs and benefits while making going public or private decisions. As a consequence, a company that went public involuntarily public offering is expected to go private as long as the requirement is lifted. In general, a firm inclined to stay private may take some actions at different points in time. Lin et al. (2004) show that private companies tend to maintain their capital balance very close to the threshold for a long time to avoid mandated public offerings. Their study also find that about 70% of firms going public experience a greater than 50% jump in capital in the year of mandated public offerings, which implies a phenomenon of distorted capital formation.
Once going public, we conjecture that companies with higher incentives to reverse IPO are more likely to control their capital below their real needs, especially after the capital threshold was raised from 200 million to 500 million NT dollars in 2002. It would be easier for them to go private if capital amount is maintained at a lower level since the probability of falling below the capital threshold increases. In short, a firm with stronger tendency to stay private is expected to have a distorted capital formation process under the distinctive legal environment in Taiwan, namely, a capital amount very close to the threshold for a long time before IPO, an asymmetric capital leap at IPO, and a smaller capital amount after IPO, respectively.
Based on the above analysis, the first set of hypotheses are illustrated as follows:
H1: Public firms with distorted capital formation process are more likely to go private after the deregulation. H1a: The longer the period (from one year to five years
prior to a public offering) that public firms maintain its capital closer to the threshold, the more likely that they will go private after the deregulation. H1b: The larger the amount of equity offerings at the
initial public offering, the more likely that public firms will go private after the deregulation.
H1c: Public firms with less capital are more likely to go private after the deregulation.
3.2 Financial performances and growth opportunities
Profitability affects the likelihood of going private in various ways. Pagano et al. (1998) predict that a public company with superior operating performance tends to reverse IPO because of less demand for external equity. However, they document an opposite finding and interpret that investors may mistakenly perceive the high performance as permanent and thus, overvalue the shares. By contrast, Engel et al. (2004) find no significant relationship between financial performances and the going private decisions.
In Taiwan, it is well recognized that the main purpose for a voluntary public offering is to be listed in TSE or traded Over the Counter (OTC).10 To be listed in TSE or traded OTC, however, firms need to meet certain financial requirements.11 Therefore, when firms are not expected to reach the profitability criteria in a short run, they tend to go private. In this study, we use return on assets and going concern audit report as proxies for financial performances.
Researchers also predict that future growth opportunities influence a firm’s willingness to go private. For example, Jensen (1989) points out that firms in low growth industries (e.g. commercial banks, food industry) tend to stay private, while those in high growth industries (e.g. electronics industry, communication industry) have
10
In Taiwan, the liquidity for shares of a public company without listing in TSE or trading in OTC is particularly low since no public exchange platform is provided. So being public itself is not an end point, just a preparation phase for listing in the major exchange.
11
For example, a company that apply for listing in the TSE is required with no cumulative losses last year, and its ratio of operating income to capital and pretax income to capital should meet either one of the following two criteria: (1) 6 percent or more in each of the last two years, or average 6 percent but a upward trend for the last two years. (2) average 3 percent for the past five years.
stronger demands to raise funds in public markets. The empirical results from Lehn and Poulsen (1989) indicate that firms going private exhibit lower sales growth opportunities. Similar findings are presented in Pagano et al. (1998) and Marosi & Massoud (2004), where the likelihood of going private is associated with lower industry market-to-book ratio and Tobin’s Q.12 Due to lack of market price data for many of our observations, this paper uses asset growth rate as a proxy for firms growth opportunity.
Based on the above analysis, the second set of hypotheses are illustrated as follows:
H2: Public firms with poorer financial performances or lower growth opportunities are more likely to go private after the deregulation.
H2a: Public firms receiving a going concern audit report (including restructuring) are more likely to go private after the deregulation.
H2b: Public firms with lower return on assets (ROA) are more likely to go private after the deregulation. H2c: Public firms with lower asset growth rate (AGR) are
more likely to go private after the deregulation. 3.3 Corporate Governance
As Jensen and Meckling (1976) point out agency costs are incurred by shareholders as a result of conflicts of interest between managers and shareholders. A number of corporate governance mechanisms therefore have been proposed to reduce the agency costs. Based on the agency model, Weir and Laing (2004) and Weir et al. (2005) proposed three hypotheses to examine the likelihood of going private decision, namely, ineffective governance hypothesis, financial incentive hypothesis and monitoring hypothesis. Ineffective governance hypothesis concerns the potential threat from the market for corporate control and therefore proposes that firms with weaker corporate governance are more likely to go private.13 The financial incentive hypothesis argues that there are financial gains to executive directors by taking a company private. Therefore, the likelihood of going private is positively
12
Tobin’s Q is calculated as the market value of assets divided by the book value of assets.
13
Here the market for corporate control is regarded as a substitute for weak internal governance (Halpern et al., 1999). Fama (1980) also argues that if the market for corporate control works as hypothesized, ineffective governance mechanism should result in successful hostile take-over.
associated with executive director shareholdings. Examining management buy-out, Frankfurter and Gunay (1992) show that insider shareholdings increase by an average of 58% after the buy-out transactions. This hypothesis also predicts that financial incentive exists when insiders believe that their firm is undervalued by the capital market. The monitoring hypothesis proposes that better monitoring (governance) would be linked to higher probability of going private from the perspective of improvement in operating performance after going private (also see Bae et al., 2000). Thus, it is predicted that firms going private are more likely to have larger institutional shareholdings, no presence of duality, or greater proportion of independent directors.14
Using UK firms as a sample, empirical results from Weir et al. (2005) and Weir and Laing (2004) are consistent with financial incentive hypothesis and monitoring hypothesis. Marosi and Massoud (2004) find that firms in US with higher insider shareholdings are more capable and willing to lead a going private transaction, which supports financial incentive hypothesis.
In Taiwan, however, we do not expect that financial incentive hypothesis would be applicable since the going private observations we examine rarely involve management buy-out transactions. Therefore, either monitoring hypothesis or ineffective governance hypothesis could potentially be a more viable explanation in Taiwan. Unlike western countries, the threat from the market for corporate control is rarely occurred in Taiwan. Hence, we argue that a relation exists between the weak governance structure and going private decision based on the particular corporate governance environment in Taiwan, which lends support to our argument for the ineffective monitoring. Like other emerging markets in Asia, the practice of the corporate governance for Taiwanese firms is still in its infancy. However, the importance and the role of governance mechanisms have been well recognized by capital market participants in Taiwan since the Asian financial crisis in late 1990s. The regulators in Taiwan have tried hard to establish guidelines and impose stricter requirements for publicly traded firms, which lead to the pronouncement of The Practice Guide to Corporate Governance in 2002 and the requirement of two independent directors and one supervisor in the board for IPOs from 2002 on. Under this circumstance, we conjecture that, expecting the substantial change in the
14
Duality means the chairman also holds the position of CEO.
near future, public companies with weaker corporate governance are more likely to go private in order to avoid governance requirements. The prior study also shows that companies with large institutional shareholding, i.e., stronger governance, are more likely to go public (Lin et al., 2004).
Due to data constraints, in this study we employ percentage of non-executive directors and duality as surrogates for level of corporate governance.15 Based on the above analysis, the third set of hypotheses are illustrated as follows:
H3: Public firms with weaker corporate governance are more likely to go private after the deregulation. H3a: Public firms with lower percentage of non-executive
directors are more likely to go private after the deregulation.16
H3b: Public firms with duality are more likely to go private after the deregulation.
3.4 Compliance costs17
Reason (2003) argues that strict rules and onerous regulations embodied in the Sarbanes-Oxley Act of 2002 are prompting more companies to exit the public markets.18 Using ratio of audit fees to sales to proxy for compliance costs, Marosi and Massoud (2004) find that the cost of complying with the Sarbanes-Oxley Act has been an incremental driving force behind the going private phenomenon. As to the proxy for compliance cost, although audit fee is considered to be a good one (e.g.
15
We exclude two popular proxies for corporate governance structure, i.e., insider and institutional shareholdings, due to incomplete disclosure from many sample firms.
16
Executive directors are referred to those directors serve as managers at the same time. We should have tested the independent directors rather than non-executive directors on going private decisions, but the limited disclosure prevents us from doing so.
17
We use “compliance costs” instead of “disclosure costs” since the latter term encompasses multiple meanings and is more than what our theory is trying to entail. Our proxy, the Big Four (Five) dummy, is more directly linked to compliance costs. Moreover, the selected proxy may actually dictate a lower disclosure cost, because selecting a Big Four (Five) audit firm lends greater quality to the firm’s financial reports and reduces the pressure of excessive disclosure.
18
For example, in an SC13e3 filing (the SEC form for reporting going private transactions) on March 4, 2003, Tampa-based Coast Dental Services Inc. complained that the management time and resources devoted to compiling and distributing annual and quarterly reports “are considerable and will likely increase significantly in the future as a result of the [act].” (Reason, 2003)
Marosi & Massoud, 2004), the complete audit fee data are not publicly accessible in Taiwan. Consequently, we use audit firm size and audit firm switch (Big Four (Five) to non Big Four (Five)) as surrogates. Researchers have long recognized that the auditing market behaves like oligopoly, and the Big Four (Five) charge higher audit fees (Chen & Wu, 2004).19 Therefore, we conjecture that Big Four (Five) clients are more likely to go private to save compliance costs. On the other hand, however, for firms to be listed in TSE or traded OTC, they tend to hire the Big Four (Five), when compared with the firms staying in public markets.20 Hence recruiting non Big Four (Five) also signals for less desirous to be listed in the major exchange, and therefore, higher probability to go private. The net effect of the above two contrasting forces is an empirical question. With respect to audit firm switch proxy, we conjecture that a firm with intention to go private has higher incentive to switch from big CPA firms to smaller size CPA firms for audit service in order to save compliance cost.
Based on the above analysis, the fourth set of hypotheses are illustrated as follows:
H4: Public firms with higher compliance costs are more likely to go private after the deregulation.
H4a: The probability of going private is different between non Big Four (Five) clients and Big Four (Five) clients after the deregulation.
H4b: Public firms which switch their auditors from Big Four (Five) to non Big Four (Five) are more likely to go private after the deregulation.
4. Methodology
To investigate the factors that influence the going private decision, similar to most extant literature, this study employs Probit model to test the four sets of hypotheses shown above:
' P r( ' ) 1 ( ' ) ( ' ) ( ) x G O P R IV A T E X X X t d t β β β β φ −∞ = = − Φ − = Φ =
∫
19
The Hirschman-Herfindahl Index of big four CPA firms in audit markets exceeds 1,800 (Lin & Wang, 2004), indicating that the big four can exercise what the Department of Justice in the U.S. defines as significant market power.
20
From Table 4 we can see that about sixty five percent of public companies recruit the Big Four (Five), while the percentage is over eighty for listed companies (Cho, 2005).
Φ (.) means the cumulative distribution function (CDF) of standard normal. The variable “GOPRIVATE” is equal to one if a company chooses to go private after the deregulation, otherwise, it is zero.
In addition to the testing variables associated with specific hypothesis, our empirical model also incorporates two control variables that are often cited to influence the probability of going private. The first control variable is firm size. Pagano et al. (1998) indicate that the probability of going public is positively associated with the size of independent companies under the cost-benefit tradeoffs. In Taiwan, however, it is not uncommon to find that larger companies choose to stay private during the period of mandated IPO. Lin et al. (2004) also show that firm size is negatively associated with the probability of going public. Thus, we conjecture that there is positive association between firm size and probability of going private.
The second control variable we examine is industry classification. Empirical results from Pagano et al. (1998) indicate that high-tech firms are less likely to go public.21 Whereas Jensen (1989) argues that firms in high-growth industry are more likely to go public. In Taiwan, empirical evidence provided by Lin et al. (2004) is consistent with the conjecture by Jensen (1989). This paper therefore predicts that firms in hi-tech industry are less likely to engage in going private transactions.
Based on the above analysis, the Probit regression model of the probability of going private estimation is illustrated as follows (see Appendix B for detailed variable definition and the predicted sign):
Pr (GOPRIVATE t = 1) =
α
+
β
1CAPYEARS+
β
2LnCAPJUMP +β
3LnCAP t-1+
β
4GOINGCONCERN t-1+β
5ROA t-1+β
6AGR t-1++β
7NONEXEC t-1+β
8DUALITY t-1+β
9CPA t-1+β
10CHANGE t-1,t-5+β
11 LnS t-1+β
12 INDWhere,
CAPYEARS: The cumulative years (from one year to five years prior to a firm going public) of capital amount staying between 180 million and 200 million NT dollars.
LnCAPJUMP: The amount of equity offering (with natural logarithm) at the time that the sample firm goes public.
LnCAP t-1: Capital amount (with natural logarithm) one
21
The concern for loss of confidentiality once going public could contribute to this finding as it would deter firms with more sensitive information from going public (Yosha, 1995).
year prior to the deregistration (i.e., going private).22 GOINGCONCERN t-1: A dummy variable that is equal to
1 if the sample firm received an audit report with going concern opinion (including restructuring) one year prior to the deregistration. Otherwise, it is zero. ROA t-1: Return on assets one year prior to the
deregistration.
AGR t-1: Asset growth rate one year prior to the
deregistration.
NONEXEC t-1: Percentage of non-executive directors to
total directors one year prior to the deregistration. DUALITY t-1: A dummy variable that is equal to one if the
chairman of the board was also the CEO one year prior to the deregistration. Otherwise, it is zero. CPA t-1: A dummy variable that is equal to one if the
sample firm was audited by a Big Four (Five) CPA firm one year prior to the deregistration. Otherwise, it is zero.
CHANGE t-1,t-5: A dummy variable that is equal to one if
the sample firm switched its auditor from Big Four (Five) to non Big Four (Five) from one year to five years prior to the deregistration. Otherwise, it is zero. LnS t-1: Total sales (with natural logarithm) one year prior
to the deregistration.
IND: A dummy variable that is equal to one if the sample firm belongs to high-tech industry. Otherwise, it is zero.
5. Sample Selection and Data
5.1 Sample Selection
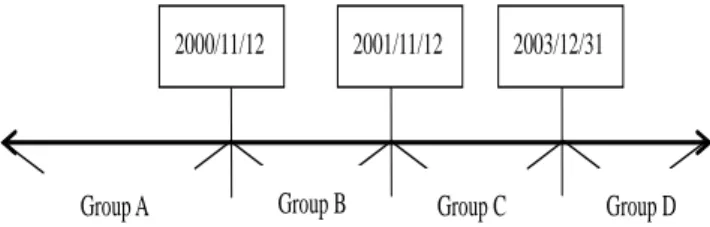
As mentioned before, the capital threshold to go public was raised from 200 million to 500 million NT dollars in November 2000, and further lifted by the Ministry of Economics in November 2001. Stemming from the two major amendments, we separate the time horizon into four periods (see Figure 1). Group A includes those firms that had gone private before Nov. 2000 when the capital threshold was raised to 500 million NT dollars. Firms that went private between Nov. 2000 and Nov. 2001 are referred to as Group B. Group C contains firms going private between Nov. 2001 and Dec. 2003. Group D includes those firms that have gone private since Jan. 2004. Our hypotheses were tested by using Group C as a sample because we focus on the decisive factors that influence the
22
Both deregistration and going private will be used interchangeably in the rest of the paper.
going private decisions after the deregulation. On the other hand, Group A and D are excluded since they receive less impact from the regulation changes. Group B, which is similar to Group C, is not incorporated into our empirical analysis, either.
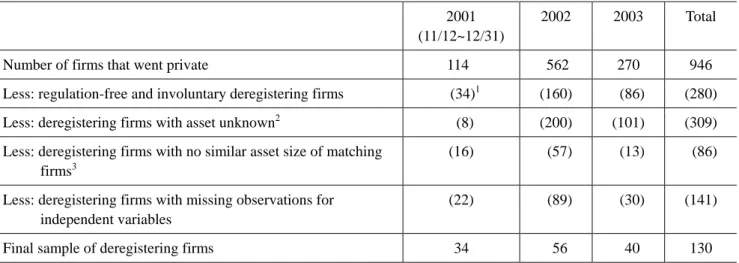
We use a matched Probit analysis to identify the relative importance of different factors driving the going private decisions. Our matched sample is comprised of firms staying public that meet the following two criteria: (1) same industry in terms of 2 digit SIC code and (2) similar asset size. Table 2 presents the sample selection process. Specifically, we use public firms in Taiwan Economic Journal Public Database (TEJ PUB DB) as our starting point for selection of matched sample. Next we sort all sample firms within the same industry based on the asset size one year prior to the sample year of 2001, 2002, and 2003 (for the sampling of Group C). Then we match every deregistering firm with a non-deregistering sample with the closest asset amount. If two or more deregistering firms are matched with an identical non-deregistering sample, then those deregistering firms which fail the matching will continue to be matched with another non-deregistering firm with the next-to-closest size, but the size difference should be within 30%. Sample firms with missing observations for independent variables as well as the involuntary deregistering firms are excluded from the final analysis.23 Based on the above sampling criteria, we end up with 130 pairs (260 observations).24
Figure 1. Classification of Deregistering Firms Based on Changes of Legislation
23
We identify the reasons for going private from the list of “discontinuing public companies” in the Market Observation Post System. Testing samples should be quoted as “going private under the board meeting in response to the amendment of article 156 in the Company Law.” (Please see Table 3 for details)
24
Arising from the fact that this paper is aimed at investigating the impact of regulation changes on the voluntary going private decisions, the regulation-free industries are excluded. It includes Banking & Financing Industry, Leasing Industry, Cable TV, and Telecommunication Industry.
2000/11/12 2001/11/12
Group A Group B Group C 2003/12/31
Table 2. Sample Selection Process
2001 (11/12~12/31)
2002 2003 Total
Number of firms that went private 114 562 270 946
Less: regulation-free and involuntary deregistering firms (34)1 (160) (86) (280)
Less: deregistering firms with asset unknown2 (8) (200) (101) (309)
Less: deregistering firms with no similar asset size of matching firms3
(16) (57) (13) (86)
Less: deregistering firms with missing observations for independent variables
(22) (89) (30) (141)
Final sample of deregistering firms 34 56 40 130
Notes.
1. Because the reason of going private is not publicly available until 2002, 34 is the number of regulation-free deregistering firms. 2. This arises from the fact that some deregistering firms did not file annual report or audited financial statement in the year of
going private, mostly because they went private before the annual stockholders’ meeting was held that year. 3. We define “similar asset size” as differences in asset size within 30%.
5.2 Data Sources
The list of firms going private is identified from the Securities and Futures Commission (SFC) and the “PUB company attribute” in Taiwan Economic Journal (TEJ). Financial data are collected from “Taiwan Finance Database” in TEJ, whereas auditor choice and corporate governance data are retrieved from the database provided by the Securities and Futures Institute (SFI). Finally, we identify the causes of going private from the Market Observation Post System in the website of Taiwan Stock Exchange (TSE).
6. Empirical Results
6.1 Descriptive Tatistics
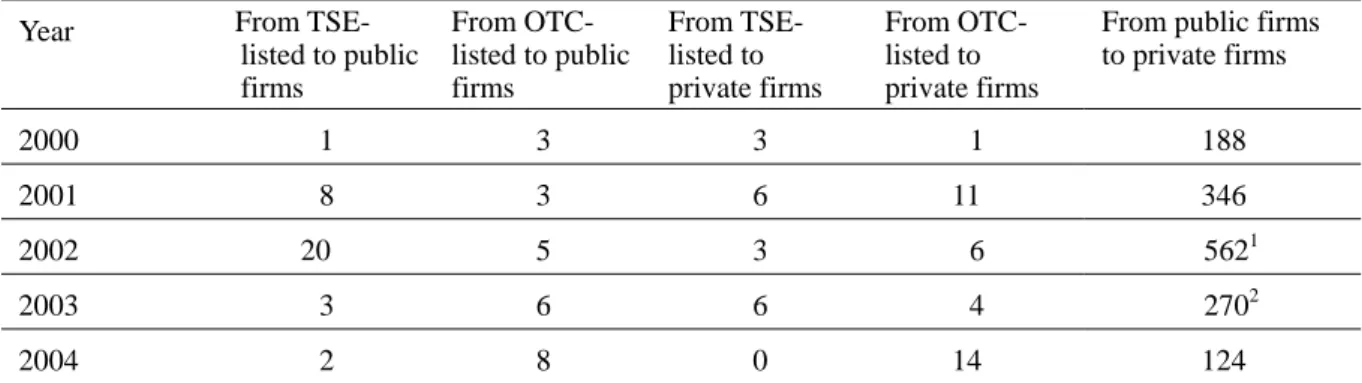
Table 3 lists number of companies changing their exchanges between year 2000 and 2004. Since the capital
threshold of mandated going public was raised in Nov. 2000, the number of going private firms almost doubled from 188 in 2000 to 346 in 2001, and further increased to 562 in 2002, one year after the elimination of mandated IPO by capital threshold, and afterwards reduced gradually in 2003 and 2004. The result shows that regulation changes affect firm choices significantly. Moreover, the number of going public firms decreased drastically from 468 in 2000 to 162 in 2001, and further decreased to 127 in 2002, finally returned to around 150 in 2003 and 2004. This phenomenon provides evidence that many firms go public involuntarily under the requirement of publicly traded by capital threshold, and the number of firms going public decays after the requirement is eliminated. Figure 2 illustrates the number of firms that went private and public respectively from 2000 to 2004.
0 100 200 300 400 500 600 2000 2001 2002 2003 2004 Year N umbers
From public firms to private firms (deregistration) From private to public firms (registration)
Table 3. Number of Firms That Changed Their Trading Platform from 2000 to 2004
Panel A: Firms that change from more liquid markets to less liquid markets
Year From TSE-
listed to public firms From OTC- listed to public firms From TSE- listed to private firms From OTC- listed to private firms
From public firms to private firms 2000 1 3 3 1 188 2001 8 3 6 11 346 2002 20 5 3 6 5621 2003 3 6 6 4 2702 2004 2 8 0 14 124
Panel B: Firms that change from less liquid markets to more liquid markets
Year From OTC- trading to TSE-listed From public firms to TSE-listed From public firms to OTC-listed From emerging stock to TSE-listed From emerging stock to OTC-listed From private to public firms 2000 55(1) 21 130(3) 0 0 468(43) 2001 0 27 106(2) 0 0 162 ( 6) 2002 39 6 25 15 55 127 ( 1) 2003 0 4 8 14 65 159 ( 1) 2004 1 5 8 8(1) 80(2) 141 ( 4) Notes.
Number of firms that fail the application are stated in the parentheses.
1. Within the 562 firms, 503 deregistered because “going private under the board meeting in response to the amendment of article 156 in the Company Law.” 28 went private due to “dissolution by mergers or acquisition.” 12 were “declaration of invalidity.” And the rest 19 firms went private stemming from other reasons.
2. 199 out of the 270 firms went private due to “going private under the board meeting in response to the amendment of article 156 in the Company Law.”
Table 4. Descriptive Statistics for Deregistering (Going Private) and Matched Sample
Mean Median Variables Deregistering Sample Non-Deregistering Sample Difference t-statistics Deregistering Sample Non-Deregistering Sample Difference z-statistics CAPYEARS 1.362 1.238 0.62 1.000 1.000 0.80 LnCAPJUMP 11.890 11.650 2.08** 11.918 11.608 2.06** LnCAP t-1 13.188 13.183 0.05 13.141 13.114 0.73 GOINGCONCERN t-1 0.131 0.031 3.00*** 0.000 0.000 2.95*** ROA t-1 -0.044 -0.002 -3.11*** -0.006 0.006 -2.61*** AGR t-1 -0.039 0.043 -3.49*** -0.044 0.021 -3.86*** NONEXEC t-1 0.689 0.732 -1.26 0.750 0.750 -1.12 DUALITY t-1 0.308 0.369 -1.05 0.000 0.000 -1.05 CPA t-1 0.654 0.654 0.00 1.000 1.000 0.00 CHANGE t-1, t-5 0.054 0.046 0.28 0.000 0.000 0.28 LnS t-1 13.161 13.393 -1.36 13.312 13.549 -1.56 N 130 130 130 130
Notes. 1. Please see “Appendix B: Variable Definitions” for details.
To prevent the empirical results from being outlier-driven, we winsorize extreme observations based on the method adopted by Huson et al. (2004). Rather than deleting these outliers, we replace them with the value of mean plus (minus) three times the standard deviation. Table 4 presents the descriptive statistics of the independent variables defined in section 4. It shows that deregistering firms are more likely to receive going
concern audit opinion (13.1% v.s. 3.1%), and their financial performance as well as growth opportunity measures, including return on assets and asset growth rate, are worse. With respect to capital formation variables (i.e., CAPYEARS, LnCAPJUMP and LnCAP t-1), only
LnCAPJUMP is significant. As for the compliance costs, no significant differences are found between the deregistering and non-deregistering firms.
Table 5
.
The Pearson-Spearman Correlation Coefficient for Deregistering (Going Private) and Matched SampleGOPRIVATE CAPYEARS LnCAPJUMP LnCAP GOINGCONCERN ROA
GOPRIVATEt 1 0.04 0.13** 0.00 0.18*** -0.18*** CAPYEARS 0.05 1 0.14** 0.09 0.02 -0.00 LnCAPJUMP 0.13** 0.12* 1 0.49*** 0.16*** -0.07 LnCAP 0.05 0.17*** 0.53*** 1 0.27*** -0.14** GOINGCONCERN 0.18*** 0.00 0.16** 0.22*** 1 -0.28*** ROA -0.16*** -0.00 -0.09 -0.15** -0.28*** 1 AGR -0.24*** -0.02 -0.09 -0.18*** -0.27*** 0.44*** NONEXEC -0.07 -0.02 -0.03 0.04 -0.02 -0.13** DUALITY -0.07 0.06 0.06 -0.07 0.06 -0.08 CPA 0.00 -0.23*** -0.05 -0.06 0.04 -0.18*** CHANGE 0.02 -0.05 0.09 0.12* 0.13** -0.05 LnS -0.10 0.10 0.09 0.31*** -0.09 0.40*** IND 0.00 -0.21*** -0.12* -0.28*** -0.05 -0.25*** Table 5
.
(continued)AGR NONEXEC DUALITY CPA CHANGE LnS IND
GOPRIVATEt -0.21*** -0.08 -0.07 0.00 0.02 -0.08 0.00 CAPYEARS -0.08 -0.02 0.07 -0.19*** -0.03 0.03 -0.20*** LnCAPJUMP -0.05 -0.04 0.09 -0.02 0.07 0.08 -0.12** LnCAP -0.12* 0.01 -0.04 -0.02 0.08 0.30*** -0.26*** GOINGCONCERN -0.19*** 0.01 0.06 0.04 0.13** -0.08 -0.05 ROA 0.41*** -0.18*** -0.09 -0.22*** -0.05 0.42*** -0.31*** AGR 1 -0.08 -0.13** -0.04 -0.14** 0.10 0.00 NONEXEC -0.09 1 0.13** 0.13** -0.10* -0.24*** -0.04 DUALITY -0.13** 0.18*** 1 -0.08 -0.09 -0.07 -0.05 CPA -0.03 0.09 -0.08 1 -0.28*** -0.14** 0.28*** CHANGE -0.16** -0.09 -0.09 -0.28*** 1 0.01 -0.06 LnS 0.06 -0.18*** -0.07 -0.12** 0.01 1 -0.29*** IND -0.01 -0.08 -0.05 0.28*** -0.06 -0.31*** 1 Notes.
1. Please see “Appendix B: Variable Definitions” for details. For brevity, we ignore the time period description for the variables. Therefore, GOPRIVATE=GOPRIVATEt; LnCAP=LnCAP t-1; GOINGCONCERN=GOINGCONERN t-1;
ROA=ROA t-1; AGR=AGR t-1; NONEXEC=NONEXEC t-1; DUALITY=DUALITY t-1; CPA=CPA t-1; CHANGE=CHANGE t-1,
t-5; LnS=LnS t-1.
2. Pearson correlation coefficient is presented in italics, while Spearman correlation coefficient is presented in bold face. 3. * denotes significance at the 10% level, ** denotes significance at the 5% level, *** denotes significance at the 1% level.
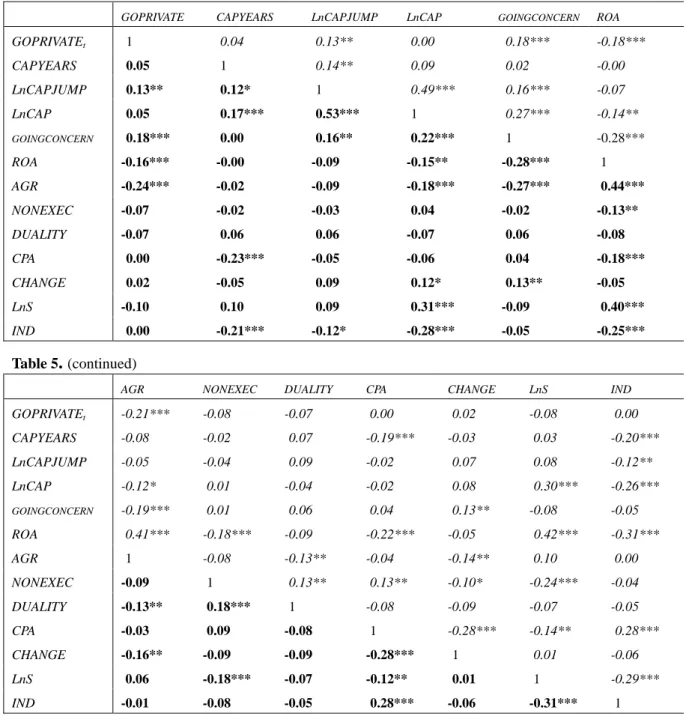
Correlation coefficients are presented in Table 5 with the italic numbers being Pearson correlation coefficients and bold face numbers being Spearman correlation coefficients. Despite some significant association between some independent variables, both the Pearson and Spearman correlation coefficients between any two independent variables are below 0.5 except for the Spearman correlation coefficient between LnCAPJUMP and LnCAP t-1 which equals 0.53, suggesting that the
multicollinearity problem is less of an issue. Moreover, the variance inflation factor (VIF) computed in subsequent regression analyses does not indicate substantial multicollinearity (not tabulated).
6.2 Probit Regression Analysis
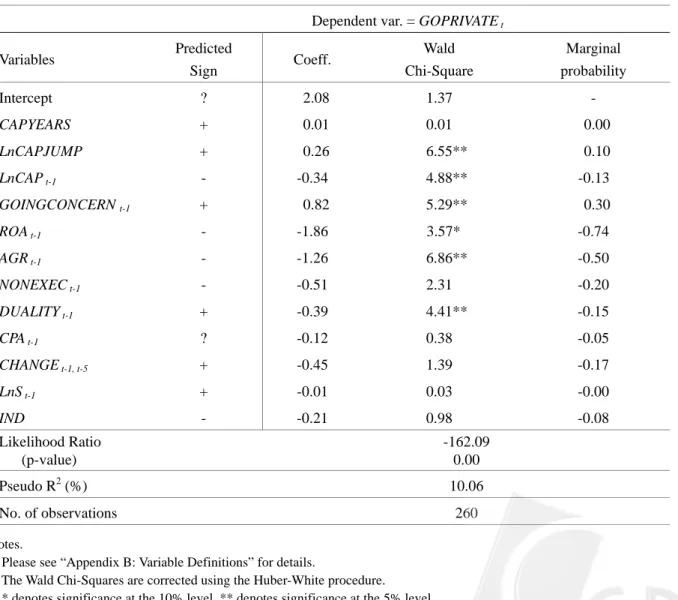
Table 6 provides the results of Probit regression for deregistering firms and their matched pairs. The significance of LnCAPJUMP and LnCAP t-1 which support
H1b and H1c implies that firms with distorted capital
formation process tend to go private after the capital threshold is lifted. CAPYEARS, however, is not significant though the sign of the coefficient is as expected. Therefore we conclude that firms going private are those which distort capital formation at or after going public rather than those inclined to avoid public offerings during the mandated period.
With respect to the financial performances and growth opportunities, firms with worse financial performances and lower growth opportunities, i.e., higher probability of receiving going concern opinions, lower return on assets and asset growth rate, are more likely to go private, which are consistent with hypotheses H2. We interpret the results as that these firms reverse their public status under the cost-benefit tradeoffs. In addition, results of marginal probability show that poor performance substantially affects the decision for going private (e.g., marginal probability for ROA t-1 is equal to -0.74).
Table 6. The Probit Analysis for Deregistering (Going Private) and Matched Sample Dependent var. = GOPRIVATE t
Variables Predicted Sign Coeff. Wald Chi-Square Marginal probability Intercept ? 2.08 1.37 - CAPYEARS + 0.01 0.01 0.00 LnCAPJUMP + 0.26 6.55** 0.10 LnCAP t-1 - -0.34 4.88** -0.13 GOINGCONCERN t-1 + 0.82 5.29** 0.30 ROA t-1 - -1.86 3.57* -0.74 AGR t-1 - -1.26 6.86** -0.50 NONEXEC t-1 - -0.51 2.31 -0.20 DUALITY t-1 + -0.39 4.41** -0.15 CPA t-1 ? -0.12 0.38 -0.05 CHANGE t-1, t-5 + -0.45 1.39 -0.17 LnS t-1 + -0.01 0.03 -0.00 IND - -0.21 0.98 -0.08 Likelihood Ratio (p-value) -162.09 0.00 Pseudo R2 (%) 10.06 No. of observations 260 Notes.
1. Please see “Appendix B: Variable Definitions” for details.
2. The Wald Chi-Squares are corrected using the Huber-White procedure. 3. * denotes significance at the 10% level, ** denotes significance at the 5% level.
With regard to corporate governance variables, Table 6 shows that the coefficient of the percentage of non-executive directors has the expected negative sign, but statistically insignificant. The other governance proxy, duality, is found to have negative and significant association with the likelihood of going private, which is inconsistent with H3b. In other words, this study shows firms with more duality are more likely to stay public. The fact that non-executive directors may not be equivalent to independent directors, the desired proxy for governance, could partially contribute to the insignificant results. The opposite results for duality variable can be explained as follows. First, the presence of duality might not be regarded as a signal for weak corporate governance in Taiwan during our sample period. In fact duality is a common practice among Taiwanese firms. As shown in Table 4, the presence of duality accounts for about one-third of the sample firms. Second, the importance and the requirement of governance mechanism are not well recognized until recent years. The Practice Guide to Corporate Governance was announced in October 2002, where the separation of CEO and Chairman is strongly recommended. Yet this recommendation seems quite flexible since it also states “If duality is present or the chairman and the CEO are couple or close relatives, then the number of independent directors should be increased.” (Article 24). Hence, to meet the minimum requirement, the corporate governance mechanisms adopted by a firm could be complementary, i.e., duality with more independent directors, and vice versa.
With respect to the test of compliance costs, neither proxy (i.e., CHANGE t-1, t-5 and CPA t-1) is found to have
significant results. The contrasting forces of compliance cost concerns (i.e., Big Four (Five) clients tend to go private) versus incentives for further listings (i.e., non Big Four (Five) clients are inclined to go private) might contribute to the insignificant results in testing H4a (i.e., CPA t-1). Whereas, the insignificance of CHANGE t-1, t-5
could be partially explained by the fact that firms choose their auditors based on concerns other than audit fees. Yet we can not rule out the possibility that the audit firm size and audit firm switch dummies are too rough to capture the differences in compliance costs.
In short, deregistering firms are found to have distorted capital formation process, worse financial performances, lower growth opportunities, and less duality.
Significant differences exist when comparing the results in Taiwan with those in other countries. In the U.S., firms that delist voluntarily are found to have lower future growth opportunities, higher insider shareholdings and compliance costs (Marosi & Massoud, 2004). In the U.K., firms that deregister voluntarily have higher CEO and institutional shareholdings, higher duality, and lower future growth opportunities. However non-executive directors are not significant (Weir et al., 2005). Collectively, empirical results across the three countries (U.S., U.K., Taiwan) consistently show that firms with lower future growth prospects are more likely to go private. Interestingly, however, firms with poor financial performances in Taiwan tend to go private. The main reasons may arise from different capital market structures because a public company in Taiwan is not qualified to list in TSE or traded OTC unless it meets specified profitability requirements. Therefore, a firm has little incentives to stay public when its financial performance is far below the profitability criteria.
6.3 Sensitivity Analyses
To test the robustness of our empirical results, we conduct the following additional analyses:
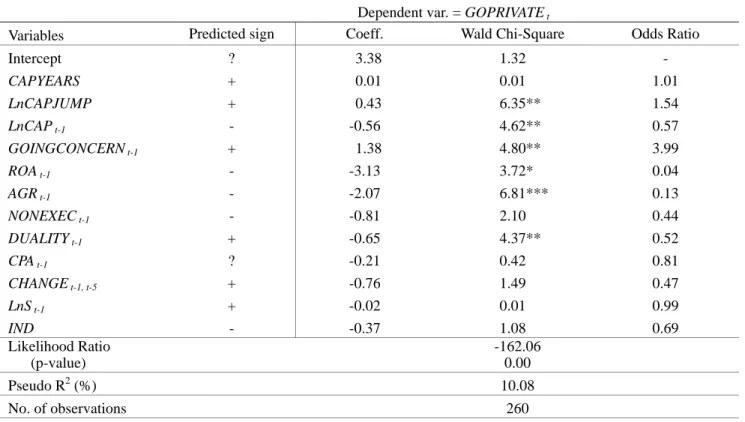
1. We use logit model instead of probit model to see if the results still hold. Empirical evidence in Table 7 shows that the results are quite robust to different discrete response models.
2. Besides sales, assets are also a well known proxy for firm size (Marosi & Massoud, 2004; Opler & Titman, 1993). In Table 8, using total assets as size proxy, we show that all results still hold except for the increase in significance of some variables (e.g., LnCAPJUMP and ROA t-1).
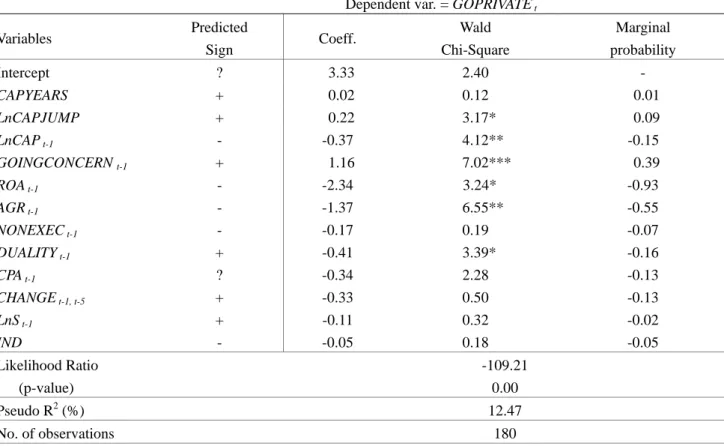
3. To control for yearly effects, we exclude observations for year 2003 to capture the immediate effects of deregulation on going private decisions. Table 9 shows that the results are quite consistent with those tabulated in Table 6.
7. Conclusion and Discussion
Firms in Taiwan had been required to go public if their capital exceeds 200 million NT dollars since 1981. However, this capital threshold was raised to 500 million NT dollars in November 2000, and further lifted by the Ministry of Economics in November 2001. Since then, many public companies have chosen to go private. The
Table 7. Sensitivity Analysis: Logit Analysis for Deregistering (Going Private) and Matched Sample Dependent var. = GOPRIVATE t
Variables Predicted sign Coeff. Wald Chi-Square Odds Ratio
Intercept ? 3.38 1.32 - CAPYEARS + 0.01 0.01 1.01 LnCAPJUMP + 0.43 6.35** 1.54 LnCAP t-1 - -0.56 4.62** 0.57 GOINGCONCERN t-1 + 1.38 4.80** 3.99 ROA t-1 - -3.13 3.72* 0.04 AGR t-1 - -2.07 6.81*** 0.13 NONEXEC t-1 - -0.81 2.10 0.44 DUALITY t-1 + -0.65 4.37** 0.52 CPA t-1 ? -0.21 0.42 0.81 CHANGE t-1, t-5 + -0.76 1.49 0.47 LnS t-1 + -0.02 0.01 0.99 IND - -0.37 1.08 0.69 Likelihood Ratio (p-value) -162.06 0.00 Pseudo R2 (%) 10.08 No. of observations 260
Notes: 1. Please see “Appendix B: Variable Definitions” for details.
2. The Wald Chi-Squares are corrected using the Huber-White procedure.
3. * denotes significance at the 10% level, ** denotes significance at the 5% level, *** denotes significance at the 1% level.
Table 8. Sensitivity Analysis: Probit Analysis for Deregistering (Going Private) and Matched Sample when Using Assets as Size Proxy
Dependent var. = GOPRIVATE t
Variables Predicted sign Coeff. Wald Chi-Square Marginal probability
Intercept ? 1.75 1.02 - CAPYEARS + -0.00 0.00 -0.00 LnCAPJUMP + 0.29 7.61*** 0.11 LnCAP t-1 - -0.65 6.76*** -0.26 GOINGCONCERN t-1 + 0.81 5.02** 0.30 ROA t-1 - -2.39 6.66*** -0.95 AGR t-1 - -1.41 6.97*** -0.56 NONEXEC t-1 - -0.44 1.80 -0.18 DUALITY t-1 + -0.39 4.45** -0.16 CPA t-1 ? -0.12 0.36 -0.05 CHANGE t-1, t-5 + -0.45 1.35 -0.18 LnASSET t-1 + 0.28 2.16 0.11 IND - -0.13 0.35 -0.05 Likelihood Ratio (p-value) -161.08 0.00 Pseudo R2 (%) 10.63 No. of observations 260
Notes: 1. Please see “Appendix B: Variable Definitions” for details. LnASSET t-1 is total assets (with natural logarithm) one year prior to the deregistration.
2. The Wald Chi-Squares are corrected using the Huber-White procedure.
Table 9. Sensitivity Analysis: The Probit Analysis for Deregistering (Going Private) and Matched Sample Excluding the Sample of Year 2003
Dependent var. = GOPRIVATE t
Variables Predicted Sign Coeff. Wald Chi-Square Marginal probability Intercept ? 3.33 2.40 - CAPYEARS + 0.02 0.12 0.01 LnCAPJUMP + 0.22 3.17* 0.09 LnCAP t-1 - -0.37 4.12** -0.15 GOINGCONCERN t-1 + 1.16 7.02*** 0.39 ROA t-1 - -2.34 3.24* -0.93 AGR t-1 - -1.37 6.55** -0.55 NONEXEC t-1 - -0.17 0.19 -0.07 DUALITY t-1 + -0.41 3.39* -0.16 CPA t-1 ? -0.34 2.28 -0.13 CHANGE t-1, t-5 + -0.33 0.50 -0.13 LnS t-1 + -0.11 0.32 -0.02 IND - -0.05 0.18 -0.05 Likelihood Ratio (p-value) -109.21 0.00 Pseudo R2 (%) 12.47 No. of observations 180
Notes: 1. Please see “Appendix B: Variable Definitions” for details.
2. The Wald Chi-Squares are corrected using the Huber-White procedure.
3. * denotes significance at the 10% level, ** denotes significance at the 5% level, *** denotes significance at the 1% level.
main purpose of this research is to investigate the factors that influence the going private decision. The factors analyzed include capital formation, financial performances, growth opportunities, corporate governance, and compliance costs.
Our empirical results show that firms with distorted capital formation process at or after mandated public offerings choose to go private immediately after the deregulation. With respect to the impact of financial performances and growth opportunities, it is found that firms with lower return on assets or lower assets growth rate or receiving going concern opinion are more likely to go private. Moreover, firms going private are found to have less duality.
In short, this study finds that the going private decision can be detected by its distorted capital formation process, and when combined with poor financial performances, the probability of going private increased substantially. In Taiwan, to be listed in TSE or traded in OTC firms need to meet certain financial requirements. Therefore, it is conjectured that unless firms are able to
reach the profitability criteria in short-run, there will be no incentives for them to stay public due to substantial compliance costs. The above finding provides the evidence that firms going private take consideration of costs and benefits of staying public.
Due to the limited disclosure transparency of public companies in Taiwan, we are unable to collect data on selective variables, e.g. institutional and insider shareholdings, percentage of independent directors, audit fees, etc., for a more complete analysis. Furthermore, since many firms failed to file their annual reports of prior year when going private, they are excluded from our deregistering sample due to data availability. As a consequence, the generalizability of our conclusion is somewhat limited. With respect to future research, it might be fruitful to further partition deregistering firms based on their financial performances to gain a better understanding of their decisions. It will be of great interests to examine the consequences of this policy on the going private decisions. In addition, the Ministry of Economics in Taiwan schedules to regulate private firms
to disclose their financial information periodically in the future to compensate for the deregulation of mandated public offerings. What consequences will this policy have on the willingness of going public deserves researchers’ attention.
References
Bae, S. C., Hendershott, R.J., & Jo, H. (2000). Choosing
an organisational form: Leveraged buyouts versus leveraged recapitalisations. Working Paper, Bowling
Green State University.
Boot, A., Gopalan, R., & Thakor, A. (2006). The Entrepreneur’s choice between private and public ownership. Journal of Finance, 61(2), 803-836. Brigham, E. F. (1995). Fundamentals of financial
management (7th edition). Orlando, Florida: Dryden Press.
Chen, Ken Y., & Wu, Shan-Ying (2004). Industry specialists, audit fees and auditor size: Evidence from Taiwan. Taiwan Accounting Review, 5(1), 41-70. Cho, C. C. (2005). Corporate governance and auditor
choice. Working Paper, College of Management,
National Taiwan University.
DeAngelo, H., DeAngelo, L., & Rice, E. (1984). Going private: Minority freezeouts and stockholder wealth.
Journal of Law and Economics, 27(2), 367-402.
Engel, E., Hayes, R. M., & Wang, X. (2004). The
Sarbanes-Oxley Act and firms' going-private decisions. Working Paper, Graduate School of
Business, University of Chicago.
Fama, E. F. (1980). Agency problems and the theory of the firm. Journal of Political Economy, 88(2), 288-307. Frankfurter, G. M., & Gunay, E. (1992). Management
buyouts: The Sources and sharing of wealth between insiders and outsider shareholders. Quarterly Review
of Economics and Finance, 32(2), 82-95.
Halpern, P., Kieschnick, R., & Rotenberg, W. (1999). On the Heterogeneity of leveraged going private transactions. The Review of Financial Studies, 12(2), 281-309.
Hsueh, L. M. (2000). The Downside of mandated IPO.
Economic Outlook, 72, 92-95.
Huson, M., Malatesta, P., & Parrino, R. (2004). Managerial succession and firm performance.
Journal of Financial Economics, 74(2), 237-275.
Jensen, M. (1989). Eclipse of the public corporations.
Harvard Business Review, 67, 61-74.
Jensen, M., & Meckling, W.H. (1976). Theory of the firm: Managerial behavior, agency costs and ownership structure. Journal of Financial Economics, 3(4), 305-360.
Lin, C. J., Liu, C. C., & Chen, J. H. (2004). The Impact of capital threshold on the behavior of IPO avoidance.
Review of Securities & Futures Markets, 16(2),
43-80.
Lin, C. J., & Wang, H. D. (2004). The Consequences of consolidation of large accounting firms on audit markets: A Mirror from GAO report. Accounting
Research Monthly, 227, 98-108.
Liu, L. Y. (1997). The Policy of mandated IPO and the definition of public companies. China Law Journal, 167, 48-56.
Lehn, K., & Poulsen, A. (1989). Free cash flow and stockholder gains in going private transactions.
Journal of Finance, 44(3), 771-787.
Macey, J., O’Hara, M., & Pompilio, D. (2004). Down and
out in the stock market: The Law and finance of the delisting process. Working Paper, Cornell
University.
Mai, C. C., & Hsueh, L. M. (2000). Research on the
criteria of IPO-free application for manufacturing industries. Chung Hua Institution for Economic
Research.
Marosi, A., & Massoud, N. (2004). Why do firms go dark? Working Paper, University of Alberta.
Merton, R. C. (1987). A Simple model of capital market equilibrium with incomplete information. Journal of
Finance, 42(3), 483-510.
Muscarella, C. J., & Vetsuypens, M. R. (1990). Efficiency and organizational structure: A Study of reverse LBOs. Journal of Finance, 45(5), 1389-1413. Opler, T., & Titman, S. (1993). The Determinants of
leveraged buyout activity: Free cash flow vs. financial distress costs. Journal of Finance, 48(5), 1985-1999.
Pagano, M., & Röell, A. (1998). The Choice of stock ownership structure: Agency costs, monitoring, and the decision to go public. The Quarterly Journal of
Economics, 113(1), 187-225.
Pagano, M., Panetta, F., & Zingales, L. (1998). Why do companies go public? An Empirical analysis.
Journal of Finance, 53(1), 27-64.
Panchapagesan, V., & Werner, I. (2004). From pink slips
Nasdaq. Working Paper, Fisher College of Business.
Pastor, L., Taylor, L. & Verones, P. (2006).
Entrepreneurial Learning, the IPO Decision, and the Post-IPO Drop in Firm Profitability. Working
Paper.
Pástor, L., Taylor, L., & Veronesi, P. (2006).
Entrepreneurial learning, the IPO decision, and the post-IPO drop in firm profitability. Working Paper.
Rajan, R. G. (1992). Insiders and outsiders: The Choice between informed and arm’s-length debt. Journal of
Finance, 47(4), 1367-1400.
Reason, T. (2003, May 1). Off the street. CFO Magazine. Ritter, J. R. (1987). The Costs of going public. Journal of
Financial Economics, 19(2), 269-281.
Stein, B. (1988, August 16). Where are the stockholders’ yachts? But John Kluge pockets billions from metromedia’s LBO. Barron’s, 6-7.
Wallace, A. (1988, November. 27). A Bruising battle over bonds. New York Times, D1.
Weir, C., & Laing, D. (2004). Going private transactions
and corporate governance in the UK. Working Paper,
The Robert Gordon University.
Weir, C., Laing, D., & Wright, M. (2005). Incentive effects, monitoring mechanisms and the market for corporate control: An Analysis of the factors
affecting public to private transactions in the UK.
Journal of Business Finance and Accounting,
32(5-6), 909-943.
Wu, L. (2004). Whether the regulation of mandated IPO should be resumed. OTC Monthly Review, 93, 33-44. Yosha, O. (1995). Information disclosure costs and the
choice of financing source. Journal of Financial
Intermediation, 4(1), 3-20.
Biographical Notes
Chan-Jane Lin is a Full Professor in the Department of Accounting at National Taiwan University in Taipei, Taiwan. She received a B.A. in Accounting from National Taiwan University, and an M.B.A. and a Ph.D. in Accounting from the University of Maryland. Her recent research interests include earnings management, financial reporting, IPO decisions, corporate governance, and audit quality.
Hong-Da Wang is a Ph.D. candidate in the Department of Accounting at National Taiwan University in Taipei, Taiwan. He received a B.Sc. in Accounting from National Taiwan University, and a M.S. in Accounting from National Chengchi University. His current research interests include corporate governance and IPO decisions.
Appendix A
The Historical Events of Mandated IPO Legislation
Date Content of clauses Intention
1980/5/9 The company Law stated that a firm is required to go public by a specified capital threshold, which is up to the decision of the Ministry of
Economics.
To encourage dispersion of shares and economic development.
1981/2/14 The capital threshold was set at 200 million NT dollars by the Ministry of Economics.
To complement the legislation in 1980.
1983/12/7 An additional clause stated the regulation-free industries (e.g., government-owned companies).
Consideration of the different characteristics in government-owned companies.
1990/11/10 An additional clause stated that public offerings of government-owned companied should be permitted by the authorities concerned.
As the above explanation
2000/11/2 The capital threshold was raised to 500 million NT dollars.
Consideration of IPO incentives for small-cap companies. In addition, to mitigate dysfunction for firms that avoid public offerings.
2001/11/12 The Company Law stated that IPO decision is up to the board of directors of the company.
For company autonomy concerns.
2001/12/5 The public offering by capital threshold was lifted by the Ministry of Economics.
Administrative orders to complement the amendment of Company Law.