DOI 10.1007/s11135-007-9150-y
O R I G I NA L PA P E R
Comparing the main effects and moderating effects
of education among three models in IT service:
a quantitative approach
Chieh-Peng Lin· Cherng G. Ding
Published online: 28 November 2007 © Springer Science+Business Media B.V. 2007
Abstract This study examines the formation of relationship quality and loyalty for an ISP (Internet service provider). Three conceptual models are tested for comparison. In the models, relational selling behavior, network quality, and service recovery indirectly influ-ence loyalty with an ISP through the mediation of relationship quality. That is, in model 1, relationship quality is examined as a single construct, rather than the second-order construct comprising satisfaction and trust in model 2. In model 3, satisfaction and trust are examined as two different constructs. Customer education moderates several paths of the three mod-els. The moderating effects are simultaneously examined using data from customers of a Taiwan’s leading ISP. The test results indicate that the influence of satisfaction on loyalty and that of network quality on satisfaction are stronger for low education customers than high education customers, while the influence of trust on loyalty and that of network quality on trust are stronger for high education customers than low education customers. Furthermore, the influences of relational selling behavior and service recovery on satisfaction and trust are similar for both high education customers and low education customers. Implications of the empirical findings are also discussed.
Keywords Moderator· Education · Satisfaction · Trust · Relational selling behavior· Service recovery · Relationship quality · Loyalty
1 Introduction
Advances in Taiwan’s IT (information technology) industries continue at an unbounded pace, making the island become more competitive in this field than are most other regions around the world. Taiwan’s IT industry enjoyed considerable growth during 2005, as exports of both
C.P. Lin (
B
)Graduate School of Technological and Vocational Education, National Yunlin University of Science and Technology, 123 University Rd., Section 3, Douliou, Yunlin 64002, Taiwan, ROC e-mail: [email protected]
C. G. Ding
notebooks and servers reached a record high, occupying the largest market share around the globe. From the perspective of the Internet technology, the Internet’s broadband market penetration rate in Taiwan ranks second globally (Lin and Ding 2005). From a perspective of consumer behavior today, customer loyalty becomes crucial to many business-to-cus-tomer IT service, including ISP area. ISPs are now seeking cusbusiness-to-cus-tomers by offering highly competitive services in order to obtain customer loyalty, but such loyalty with an ISP relies on achieving relationship quality with that ISP (Lin and Ding 2005). Previous studies have demonstrated the importance of relationship management in the IT area and their impact on company profitability and customer retention (e.g.,Crosby et al. 1990;Tam and Wong 2001), but the modern approach to relationship quality and loyalty in the IT service sector borrows heavily from the marketing theory and science that has been in use for decades in the general industry (Lin and Ding 2006). This study identifies the critical customer loyalty determinants from the perspective of the intangible ISP service and also considers customer education as an important variable to influence the perceptions of ISP service and to moderate their loyalty formation. Examining the loyalty from an educational point of view, this paper can be considered one of serial works byLin and Ding(2005,2006).
This research differs from previous works in two critical areas. First, this study con-ducts latent mean difference testing in SEM (Structural equation modeling). By tradition, the practice of applying MANOVA to data and hypotheses that are actually reflective of latent-variable systems can be very misleading, but SEM produces a highly viable alternative that provides accurate information on true group differences for many of the same types of latent-variable systems (Cole et al. 1993). Consequently, it is justifiable in this study to proceed with an analysis of latent mean differences across groups. Second, this study is one of the few studies to examine IT relationship quality by including education as a potential moderator based on three alternative models. Although education is a critical factor in the context of IT service (Abdul-Gader 1995), it has rarely been discussed in the area of rela-tionship management. To sum up, since education is generally acknowledged to profoundly influence one’s response to IT strategies, specifying the moderating impacts of education can guide ISPs to design different strategies for different customers and consequently achieve high relationship quality and loyalty.
2 Hypothesis development
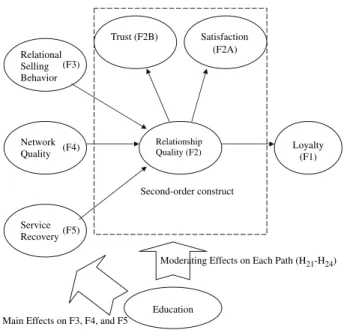
Three conceptual models, displayed in Figs.1–3, are compared so as to generate insights for ISP service. In the models, relational selling behavior, network quality, and service recovery influence loyalty indirectly through the mediation of relationship quality comprising satisfac-tion and trust. These models are drawn from previous research ofLin and Ding(2005,2006). Instead of putting emphasis on respectively gender or prior experience as a moderator in the research byLin and Ding(2005,2006), this study focuses on education having both main effects on antecedents and moderating effects on model paths by comparing three alternative models simultaneously. Through such a comparison across three models from a perspective of education, not only can managerial implications be proposed, but also the most appropriate model for exploring moderating effects in ISP service can be further validated.
Three models are examined using three different approaches respectively. In model 1, relationship quality is examined as a single construct, rather than as a second-order construct comprising satisfaction and trust in model 2. In model 3, satisfaction and trust are examined as two different constructs. The reason why these three approaches are used for comparison is because some previous studies (e.g.,Crosby et al. 1990;Lin and Ding 2006) that contain
Relational Selling Behavior (F3) Network Quality Relationship Quality Loyalty(F1) (F4) (F2) Service Recovery(F5)
Moderating Effects on Each Path (H11-H14)
Education Main Effects on F3, F4, and F5
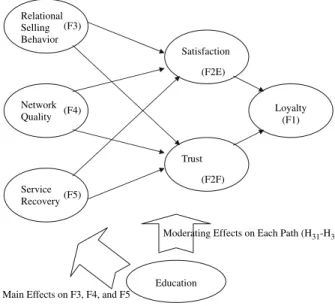
Fig. 1 Model 1 Trust (F2B) Satisfaction (F2A) Relational Selling Behavior (F3) Network Quality Relationship Quality (F2) Loyalty(F1) (F4) Second-order construct Service Recovery(F5)
Moderating Effects on Each Path (H21-H24)
Education Main Effects on F3, F4, and F5
Fig. 2 Model 2
SEM models avoid breaking relationship quality into two dimensions by simultaneously including all the items that define the measurement scales of satisfaction and trust; they con-sider together two dimensions as purely a single construct of first order in SEM models, but this practice of simplification by reducing the number of latent constructs is achieved at the expense of rigor, leaving the relationship quality as an opaque construct to be elucidated. This study comparing three alternative models can help make such an opaque construct transparent and consequently produce managerial implications and insights. The constructs and relationships for the three alternative models are described as follows:
Relational Selling Behavior (F3) Satisfaction (F2E) Network Quality (F4) Loyalty(F1) Trust (F2F) Service Recovery(F5)
Moderating Effects on Each Path (H31-H38)
Education Main Effects on F3, F4, and F5
Fig. 3 Model 3
2.1 Relationship quality
From the perspective of relationship management, relationship quality is considered as an overall assessment of the strength of a relationship (Garbarino and Johnson 1999). Following previous research (Crosby and Stephens 1987;Swan et al. 1985), this study considers that relationship quality is accompanied by satisfaction and trust as in the following descriptions.
2.1.1 Satisfaction
Satisfaction with the relationship is not only regarded as an important outcome of buyer-seller relationships (Lin and Ding 2006;Smith and Barclay 1997), but also an emotional state that occurs in response to an assessment of buyer-seller interaction experiences (Westbrook 1981). Restated, satisfaction can be defined as a customer’s affective state result-ing from an overall appraisal of his or her relationship with an ISP, and it is a cumulative effect over the course of a relationship compared with satisfaction that is specific to each service offered (Anderson et al. 1997). To sum up, increased satisfaction with an ISP brings with it an improved relationship quality.
2.1.2 Trust
The development of trust is considered an important result of investing in dyadic buyer-seller relationships (Wulf et al. 2001). Trust is defined as a willingness to rely on an ISP in whom one has confidence, or the belief that a word or promise of an ISP is reliable and an ISP will fulfill its obligations in the relationship (Schurr and Ozanne 1985;Smith and Barclay 1997). Increased trust with an ISP is often cited as a critical ingredient for determining relationship success and consequently brings on an improved relationship quality with the ISP.
2.2 Loyalty
Empirical evidence has been found for the relationships between the dimensions of rela-tionship quality and customer loyalty to an ISP. Notably, positive paths from relarela-tionship satisfaction to both relationship duration and purchase intentions (Bolton 1998) are indica-tors of customer loyalty to an ISP (Wulf et al. 2001). That is, customers who have received satisfactory services are more likely to show positive behavioral intentions (Zeithaml et al. 1996), leading to increased loyalty to an ISP (Bearden and Teel 1983;Tax and Brown 1998). On the other hand, customers who trust a relationship with a seller would be more likely to behave positively toward the seller due to their need to maintain that trust, consequently leading to stronger customer loyalty.
2.3 Relational selling behavior
Being the nature of the salesperson’s behavioral tendency during customer interactions (Sheth 1975), relational selling behavior is also a behavioral inclination presented by employees to develop and maintain the buyer-seller relationship via effective mutual communications. The influence of such behavior on the buyer-seller relationship depends on customer expectations regarding the role(s) of the staff (Solomon et al. 1985). In this study, relational selling behav-ior of an ISP takes the form of an exogenous construct in the proposed model, because efforts to “establish a good selling relationship” with customers have been discussed as a critical antecedent of relationship maintenance in life insurance (Crosby et al. 1990), wholesale banking (Green Associates 1989), etc.
2.4 Network quality
From the services literature, the perception of stable network quality should boost cus-tomer satisfaction and trust, which reflect a better relationship quality, since increased sta-ble quality for a product should create more favorasta-ble assessments and future behaviors (Swanson and Kelley 2001;Woo and Fock 1999). Some of the dominant models relating to customer satisfaction and trust describe both them as a function of expectations and confir-mation resulting from a comparison between expectation and actual performance perception (Oliver 1980), and ISP network quality is the strongest influence on actual performance and thus on customer perceptions. More specifically, according to the disconfirmation paradigm (Oliver 1980), relationship quality is the outcome of an evaluation process whereby customers compare their expectations of how the network quality is supposed to be supplied with the actual experience with the network quality. Either negative or positive confirmation of expec-tations will keep or change current levels of customers’ satisfaction with and trust on the service provider. The influence of network quality on relationship quality is quite important and logical, since the core service of ISPs is to provide smooth and uninterrupted communi-cations. Consequently, network quality should be the main focus of ISP marketers.
2.5 Service recovery
However Internet quality is driven, ISPs inevitably will need to deal with customer dissatis-faction following service failures. Efforts by ISPs to placate aggrieved customers following an IT service failure are known as service recovery (Boshoff and Allen 2000). Service recov-ery is defined as specific actions taken to ensure that a customer receives a reasonable level of
service following the disruption of normal service (Lewis and Spyrakopoulos 2001). Good service recovery is crucial to customer satisfaction (Lewis and Spyrakopoulos 2001), and can turn angry, frustrated customers into satisfied ones. In fact, good service recovery can create more trust than if things had gone smoothly in the first place (Hart et al. 1990). Additionally, satisfaction with ISP service recovery markedly enhances overall customer satisfaction and willingness to recommend the firm, and indirectly increases loyalty. Conversely, inefficient service recovery will negatively impact customer satisfaction and trust with an ISP. The ser-vice recovery in this study is examined via customers’ subjective perception, which is critical for customers’ decision-making most of time.
2.6 The main effects and moderating effects of education
It is well established that customers’ reports of their attitudes toward IT are influenced by education (Abdul-Gader 1995;Narayan and Krosnick 1996). Specifically, education has been suggested to help shape responses toward IT services (determining, for example, satisfaction and trust), because higher education might make IT knowledge more accessible in memory. Better-educated individuals might be more sensitive to precise IT distinctions that are either superior or inferior. A number of plausible psychological and sociological accounts of var-ious response effects implicate education as a likely moderator (Krosnick 1991;Narayan and Krosnick 1996). Therefore, education strongly affects the response during the loyalty formation as customers with higher education have been posited to have more knowledge of computer and IT, causing normative standards of service, influencing service perceptions towards relational selling behaviors, network quality, and service recovery (main effects). Accordingly, education also moderates the effects of relational selling behaviors, network quality, and service recovery on relationship quality, and of relationship quality on loyalty to an ISP. Consequently, the following hypotheses are given:
Ha: Education significantly influences customer perception on the relational selling behavior of an ISP.
Hb: Education significantly influences customer perception on the network quality of an ISP.
Hc: Education significantly influences customer perception on the service recovery of an ISP.
H11, H21, H31, H32: Education moderates the influence of relationship quality (satisfaction and trust) on loyalty with an ISP.
H12, H22, H33, H34: Education moderates the influence of relational selling behavior on relationship quality (satisfaction and trust) with an ISP.
H13, H23, H35, H36: Education moderates the influence of network quality on relationship quality (satisfaction and trust) with an ISP.
H14, H24, H37, H38: Education moderates the influence of service recovery on relationship quality (satisfaction and trust) with an ISP.
3 Methodology 3.1 Subjects
To empirically test the relationships indicated in the research models, a survey was first conducted for data collection. Subjects were from a large cross-sectional sample of ADSL
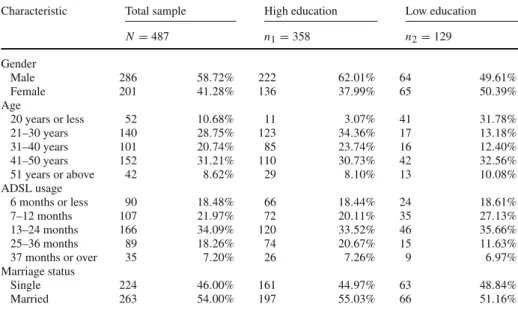
Table 1 Characteristics of the sample
Characteristic Total sample High education Low education
N= 487 n1= 358 n2= 129 Gender Male 286 58.72% 222 62.01% 64 49.61% Female 201 41.28% 136 37.99% 65 50.39% Age 20 years or less 52 10.68% 11 3.07% 41 31.78% 21–30 years 140 28.75% 123 34.36% 17 13.18% 31–40 years 101 20.74% 85 23.74% 16 12.40% 41–50 years 152 31.21% 110 30.73% 42 32.56% 51 years or above 42 8.62% 29 8.10% 13 10.08% ADSL usage 6 months or less 90 18.48% 66 18.44% 24 18.61% 7–12 months 107 21.97% 72 20.11% 35 27.13% 13–24 months 166 34.09% 120 33.52% 46 35.66% 25–36 months 89 18.26% 74 20.67% 15 11.63% 37 months or over 35 7.20% 26 7.26% 9 6.97% Marriage status Single 224 46.00% 161 44.97% 63 48.84% Married 263 54.00% 197 55.03% 66 51.16%
customers of Taiwan’s largest ISP, Chunghwa Telecom. Sampling was conducted in two stages byLin and Ding(2005,2006): first, proportional stratified sampling by area, followed up by systematic sampling from Chunghwa Telecome customer phone numbers. Systematic sampling is appropriate as the phone numbers in the database are neither serial nor acyclic. Eight hundred questionnaires were mailed and a follow-up was performed by telephone. Three hundred and thirty-nine usable questionnaires were obtainedLin and Ding (2005,
2006). To gain more data to facilitate the analysis, four hundred additional questionnaires were mailed and 148 usable ones were received. The t-tests were conducted by comparing the means of the measurement data for the two samples. All tests showed no significant differences on each criteria, suggesting that pooling the subsamples is appropriate. Overall, 487 usable questionnaires were obtained (response rate of 41%), which were representative of the target population by area. The sample include 358 college graduates (forming the high education group) and 129 non-college graduates (forming the low education group). Sample characteristics are displayed in Table1.
3.2 Measures
The constructs of the study herein were measured by applying five-point Likert scales modified from the existing research, and three steps were adopted to choose items to form a scale. Loyalty was measured using seven items modified fromZeithaml et al.(1996); a sample item: I will continue using the service offered by [Name of company]. Two facets of relationship quality were as follows: satisfaction, with three items adapted fromTam and Wong(2001); a sample item: I am satisfied with the service provided by [Name of company]. Trust, with seven items modified fromCrosby et al.(1990); a sample item: [Name of com-pany] is a reliable company. Five items for relational selling behavior were modified from
Crosby et al.(1990); a sample item: my agent offers appropriate information according to my situation. Moreover, network quality with four items was modified from the ideas ofJun and Cai(2001); a sample item: ADSL connection quality is reliable. Finally, service recovery was measured using four items modified fromAndreassen(2000) andBoshoff and Leong
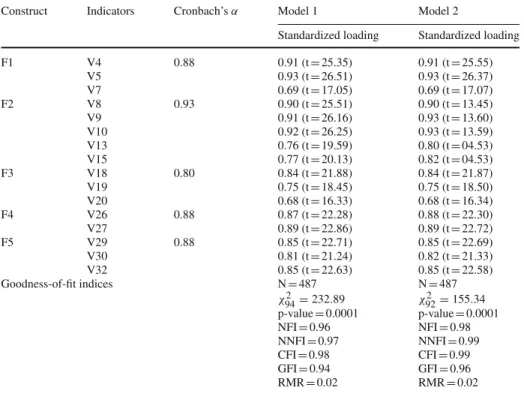
Table 2 Standardized loadings for model 1 and model 2
Construct Indicators Cronbach’sα Model 1 Model 2
Standardized loading Standardized loading
F1 V4 0.88 0.91 (t= 25.35) 0.91 (t= 25.55) V5 0.93 (t= 26.51) 0.93 (t= 26.37) V7 0.69 (t= 17.05) 0.69 (t= 17.07) F2 V8 0.93 0.90 (t= 25.51) 0.90 (t= 13.45) V9 0.91 (t= 26.16) 0.93 (t= 13.60) V10 0.92 (t= 26.25) 0.93 (t= 13.59) V13 0.76 (t= 19.59) 0.80 (t= 04.53) V15 0.77 (t= 20.13) 0.82 (t= 04.53) F3 V18 0.80 0.84 (t= 21.88) 0.84 (t= 21.87) V19 0.75 (t= 18.45) 0.75 (t= 18.50) V20 0.68 (t= 16.33) 0.68 (t= 16.34) F4 V26 0.88 0.87 (t= 22.28) 0.88 (t= 22.30) V27 0.89 (t= 22.86) 0.89 (t= 22.72) F5 V29 0.88 0.85 (t= 22.71) 0.85 (t= 22.69) V30 0.81 (t= 21.24) 0.82 (t= 21.33) V32 0.85 (t= 22.63) 0.85 (t= 22.58) Goodness-of-fit indices N= 487 N= 487 χ2 94= 232.89 χ922 = 155.34 p-value= 0.0001 p-value= 0.0001 NFI= 0.96 NFI= 0.98 NNFI= 0.97 NNFI= 0.99 CFI= 0.98 CFI= 0.99 GFI= 0.94 GFI= 0.96 RMR= 0.02 RMR= 0.02
Notes: F1= Loyalty; F2 = Relationship quality; F3 = Relational selling behavior; F4 = Network quality;
F5= Service recovery
(1998); a sample item: my agent has tried to solve my problems promptly. These items are the same ones from Lin and Ding (2005, 2006).
3.3 Model testing based on total group
Following data collection, data analysis is conducted using SEM, which is a hybrid of factor and path analysis. This study follows a two-step procedure presented byAnderson and Gerbing(1988). The first step involves developing an effective measurement model with confirmatory factor analysis, while the second step analyzes the structural model. SAS and AMOS are adopted as the tools for analyzing the data.
3.3.1 Measurement model testing
In the first step, MI (modification index) is used to choose indicator variables (1986). Through repeated filtering, some indicator variables are removed. The indicators retained in models 1, 2, and 3 are identical. Every construct in the final measurement model is measured using at least two indicator variables as Tables2and3. The overall goodness-of-fit indices, shown in the bottom of Tables2 and3 (RMR smaller than 0.05; NFI, NNFI, CFI, and GFI all greater than 0.9 except for a p-value lower than 0.05), indicate that the fits of the models are satisfactory (Bentler 1989).
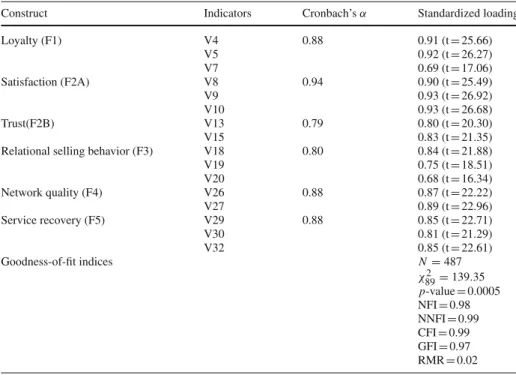
Table 3 Standardized loadings for model 3
Construct Indicators Cronbach’sα Standardized loading
Loyalty (F1) V4 0.88 0.91 (t= 25.66) V5 0.92 (t= 26.27) V7 0.69 (t= 17.06) Satisfaction (F2A) V8 0.94 0.90 (t= 25.49) V9 0.93 (t= 26.92) V10 0.93 (t= 26.68) Trust(F2B) V13 0.79 0.80 (t= 20.30) V15 0.83 (t= 21.35)
Relational selling behavior (F3) V18 0.80 0.84 (t= 21.88)
V19 0.75 (t= 18.51) V20 0.68 (t= 16.34) Network quality (F4) V26 0.88 0.87 (t= 22.22) V27 0.89 (t= 22.96) Service recovery (F5) V29 0.88 0.85 (t= 22.71) V30 0.81 (t= 21.29) V32 0.85 (t= 22.61) Goodness-of-fit indices N= 487 χ2 89= 139.35 p-value= 0.0005 NFI= 0.98 NNFI= 0.99 CFI= 0.99 GFI= 0.97 RMR= 0.02
Reliability can reflect the internal consistency of the indicators measuring a given factor. As shown in Tables2and3, reliabilities for all constructs exceed 0.7 for the models, satisfying the general requirement of reliability for research instruments.
Convergent validity is achieved if different indicators used to measure the same construct obtain strongly-correlated scores. In SEM, convergent validity can be assessed by reviewing the t tests for the factor loadings (Hatcher 1994). Here, in models 1, 2, and 3, all factor load-ings for indicators measuring the same construct are statistically significant (see Tables2
and3), showing that all indicators effectively measure their corresponding construct and support convergent validity.
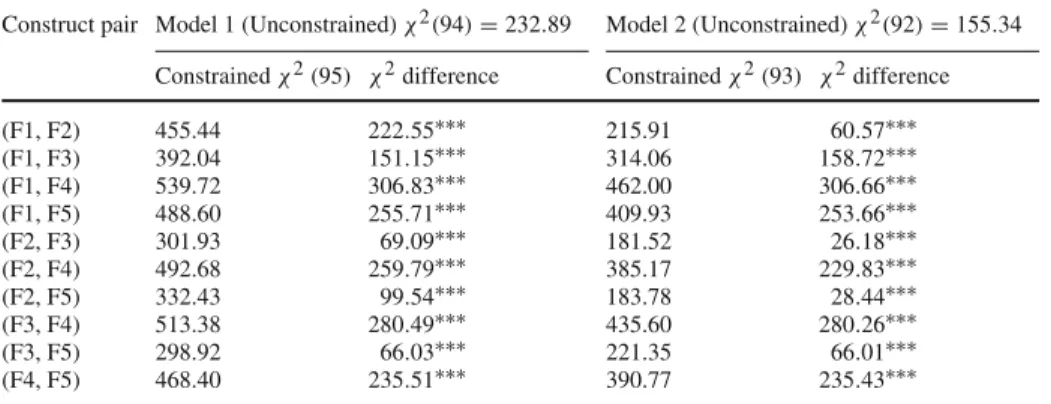
In this study, since we need to test the discriminant validity for every pair of five con-structs, we should control the experimentwise error rate (the overall significance level). By using the Bonferroni method under the overall 0.10, 0.05, and 0.01 levels, the critical values of the chi-square test are, respectively,χ2(1, 0.10/15) = 7.36, χ2(1, 0.05/15) = 8.62, and χ2(1, 0.01/15) = 11.58. Since the chi-square difference statistics in Tables4and5for every two constructs all exceed 11.58 for each model (at the 0.01 level), discriminant validity is successfully achieved.
3.4 Model testing across subgroups
3.4.1 Measurement model testing
For a thorough examination, data analysis for the high education group and low education group separately (by dividing total groups into two subgroups) is conducted using SEM again. The indicators retained in models 1, 2, and 3 across the two groups are identical as
Table 4 Chi-square difference tests for examining discriminant validity
Construct pair Model 1 (Unconstrained)χ2(94) = 232.89 Model 2 (Unconstrained)χ2(92) = 155.34 Constrainedχ2(95) χ2difference Constrainedχ2(93) χ2difference
(F1, F2) 455.44 222.55∗∗∗ 215.91 60.57∗∗∗ (F1, F3) 392.04 151.15∗∗∗ 314.06 158.72∗∗∗ (F1, F4) 539.72 306.83∗∗∗ 462.00 306.66∗∗∗ (F1, F5) 488.60 255.71∗∗∗ 409.93 253.66∗∗∗ (F2, F3) 301.93 69.09∗∗∗ 181.52 26.18∗∗∗ (F2, F4) 492.68 259.79∗∗∗ 385.17 229.83∗∗∗ (F2, F5) 332.43 99.54∗∗∗ 183.78 28.44∗∗∗ (F3, F4) 513.38 280.49∗∗∗ 435.60 280.26∗∗∗ (F3, F5) 298.92 66.03∗∗∗ 221.35 66.01∗∗∗ (F4, F5) 468.40 235.51∗∗∗ 390.77 235.43∗∗∗
Note: F1 = Loyalty; F2 = Relationship quality; F3 = Relational selling behavior; F4 = Network quality;
F5 = Service recovery
*** Significant at the 0.01 overall significance level by using the Bonferroni method
Table 5 Chi-square difference
tests for examining discriminant validity
Note: F1 = Loyalty;
F2A = Satisfaction; F2B = Trust; F3 = Relational selling behavior; F4 = Network quality; F5 = Service recovery
*** Significant at the 0.01 overall significance level by using the Bonferroni method
Construct pair Model 3 (unconstrained) :χ2(df = 89) = 139.35 Constrainedχ2(df = 90) χ2difference (F1, F2A) 413.94 274.59∗∗∗ (F1, F2B) 169.88 30.53∗∗∗ (F1, F3) 297.94 158.59∗∗∗ (F1, F4) 446.19 306.84∗∗∗ (F1, F5) 393.87 254.52∗∗∗ (F2A, F2B) 170.96 31.61∗∗∗ (F2A, F3) 226.61 127.26∗∗∗ (F2A, F4) 399.87 260.52∗∗∗ (F2A, F5) 259.64 120.29∗∗∗ (F2B, F3) 164.91 25.56∗∗∗ (F2B, F4) 295.13 155.78∗∗∗ (F2B, F5) 174.64 35.29∗∗∗ (F3, F4) 419.97 280.62∗∗∗ (F3, F5) 205.31 69.96∗∗∗ (F4, F5) 375.00 235.65∗∗∗
with the previous analysis based on total sample. The overall goodness-of-fit indices for each subgroup (RMR smaller than 0.05; NFI, NNFI, CFI, and GFI all greater than 0.9) are satis-factory to the fits of the models (Bentler 1989). In models 1, 2, and 3 across two subgroups, all factor loadings for indicators measuring the same construct are statistically significant, indicating that all indicators effectively measure their corresponding construct and support convergent validity. Meanwhile, the results for discriminant validity is also acceptable.
3.4.2 Latent mean testing
Based on the above measurement model, latent mean testing is conducted as in the following steps (Byrne 2001): (1) Variance of the three exogenous constructs are freely estimated in each group, as are the covariances among them. (2) Means of the error terms are not esti-mated and remain constrained to zero. Variances of the error terms are freely estiesti-mated in each group. (3) Except for those fixed to 1.00, all factor loadings are constrained to be equal
Table 6 Latent mean differences across two groups (for examining the main effects of education)
Construct Estimate SE t value
Relational selling behavior (F3) 0.354 0.087 4.05
Network quality (F4) 0.246 0.096 2.56
Service recovery (F5) 0.328 0.091 3.62
Note: The results obtained for models 1, 2, and 3 are identical
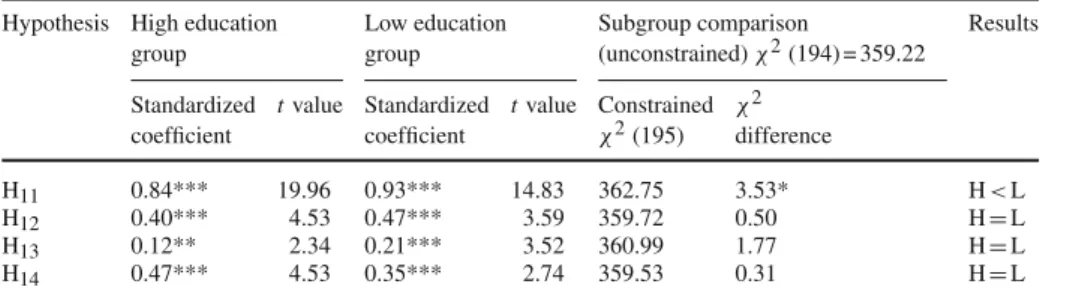
Table 7 Path coefficients and t value based on model 1
Hypothesis High education Low education Subgroup comparison Results group group (unconstrained)χ2(194) = 359.22
Standardized t value Standardized t value Constrained χ2 coefficient coefficient χ2(195) difference
H11 0.84*** 19.96 0.93*** 14.83 362.75 3.53* H< L
H12 0.40*** 4.53 0.47*** 3.59 359.72 0.50 H= L
H13 0.12** 2.34 0.21*** 3.52 360.99 1.77 H= L
H14 0.47*** 4.53 0.35*** 2.74 359.53 0.31 H= L
Note: H= High education group; L= Low education group
* p< 0.10; ** p < 0.05; *** p < 0.01
across groups. (4) All intercepts for the observed measures are constrained to be equal across groups. (5) The three factor means are freely estimated for the low education group, but are constrained equal to zero for the high education group. The latter group is therefore regarded as the “reference” group.
Table6reports the results of latent mean testing for examining the main effects of edu-cation. Given that the high education group is designated as the reference group and, as such, their factor means are fixed to zero, the values reported here represent the latent mean difference between the two subgroups. It is found in Table6that the significantly positive estimates of the latent mean difference across the subgroups for all three exogenous con-structs indicate that the perceptions about relational selling behavior, network quality, and service recovery are significantly higher for the low education group than for those of the high education group.
3.4.3 Analysis for structural model and moderating effects
Following the first step, the second step analyzing the structural models is performed next. Tables8–10list the test results for structural models. To test moderating effects, this study uses the analytical strategy ofSingh(1995) to examine the existence of the moderating effect on the structural model by using a subgroup analysis. First, an “unconstrained” model is estimated, in which path coefficients are allowed to vary across the cross-group datasets. Next, a “partially-constrained” model is estimated by requiring that only the target path coef-ficients are constrained to be equal for cross-group datasets. Comparing the goodness-of-fit statistics for the “unconstrained” and “partially-constrained” models using anχ2difference test yields evidence to examine our hypotheses. The test results for the subgroup analysis are also presented in Tables7–9, respectively.
Table 8 Path coefficients and t value based on model 2
Hypothesis High education Low education Subgroup comparison Results group group (unconstrained)χ2(190) = 290.26
Standardized t value Standardized t value Constrained χ2 coefficient coefficient χ2(191) difference
H21 0.86*** 8.14 0.94*** 4.26 292.21 1.95 H= L
H22 0.45*** 4.31 0.47*** 2.94 290.37 0.11 H= L
H23 0.13** 2.40 0.20*** 3.00 291.26 1.00 H= L
H24 0.44*** 3.97 0.37*** 2.77 290.31 0.05 H= L
Note: H= High education group; L= Low education group
*** p< 0.01
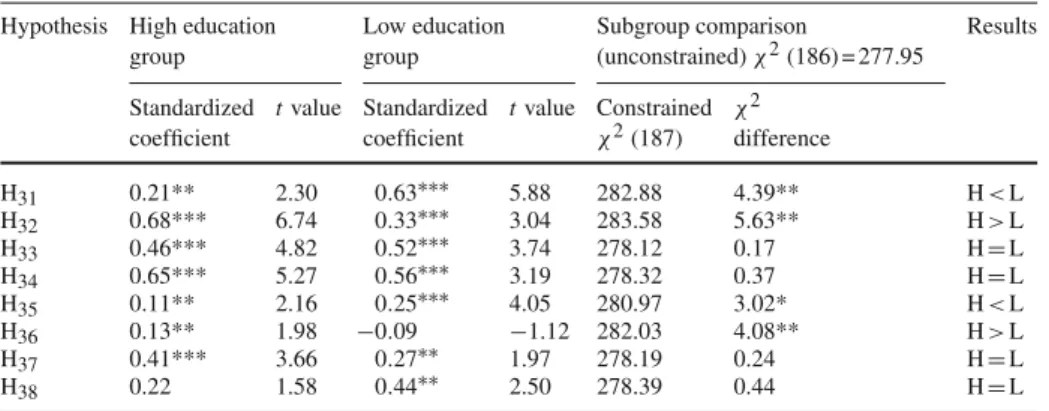
Table 9 Path coefficients and t value based on model 3
Hypothesis High education Low education Subgroup comparison Results group group (unconstrained)χ2(186) = 277.95
Standardized t value Standardized t value Constrained χ2 coefficient coefficient χ2(187) difference
H31 0.21** 2.30 0.63∗∗∗ 5.88 282.88 4.39** H< L H32 0.68*** 6.74 0.33∗∗∗ 3.04 283.58 5.63** H> L H33 0.46*** 4.82 0.52∗∗∗ 3.74 278.12 0.17 H= L H34 0.65*** 5.27 0.56∗∗∗ 3.19 278.32 0.37 H= L H35 0.11** 2.16 0.25∗∗∗ 4.05 280.97 3.02* H< L H36 0.13** 1.98 −0.09 −1.12 282.03 4.08** H> L H37 0.41*** 3.66 0.27∗∗ 1.97 278.19 0.24 H= L H38 0.22 1.58 0.44∗∗ 2.50 278.39 0.44 H= L
Note: H= High education group; L= Low education group
* p< 0.10; ** p < 0.05; *** p < 0.01
Table 10 Analysis of indirect effects in model 3
Group Path Indirect effects through Total effects
Satisfaction Trust High Edu. F3→ F1 0.097 (18%) 0.442 (82%) 0.539 Low Edu. F3→ F1 0.328 (64%) 0.185 (36%) 0.513 High Edu. F4→ F1 0.023 (21%) 0.088 (79%) 0.111 Low Edu. F4→ F1 0.158 (123%) −0.030 (−23%) 0.128 High Edu. F5→ F1 0.086 (36%) 0.150 (64%) 0.236 Low Edu. F5→ F1 0.170 (54%) 0.145 (46%) 0.315
Note: F1= Loyalty, F3 = Relational selling behavior, F4 = Network quality, F5 = Service recovery
4 Results
Latent mean testing in Table6indicates that means for the three exogenous constructs are all higher for the low education group than for the high education group (Ha, Hb, and Hcare supported).
Based on the subgroup analysis in Table7, a moderating effect between relationship qual-ity and loyalty is confirmed to exist (H11is supported) while the remaining paths are not (H12, H13, and H14are not supported). In Table8none of the moderating effects are confirmed to
exist (H21, H22, H23, and H24are not supported). In Table9the influences of satisfaction and trust on loyalty and of network quality on satisfaction and trust are confirmed to be moder-ate by education (H31, H32, H35, and H36are supported) while the remaining paths are not (H33, H34, H37, and H38are not supported). Inconsistent results among models 1, 2, and 3 do arise from construct simplification or synergy as previously mentioned. In other words, the accurate moderating effects cannot be found in models 1 and 2, which is the cost of sim-plification. Based on model 3, the test results of a subgroup comparison is exhibited in Table
9, leading to a more effective practice in IT management. In summary, the decomposition in model 3 helps provide more insights for both academic and practical fields and therefore will be further discussed for managerial implications in the next section.
Based on the test results in Table9, another analysis for indirect effects is presented in Table10. First, based on the high education group, the decomposition indicates that the mediated effect of relational selling behavior on loyalty through trust (82%) is substantially stronger than that through satisfaction (18%). At the same time, the mediated effect of network quality on loyalty through trust (79%) is substantially stronger than that through satisfaction (21%). Furthermore, the mediated effect of service recovery on loyalty through trust (64%) is substantially stronger than that through satisfaction (36%). Second, based on the low educa-tion group, the decomposieduca-tion indicates that the mediated effect of relaeduca-tional selling behavior on loyalty through satisfaction (64%) is substantially stronger than that through trust (36%). The mediated effect of network quality on loyalty is purely through satisfaction (123%) rather than trust (−23%), implying that satisfaction is the key consideration with respect to network quality, from the perspective of the low education customers. Lastly, the mediated effect of service recovery on loyalty through satisfaction (54%) is substantially similar than that through trust (46%).
5 Discussion and managerial implications
This study suggests that relational selling behavior, network quality, and service recovery are influential in determining relationship quality and loyalty, while education is assessed to be a moderator for several model paths. One implication of these results for managers is that, whatever trouble ISPs take to increase relationship quality and loyalty, the effects of their efforts remain subject to the influence of customer education.
The significant difference for the means of three exogenous constructs across the sub-groups brings about a critical practice for frontline staff. The significant higher means of all three exogenous constructs for the low education group than for the high education group indicate that customers with a lower education background may perceive relational selling behavior, network quality, and service recovery less strictly and give a higher evaluation compared to that of the high education group. This unique finding is very helpful for time management to frontline staff. Since time is a limited resource for staff, it must be well planned in order to produce the maximum and positive customer perceptions related to the three exogenous factors, and consequently achieve the highest level of relationship quality and loyalty. Specifically, frontline staff should schedule more frequently their visits or mutual communication in person or through the Internet to the high education group than to the low education group. Giving a different weight for service hours across subgroups can establish maximum relationship quality and achieve total loyalty management.
The influences of relational selling behavior and service recovery on satisfaction and trust being similar for the high and low education groups indicate that relational selling behav-ior and service recovery to relationship quality are not education specific. The phenomenon
implies that relational selling behavior and service recovery are the common success factors, regardless of the customers’ education. Clearly, ISPs should be aware that they are in a poten-tially vulnerable situation if they are unwilling to invest in strategic planning and training regarding service recovery and relational selling contexts. From the perspective of service recovery, ISPs should make customers their first priority for service, even when service failures happen during non-office hours. Service recovery in an ISP service is different from other industries and must be available around the o’clock, and frontline staff should always be on duty to perform such a recovery.
From the perspective of relational selling, a focus on developing stable, rather than merely temporary, relationships with customers is necessary to enable ISPs to capture a larger portion of business. Conceivably, ISPs that are complacent about general short-term selling practices rather than long-term relational selling contexts may in fact lose ground to other competitors. This suggestion supports the use of IT management tactics to enhance the perceptions of cus-tomers regarding their relationships with firms, particularly by personifying the firm through developing closer customer-agent relationships (Iacobucci and Ostrom 1996). Since more time is required to perform better relational selling to customers, relational selling behaviors of frontline staff should be rewarded to incentivize these staff to serve customers even when they stand to gain in no other way.
The influence of network quality on satisfaction and of satisfaction on loyalty is alterna-tively stronger for the low education group than the high education group, implying that the low education group displays more sensitivity to satisfaction rather than to trust. Such a sig-nificant difference between both groups may result from the phenomenon that low education customers with higher IT alienation (Abdul-Gader 1995) may consequently generate a higher level of loyalty as soon as IT satisfaction is achieved. Conversely, the influence of satisfaction on loyalty is weaker for the high education group than the low education group since the high education group is familiar with and accustomed to the function of the network service and are less impressed with network quality from the perspective of satisfaction. Alternatively, the influence of network quality on trust and of trust on loyalty is stronger for the higher education group than the lower education group, indicating that trust is the main concern for the high education group. The high education group mostly has higher IT knowledge and expects higher stability in the network and requires trustworthiness of network quality, because they know well about the serious crisis and consequence in case an unstable network breaks down.
The above differences between subgroups have important implications for ISPs, which should attempt to increase their appeal to customers in their efforts to stimulate loyalty. These differences suggest that surveys on network quality are critical to ISPs in understanding their customer perceptions; internal data are not adequate enough to understand the views of cus-tomers in this area. Furthermore, since the high education group has a higher normative anticipation about network quality than the low education group, poor network performance would significantly damage their trust and loyalty. To maintain good network quality and win the high education group’s trust, ISPs should upgrade their infrastructure and implement network management devices to maintain smooth network traffic flow. The main weakness of network management solutions is that they address problems only after they arise, by which time service already has suffered. Hence, software or hardware with more advanced and predictive techniques should be applied so as to prevent technical difficulties or traffic overloading. In case high education customers have no confidence on network quality, the firm should assign highly-experienced technical staff to work on the problem. Experienced technical staff not only are likely to be able to fix the problem, but also can easily answer any professional questions from the high education group.
Network quality being also important for the low education group influences loyalty through satisfaction more in comparison to that of the high education group. The low edu-cation group has more IT alienation (Abdul-Gader 1995) and may evaluate network quality superficially mostly through advertising or reputation broadcasted by others. This phenome-non suggests that an advertising strategy for the low education group should avoid complicat-ing the situation by discusscomplicat-ing the professional issues of network quality in any advertiscomplicat-ing. Instead, properly presenting market reputation or other customers evaluations about net-work quality can easily achieve high loyalty from the low education group. Once those low education customers perceiving low satisfaction for network quality are identified, more senior staff with better communication skills should visit them immediately to help them understand the problem and strengthen their satisfaction regarding network quality via per-suading promotion. More senior staff are usually more convincing to customers and have more authority to give some type of compensation for the low education group and conse-quently cause a better impression about network quality. Online learning programs designed specifically for the low education group can enhance their IT awareness and reduce their alienating feelings and hence increase their satisfaction and loyalty.
6 Conclusions
ISPs today invest greatly in advertising campaigns, which represent critical methods of suc-cessfully transferring information and service to users. However, managers should be careful not to try partnering initiatives with all customers without regard to their customers’ edu-cation. Rather, they may emphasize more technical issues of network stability for the high education group, while offering the low education group a general market analysis from the perspective of reputation and other customers’ word-of-mouth about network quality. Furthermore, since different customers interpret the same words differently, staff commu-nication techniques are also important. In fact, frontline staff need to listen and respond to individual problems. Since frontline staff who are better able to communicate with their customers will easily have better relationships with those customers. They should thus be taught the importance of displaying empathy or concern for users during service recovery or selling and must avoid complacent attitudes and a lack of understanding (Durvasula et al. 2000). ISPs must utilize diverse approaches across subgroups to maintain relationship quality and strengthen loyalty in the long term. Simply applying a single approach to all custom-ers without considering customer education is both inadequate and inefficient. Specialized training for understanding the influence of education on the relationships between loyalty and relationship quality and their antecedents may be required to help staff promote good relationship quality and loyalty. Service providers may find it useful to examine how more effective education-based market segmentation strategies can associate network quality with relationship quality and loyalty.
This study suffers from some limitations that relate to data collection and interpretation of results. First, respondents only described their relationship with one supplier, and therefore it is hard to get a sense of whether or not the relationships they describe are typical of all of the relationships they have with other product suppliers in different industries. Future research can consider including a wide variety of types of suppliers represented in the sample. The second issue is the cross-sectional design employed. Longitudinal studies support stronger inferences. Therefore, the model developed and validated herein could benefit from being tested with a longitudinal design. Researchers can take note of these shortcomings in planning future research work.
Acknowledgments This work was supported partially by National Science Council, Republic of China. The authors wish to thank Kang Chuang Chen of Chunghwa Telecom, Taiwan, for providing the data.
References
Abdul-Gader, A.H.: The impact of computer alienation on information technology investment decisions: an exploratory cross-national analysis. MIS Q. 19(4), 535–559 (1995)
Anderson, E.W., Fornell, C., Rust, R.T.: Customer satisfaction, productivity, and profitability: differences between goods and services. Mark. Sci. 16(2), 129–145 (1997)
Anderson, J.C., Gerbing, D.W.: Structural equation modeling in practice: a review and recommended two-step approach. Psychol. Bull. 103(3), 411–423 (1988)
Andreassen, T.W.: Antecedents to satisfaction with service recovery. Eur. J. Mark. 34(1/2), 156–175 (2000) Bearden, W.O., Teel, J.E.: Selected determinants of consumer satisfaction and complaint reports. J. Mark.
Res. 20(1), 21–28 (1983)
Bentler, P.M.: EQS Structural Equations Program Manual. BMDP Statistical Software, Los Angeles (1989) Bolton, R.N.: A dynamic model of the duration of the customer’s relationship with a continuous service
provider: the role of satisfaction. Mark. Sci. 17(1), 45–65 (1998)
Boshoff, C., Allen, J.: The influence of selected antecedents on frontline staff’s perceptions of service recovery performance. Int. J. Serv. Ind. Manage. 11(1), 63–90 (2000)
Boshoff, C., Leong, J.: Empowerment, attribution, and apologising as dimensions of service recovery: an experimental study. Int. J. Serv. Ind. Manage. 9(1), 24–47 (1998)
Byrne, B.M.: Structural equation modeling with AMOS: basic concepts, applications, and programming. Lawrence Erlbaum Associates, New Jersey (2001)
Cole, D.A., Maxwell, S.E., Arvey, R., Salas, E.: Multivariate group comparisons of variable systems: MANOVA and structural equation modeling. Psychol. Bull. 114(1), 174–184 (1993)
Crosby, L.A., Evans, K.R., Cowles, D.: Relationship quality in services selling: an interpersonal influence perspective. J. Mark. 54(3), 68–81 (1990)
Crosby, L.A., Stephens, N.: Effects of relationship marketing on satisfaction, retention, and prices in the life insurance industry. J. Mark. Res. 24(4), 404–411 (1987)
Dick, A.S., Basu, K.: Customer loyalty: toward an integrated conceptual framework. J. Acad. Mark. Sci. 22(2), 99–113 (1994)
Durvasula, S., Lysonski, S., Mehta, S.C.: Business-to-business marketing service recovery and customer satisfaction issues with ocean shipping lines. Eur. J. Mark. 34(3/4), 433–452 (2000)
Garbarino, E., Johnson, M.S.: The different roles of satisfaction, trust, and commitment in customer relation-ships. J. Mark. 63(2), 70–87 (1999)
Greenwich Associates. Large Corporate Banking Survey. Greenwich, CT (1987)
Hart, C.W.L., Heskett, J.L., Sasser, W.E.: The profitable art of service recovery. Harvard Busi. Rev. 68(4), 148– 156 (1990)
Hatcher, L.: A Step-by-step Approach to Using the SAS System for Factor Analysis and Structural Equation Modeling. SAS Institute Inc., Cary (1994)
Iacobucci, D., Ostrom, A.: Commercial and interpersonal relationships: using the structure of interper-sonal relationships to understand individual-to-individual, individual-to-firm, and firm-to-firm relation-ships. Int. J. Res. Mark. 13(1), 53–72 (1996)
Jun, M., Cai, S.: The key determinants of internet banking service quality: a content analysis. Int. J. Bank Mark. 19(7), 276–291 (2001)
Krosnick, J.A.: Response strategies for coping with the cognitive demands of attitude measures in surveys. Appl. Cogn. Psychol. 5, 213–236 (1991)
Lewis, B.R., Spyrakopoulos, S.: Service failures and recovery in retail banking: the customers’ perspective. Int. J. Bank Mark. 19(1), 37–48 (2001)
Lin, C.P., Ding, C.G.: Opening the black box: assessing the mediating mechanism of relationship quality and the moderating effects of prior experience in ISP service. Int. J. Serv. Ind. Manage. 16, 55–80 (2005) Lin, C.P., Ding, C.G.: Evaluating the group differences in gender during the formation of relationship quality
and loyalty in ISP service. J. Organ. End User Comput. 18, 38–62 (2006)
Narayan, S., Krosnick, J.A.: Education moderates some response effects in attitude measurement. Public Opin. Q. 60, 58–88 (1996)
Oliver, R.L.: A cognitive model of the antecedents and consequences of satisfaction decisions. J. Mark. Res. 17(4), 460–469 (1980)
Schurr, P.H., Ozanne, J.L.: Influence on exchange processes: buyers’ preconceptions of a sellers trustworthi-ness and bargaining toughtrustworthi-ness. J. Consum. Res. 11(4), 939–953 (1985)
Sharp, B., Sharp, A.: Loyalty programs and their impact on repeat-purchase loyalty patterns. Int. J. Res. Mark. 14(5), 473–486 (1997)
Sheth, J.N.: Buyer-seller interaction: a conceptual framework. In: Anderson, B.B. (ed.) Advances in Consumer Research, vol. 3., pp. 382–386. Association for Consumer Research, Cincinnati (1975)
Singh, J.: Measurement issues in cross-national research. J. Int. Busi. Stud. 26(3), 597–619 (1995) Smith, J.B., Barclay, D.W.: The effects of organizational differences and trust on the effectiveness of selling
partner relationships. J. Mark. 61(1), 3–21 (1997)
Solomon, M.R., Surprenant, C., Czepiel, J.A., Gutman, E.G.: A role theory perspective on dyadic interactions: the service encounter. J. Mark. 49(1), 99–111 (1985)
Swan, J.E., Trawick, I.F., Silva, D.W.: How industrial salespeople gain customer trust. Ind. Mark. Manage. 14(3), 203–211 (1985)
Swanson, S., Kelley, S.W.: Attributions and outcomes of the service recovery process. J. Mark. Theory Pract. 9(4), 50–65 (2001)
Tam, J.L.M., Wong, Y.H.: Interactive selling: a dynamic framework for services. J. Serv. Mark. 15(5), 379–396 (2001)
Tax, S.S., Brown, S.W.: Recovering and learning from service failure. Sloan Manage. Rev. 40(1), 75–88 (1998) Westbrook, R.A.: Sources of consumer satisfaction with retail outlets. J. Retail. 57(3), 68–85 (1981) Woo, K.S., Fock, H.K.Y.: Customer satisfaction in the Hong Kong mobile phone industry. Serv. Ind.
J. 19(3), 162–174 (1999)
Wulf, K.D., Odekerken-Schröder, G., Lacobucci, D.: Investments in consumer relationships: a cross country, cross-industry exploration. J. Mark. 65(4), 33–50 (2001)
Zeithaml, V.A., Berry, L.L., Parasuraman, A.: The behavioral consequences of service quality. J. Mark. 60(2), 31–46 (1996)