NeuroImage, in press, 2003
ICA-based spatiotemporal approach for single-trial analysis of post-movement MEG beta synchronization
Po-Lei Lee, Ph.D.*, Yu-Te Wu, Ph.D.*,†, Li-Fen Chen, Ph.D.*,‡, Yong-Sheng Chen, Ph.D.*, Chou-Ming Cheng, B.S.*, Tzu-Chen Yeh, MD, Ph.D.*,§, Low-Tone Ho, M.D.*,§, Mau-Song Chang, M.D.*,§, Jen-Chuen Hsieh, M.D., Ph.D.*,§,#,¶
* Laboratory of Integrated Brain Research, Department of Medical Research &
Education, Taipei Veterans General Hospital, Taipei, Taiwan
† Institute of Radiological Sciences, National Yang-Ming University, Taipei, Taiwan
‡ Center for Neuroscience, National Yang-Ming University, Taipei, Taiwan
§ Faculty of Medicine, School of Medicine, National Yang-Ming University, Taipei, Taiwan
# Institute of Neuroscience, School of Life Science, National Yang-Ming University, Taipei, Taiwan
Running Title: ICA-spatiotemporal approach for MEG beta oscillatory activity Remark: The authors are affiliated with Brain Research Center, University System of Taiwan.
Corresponding author (¶):
Jen-Chuen Hsieh, M.D., Ph.D.
Professor and Director
Laboratory of Integrated Brain Research
Department of Medical Research and Education Taipei Veterans General Hospital
No.201, Sect.2, Shih-Pai Rd.
Taipei 112, Taiwan
Email: [email protected] Tel: +886-2-28757480
Fax: +886-2-28745182
Abstract
The extraction of event-related oscillatory neuromagnetic activities from single-trial measurement is challenging due to the non-phase-locked nature and variability from trial to trial. The present study presents a method based on independent component analysis (ICA) and the use of a template-based correlation approach to extract Rolandic beta rhythm from magnetoencephalographic (MEG) measurements of right finger lifting.
A single trial recording was decomposed into a set of coupled temporal independent components and corresponding spatial maps using ICA and the reactive beta frequency band for each trial identified using a two-spectrum comparison between the post-movement interval and a reference period. Task-related components survived dual criteria of high correlation with both the temporal and spatial templates with an acceptance rate of about 80%. Phase and amplitude information for noise-free MEG beta activities were preserved not only for optimal calculation of beta rebound (event-related synchronization) but also for profound penetration into subtle dynamics across trials. Given the high signal-to-noise ratio (SNR) of this method, various methods of source estimation were used on reconstructed single-trial data and the source loci coherently anchored in the vicinity of the primary motor area. This method promises the possibility of a window into the intricate brain dynamics of motor control mechanisms and the cortical pathophysiology of movement disorder on a trial-by-trial basis.
Keywords: Rolandic rhythm, motor cortex, single-trial, magnetoencephalography, event-related synchronization, independent component analysis (ICA)
INTRODUCTION
The human brain is a dynamic system that frequently changes functional mode (Lopes da Silva, 1991; Lopes da Silva, 1996). Spatiotemporal analysis of brain activities with regard to distinct spatial locations and frequency bands reveals task-specific brain activation which changes in a fraction of a second (Jensen and Vanni, 2002). At rest, Rolandic EEG and MEG rhythms are dominated by rhythmic activity around 10 (alpha band) and 20 (beta band) Hz. Electrocorticographic (Pfurtscheller et al., 1994) and neuromagnetic recordings have shown that the ~20-Hz rhythm mainly originates in the anterior bank of the central sulcus while the ~10-Hz rhythm is concentrated predominantly in the post-central cortex (Pfurtscheller and Lopes da Silva, 1999). These two frequency components appear to have different functional roles, with the ~20-Hz rhythm being more closely connected to movements and their termination and the
~10-Hz component behaving more like a classical “idling” rhythm (Salmelin et al., 1995). Voluntary movement is composed of three phases: planning, execution and recovery (Pfurtscheller et al., 1998a). It has been suggested that localized event-related alpha desynchronization (ERD) upon movement can be viewed as an EEG/MEG correlate of an activated cortical sensorimotor network, servicing planning and execution, while beta event-related synchronization (ERS) may reflect deactivation/inhibition during the recovery phase in the underlying cortical network (Pfurtscheller et al., 1996).
Movement-related ERD and ERS have been used as probes to study neurophysiology in normal brains and pathophysiology in the diseased (Tamas et al., 2003). It has been reported that the diagnostic features of patients with Parkinson’s disease, in comparison with controls, are a slowing and suppression of the post-movement beta ERS
independent of the amount of beta activity in the reference period (Pfurtscheller et al., 1998a). These findings imply that slowed and reduced recovery after the motor act impedes cortical preparation of the next movement (Pfurtscheller et al., 1996). Patients with Unverricht-Lundborg type myoclonic epilepsy demonstrate little rebound of beta activities contingent upon median nerve stimulation (Silen et al., 2000). The diminished beta ERS indicates that the myoclonic patients have sustained motor cortex reactivity which can be attributed to impaired cortical inhibition (Pfurtscheller and Lopes da Silva, 1999).
ERD and ERS activities are time-locked, but not phase-locked, to external stimuli or tasks (Andrew and Pfurtscheller, 1995; Kalcher and Pfurtscheller, 1995; Pfurtscheller and Lopes da Silva, 1999). Existing methods for extraction of ERD/ERS signals essentially measure power or amplitude changes of corresponding frequency bands as derived from the average of dozens or hundreds of trials. The band power method squares and averages filtered brain signals within a selected frequency band (Pfurtscheller and Aranibar, 1977), and an inter-trial variance method to remove the phase-locked portion in the band power method was reported by Klimesch et al. (1998).
Likewise, autoregressive and spectral decomposition methods have been used to extract significant frequency components in rhythmic signals (Florian and Pfurtscheller, 1995).
Salmelin's temporal-spectral evolution method rectifies and averages filtered MEG signals (Salmelin et al., 1995). To increase the temporal resolution of the ERD/ERS technique, Clochon et al. (1996) proposed an amplitude modulation (AM) method based on the Hilbert transform to detect the envelope of filtered signals by squaring and summing their real and imaginary parts. All these approaches presume stereotypical frequency and temporal characteristics across trials and require an average of many trials for the ERD/ERS using a preset frequency filter and time window to preprocess every trial. However, non-phase-locked rhythmic signals can vary from trial-to-trial
contingent upon variations in a subject’s performance and state, which may be linked to fluctuations in expectation, attention, arousal, and task strategy (Bastiaansen et al., 2001;
Bastiaansen et al., 1999; Earle, 1988; Haig et al., 1995; Hoffman et al., 1991; Yabe et al., 1993). Since trial-to-trial variability in amplitude, latencies, or scalp distribution might carry important information on cognitive and physiological states (Jung et al., 2001), a method that permits the extraction and analysis of the oscillatory signal on a single-trial base is crucial for the study of subtle brain dynamics. Furthermore, such a method should require fewer trials for analysis and hence shorter experiment time, which is beneficial for patients with impairment of motor and/or cognitive performance (Muller-Gerking et al., 1999).
Single-trial multi-channel EEG analysis has been developed for time-locked, phase-locked, evoked brain activities (Jung et al., 2001; Tang et al., 2002). However, approaches to single-trial movement-related oscillatory changes are less explored. ICA, a data-driven method for multivariate data analysis, has been used to reveal temporally-independent neuronal activities of EEG measurements (Jung et al., 2001;
Makeig et al, 1997; McKeown et al., 1998), MEG measurements (Wu et al., 2002; Wu et al., 2003; Tang et al., 2002), fMRI (Duann et al., 2002; McKeown et al., 1998) and recently perfusion MRI (Kao et al., 2003). The present study proposes a new approach using ICA and the Hilbert transformation for the single-trial detection of movement-related beta rhythmic activity during a self-paced right finger lifting task.
This study focuses on beta activity and beta ERS, centered around 20 Hz, because it has been demonstrated that the movement-related short bursts of beta oscillation have higher task and movement specificity than alpha ERD (Pfurtscheller and Aranibar, 1979b; Pfurtscheller et al., 1996).
Since brain oscillation may be expressed alone in a specific frequency band independent of artifacts (Ermer et al., 2000; Lins et al., 1993a; Lins et al., 1993b;
Mosher et al., 1992), ICA is applied to transform brain signals across all channels (in a single trial) into mutually independent components by means of an unmixing matrix in which each column represents a spatial map tailoring the weights of the corresponding temporal component at each MEG sensor. The spatial maps and temporal waveforms of decomposed independent components are categorized into task-related and task-unrelated groups respectively, based on temporal and spatial characteristics. This temporal template is the grand average of hundreds of vector-norm envelopes of the band-pass filtered, single-trial MEG measurements obtained from right index finger lifting. The spatial template can be derived from the spatial distribution at beta rebound activity either from the grand average of the generation group (for signal extraction) or from each individual (for verification). Correlations between the temporal template and component waveforms, as well as between the spatial template and spatial maps, are computed, and coupled component waveforms and spatial maps that conjointly survive with high correlation values are taken as task-related information and subjected to data reconstruction. In this way the phase and amplitude information of noise-free MEG beta activities can be preserved for profound studies of temporal and spectral variation across trials. Due to the high SNR in beta activities extracted through ICA, trial-specific reactive frequency ranges can be determined by means of the comparisons of two short time spectra between the reference and post-movement periods. Beta reactivity per single trial can be quantified using the amplitude modulation (AM) method (Clochon et al., 1996), and significant epochs can be determined using a nonparametric sign test (Brovelli et al., 2002). Source estimation and localization techniques can be successfully applied to single-trial epoch to estimate the source locations of beta modulation.
The current study presents: 1) a novel ICA-based spatiotemporal approach for single-trial analysis of event-related beta oscillatory modulations with a high extraction
rate; 2) the prospect of trial-specific frequency bandpass filtering that takes into account subtle trial-by-trial brain dynamics; 3) the feasibility of using sophisticated source estimation/localization methods demanding high SNR on single trial data; and 4) a common template approach permitting an effective alternative in cases where lengthy procedures cannot be endured by participants or in clinical settings where patients have attention problems or are incapable of sustaining long experiments.
MATERIALS AND METHOD
Subjects and task
The present study examined six healthy right-handed subjects (gender balanced), aged 24-30 years. Five subjects were used in the model generation group, and MEG data from the last subject were used for validation. Subjects performed self-paced lifting of the right index finger approximately once every 8 sec. Subjects were trained to perform the movement briskly for a duration of 200 to 300 ms, as monitored by surface electromyogram (EMG) on extensor digitorum communis, with a range of finger movement around 35~40°, while keeping their eyes open in order to suppress the occipital alpha rhythm. In addition, somatosensory evoked fields (SEFs) for right median nerve stimulation were measured to locate the primary sensorimotor area (SMI) in each subject as part of the procedure for the generation of a temporal template (see below).
Data recording
Cortical magnetic signals were recorded with a 306-channel (102 sensor unit) whole-head neuromagnetometer (band-pass, 0.05-250 Hz; digitized at 1kHz;
Vectorview; Neuromag Ltd., Helsinki, Finland) with subjects in sitting position. Each
sensor unit was composed of a pair of planar gradiometers and a magnetometer. The magnetometer measured magnetic flux ( ), normal to the sensor unit, while the gradiometers measured two tangential derivatives of (
Bz
Bz ∂ /Bz ∂xand , mutually orthogonal). Only magnetic signals measured by the gradiometers were used in this study. Bipolar horizontal and vertical electro-oculograms (EOG) were recorded using electrodes placed below and above the left eye and at the bilateral outer canthi to monitor eye movement and blinks. The exact position of the head with respect to the sensor array was determined by measuring magnetic signals from four head position indicator (HPI) coils placed on the scalp. Coil positions were identified with a three-dimensional digitizer with respect to three predetermined landmarks (naison and bilateral preauricular points) on the scalp, and this data used to superimpose MEG source signals on individual MRI images obtained with a 3.0 T Bruker MedSpec S300 system (Bruker, Kalsrube, Germany). The anatomical image was acquired using a high-resolution T1-weighted, 3D gradient-echo pulse sequence (MDEFT: Modified Driven Equilibrium Fourier Transform; TR/TE/TI= 88.1ms/4.12ms/650ms, 128*128*128 matrix, FOV=250mm).
y Bz ∂
∂ /
Empty room measurements were recorded for 3 minutes. Approximately 100 EOG-free trials of right index finger lifting were acquired and analyzed off-line. Since the focus was on beta-activities, the signals were further band-pass-filtered between 6-50 Hz (zero-phase, tenth-order, IIR Butterworth filter) to remove dc drifts and 60 Hz noise. The initial finger movement (movement onset; zero time) was registered with an optical switch (Taniguchi et al., 2000). Electromyographic (EMG) activity from the extensor digitorum communis (digitized at 1 KHz) was continuously recorded to monitor performance (see above). Each epoch comprised data points from –4s to 3s relative to the movement onset (Salmelin et al., 1995; Salmelin and Hari, 1994a) and epochs were subjected to further single-trial ICA analysis.
For SEF measurement, the right median nerve was electrically stimulated every 2 sec with constant current pulses (0.3 msec in duration) exceeding the motor threshold.
Approximately 100 EOG-free trials were acquired and digitized at 1 kHz and stored on magneto-optic disks for off-line analysis.
Data analysis
Independent Component Analysis of the single-trial MEG epoch
We take the advantages of sensitivity and localizing power of superficial sources by planar gradiometers (Rosell et al., 2001; Kajola et al., 1991). Each single-trial MEG epoch contains m channels (m = 204, 102 pairs of gradiometers) and n time points (usually m < n). The paired gradiometer signals (∂ /Bz ∂xand ∂ /Bz ∂y) are arranged into two m ×n
2
≤
sub-matrices B1 and B2 and concatenated into an matrix B. The i
n m×
th rows (i 102) of B1 and B2 contain the measured gradiometer signals from the ith sensor location, and the jth column in B contains the measured data at the jth time point across all gradiometer channels. Mathematically, we can consider each row of B as samples generated from one random variable bi,i = 1, 2, …, m. In other words, matrix B is a realization of a random vector b=[b1b2 Lbm]T.
The ICA techniques (Jung et al., 2001; Hyvarinen et al., 2001) seek to find a m
p× (p≤ ) matrix, W, which converts the random vector b into another vector m variable, s, consisting of p mutually independent random variables, thus:
1 2
1
1
. . .
×
×
× =
= p m m
p
p b
s s s
W
s (1)
The mutual independence of si, for i = 1,…, p, implies that if P(si) represents the probability distribution of the ith component, the joint probability distribution for all components can be factorized as:
) (2) ( )...
( ) ( ) ,..., ,
(s1 s2 sp P s1 P s2 P sp
P =
The ICA techniques use this assumption of mutual independence to find the un-mixing matrix W.
All calculations in the present study were carried out using the FastICA algorithm which features high speed calculation (cubic convergence) and does not require selection of step size parameters or learning rate, unlike the gradient-based algorithm (Hyvarinen et al., 1997, 2001). The FastICA technique first removes means of row vectors in the B sample matrix such that each random variable bi has a zero mean, and then employs a whitening process using principal component analysis. After whitening, the covariance matrix of the whitened data becomes an identity matrix, and only the first p (p≤ ) most significant principal components are preserved in the FastICA calculation.
m
The next step is to look for a matrix that transforms the whitened data into a set of components as mutually independent as possible. Mutual information, as a measure of the independence of random variables, is used as the criterion for finding such a transformation. Mutual information can be expressed in terms of negentropy, an important measure of non-Gaussianity (Hyvarinen et al., 1997, 2001). Therefore, the problem of finding the independent components (s) and the transform matrix (W) can be translated into a search for linear combinations of the whitened data that maximize the negentropy of the distributions of si, for i = 1,…, p.
After applying FastICA to the pre-processed single-trial MEG epochs, matrix B can
be factored into a (mixing) matrix U and an (independent source) matrix S as follows:
pxn 2 1
mxp , 1
,
, 2 1 1
, 2 1
2, 1
2,
, 1 1
, 1
pxn mxp mxn
=
=
=
→
→
→
+ +
p p
m m
m p m
mp m
p
s s s
u u
u u
u u
u u
M
L M M
L L
M M
L S U B
2 1
B B
(3)
in which each row of matrix represents samples of an independent component (IC) s
→
si S∈ℜp×n
ℜ
∈
i,, for i = 1,…, p and U is the pseudo-inverse of matrix W whose column vectors represent the weight distribution values of the corresponding ICs in S across all MEG gradiometer channels. In fact, matrix U is the “mixing matrix” that combines the p ICs to reconstruct signal B. These temporal ICs can be categorized into task-related ICs and task-unrelated ICs. Since the elicited brain activities or artifacts can be distributed over multiple ICs, no one-to-one correspondence between IC and source information is projected (Makeig et al., 1997). To facilitate the selection of task-related ICs, a temporal and spatial template pair was constructed prior to selection (see below).
Spatial map of the j
m×p
xvj th IC was defined as the topographic display of all vector norms for weights of 102 gradiometer pairs in the jth column vector of U,
T
+ + +
= + +
2 , 2 2, 2
), 2 2 ( 2 , 2 2 ), 2 1 ( 2 ,
1j m j j m j m j m j
j u u u u u u
xv L (4)
in which is the entry in the ith row and jth column of U in Eq. (3). The spatial map is intended for component selection (see below).
j
ui,
Creation of a temporal template (VAMWtemplate) using amplitude modulation (envelope) of the MEG data
The recorded MEG signals at each gradiometer are filtered in the task-specific frequency band (Pfurtscheller and Lopes da Silva, 1999) and rectified by computing the AM waveform (envelope) using the amplitude modulation (AM) method (Clochon et al., 1996) as follows:
2
2 ( ( ))
) ( )
(t M t H M t
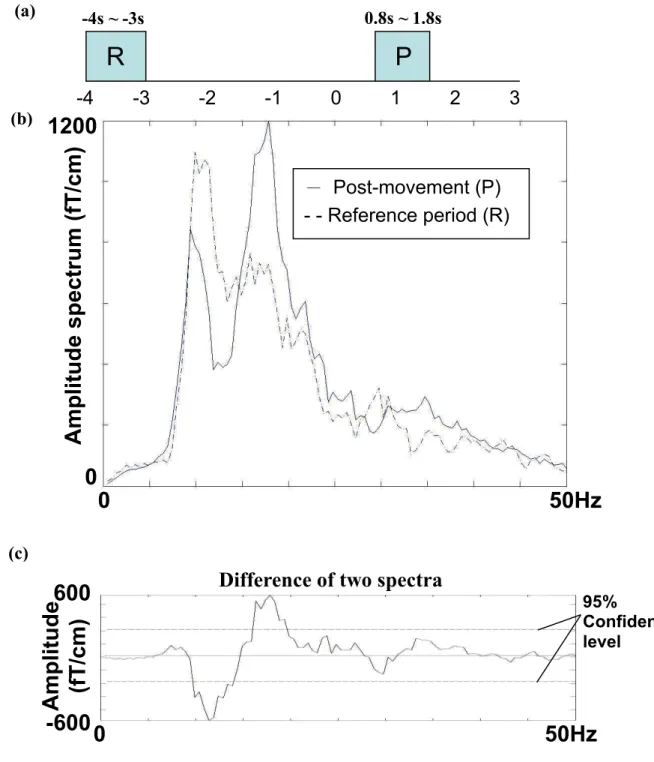
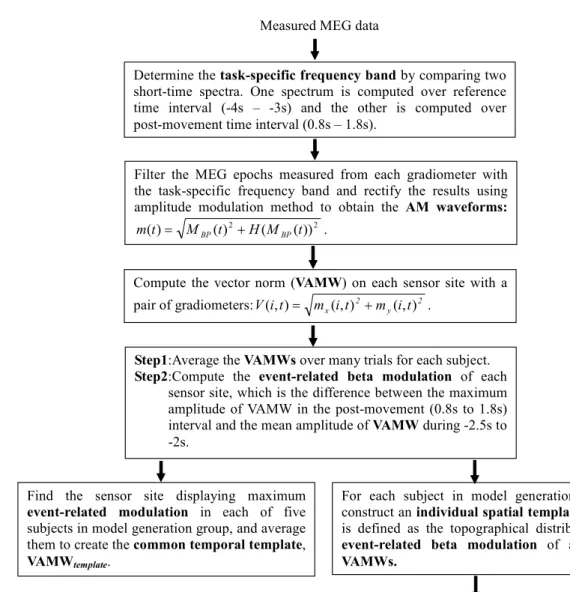
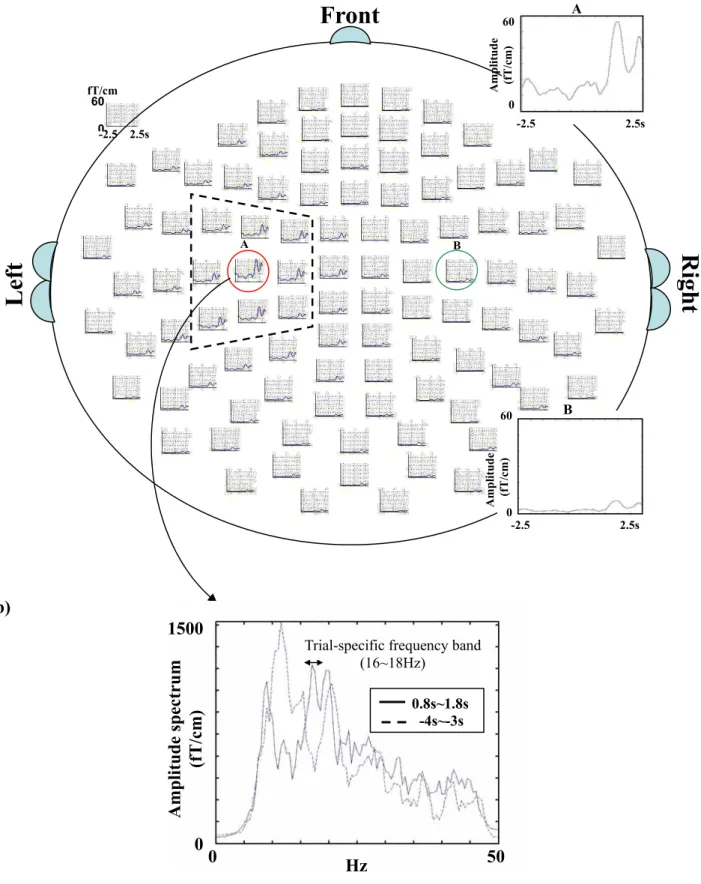
m = BP + BP (5) in which is the band-passed MEG signal and is its Hilbert transform. The task-specific frequency band is determined by the contrast between two 1-s amplitude spectra calculated over about one hundred event-related EEG trials (Pfurtscheller and Lopes da Silva, 1999). One (serving as rest reference) is computed over the duration from 4s to 3s preceding the onset of movement, and the other (serving as reactive target) from 0.8s to 1.8s after the onset of movement (see Fig. 1a, b). All beta-frequency components with significant modulation in terms of post-movement amplitude increase (above 95% confidence level, i.e. Z>3.09, P<0.01) in the differential amplitude spectrum (see Fig. 1c) are taken as the task-specific frequency band for subsequent processing (Pfurtscheller G. and Berghold A., 1989).
) (t
MBP H(MBP(t))
---Insert Figure 1 here----
The vector norm of AM waveforms (VAMW) at each sensor site is computed using the square root of the AM waveforms of each gradiometer pair, i.e.,
2 y 2
x i t m i t
m t
i
V( , )= (, ) + (, ) , in which V( ti, ) is the VAMW at the ith sensor location,
and and mx( ti, ) my(i,t) are the AM waveforms in x Bz
∂
∂ and y Bz
∂
∂ directions of the
ith sensor location. Event-related beta modulation is then computed as the difference in amplitude between the maximum amplitude of VAMW for each sensor site in the post-movement (0.8s to 1.8s) interval and mean activity between -2.5s and -2s (see Fig.
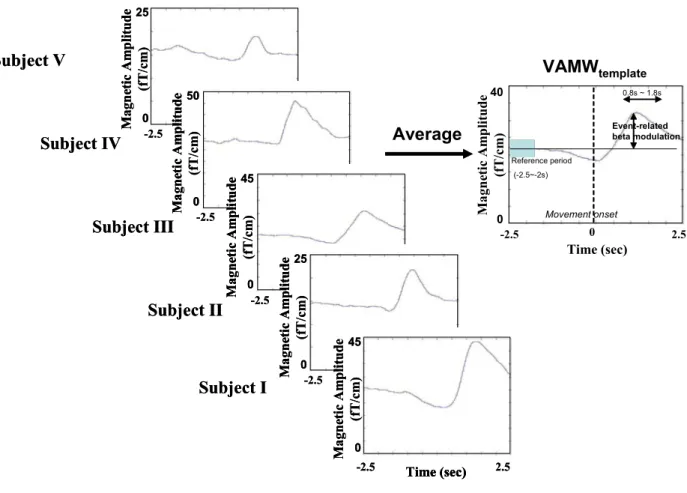
2a) (Leocani et al., 1997). Beta rebound (BR) is defined as the maximum amplitude of the computed event-related beta modulation from the subset of nine sensor sites in the vicinity of SMI (identified by SEF). The VAMWs of the BR calculation were averaged across the subjects (500 trials, 100 trials for each subject, 5 subjects pooled) to create the common temporal template, designated VAMWtemplate (Fig. 2a).
Creation of a spatial template using topographical distribution of event-related beta modulation values
Individual spatial templates were first generated from the topographical distributions of event-related beta modulation values (see above). The five templates from the model generation group were then averaged to generate a common spatial template. In order to optimize conditions for spatial averaging, subjects’ heads were carefully positioned before actual measurements to keep head positioning and orientation as similar as possible. Distances between head centers of the five subjects and the reference point (the origin of the MEG sensor array) in the horizontal plane were less than 4mm, and angles between the vertical axis of the helmet and that of the head (the normal vector of the plane constituted by the three landmark points, i.e., nasion, and both pre-auricular points) remained within 5.5° (maximum deviation 1.5°) between subjects. Only the left half of the spatial map (unshaded in Fig. 2b) was used as the spatial template because this study focused on beta event-related activities in the hemisphere contralateral to the side of finger lifting; however, the other half can be generated analogously to extract
activities in the ipsilateral hemisphere. Correlations among individual spatial templates ranged from 0.92 to 0.68. Respective correlations between the common spatial template and the individual spatial templates were 0.973, 0.811, 0.881, 0.904, and 0.915. These high correlation values support the use of the spatial template in component selection for each individual’s magnetic signals.
---Insert Figure 2 here----
Selection of pertinent independent components for the reconstruction of reactive beta activities
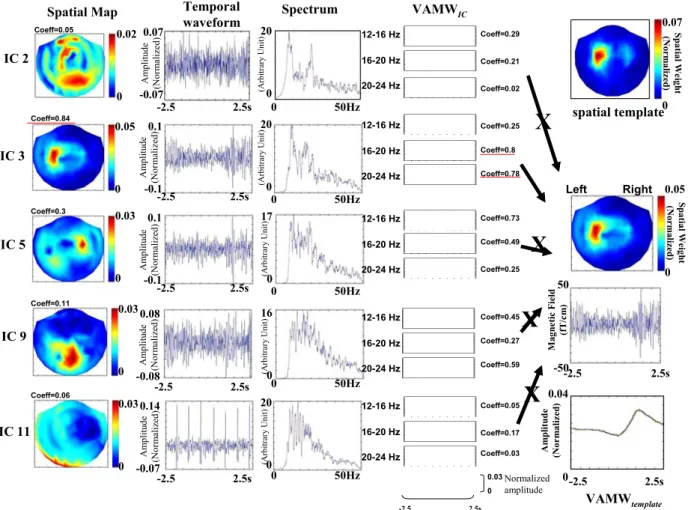
A spatial map (Eq. (4)) and corresponding VAMWs of each IC were generated for the selection of task-related ICs. Since the original signals may be decomposed into multiple ICs, the spectrum of each IC may vary from the one in the original signal due to the decomposition process. When settings for band-pass filtering for VAMW computation cannot be optimally determined using two-spectrum comparison for the generation of a VAMWtemplate (Pfurtscheller and Lopes da Silva, 1999), three standard beta bands, 12-16, 16-20 and 20-24 Hz (Pfurtscheller G., 1981), enclosing the event-related beta activities in motor task, were used to band-pass filter (zero-phase, tenth-order, IIR Butterworth filter) for each single-trial IC such that the three frequency-laden resultant VAMWICs (the VAMWs band-pass filtered in three frequency bands of each IC) retained all task-related information. These VAMWICs were subsequently used in the selection of task-related ICs, which must fulfill the following dual criteria: 1) at least one of three corresponding VAMWICs has a correlation with the VAMWtemplate higher than 95% (Z>1.63, P<0.05) among VAMWICs of all the ICs for that single epoch, and 2) correlation between the spatial map and spatial template is above 95% (Z>1.63, P<0.05) for the spatial maps of all ICs. Data processed via
3-standard band filtering are not used in subsequent data reconstruction, but rather are used in conjunction with the dual-criteria only in the procedure “selecting” the pertinent ICs. Unselected columns, i.e., task-unrelated components, of mixing matrix U (Eq. (3)) are zeroed to produce a matrix such that task-related rhythmic signals are reconstructed by multiplying and S (Fig. 3). The reconstructed data in each trial are then filtered within a trial-specific frequency band to extract reactive beta activities.
Uˆ Uˆ
----Insert Figure 3 here----
Detection of task-laden trial-specific frequency band and extraction of reactive beta activities
The trial-specific frequency band detected in each trial is used to confine the reconstructed data within the most reactive beta band for further BR computation and source estimation. This frequency band is defined by the reactive beta band of the sensor site showing highest event-related beta modulation value (see creation of temporal template) over the nine SMI vicinal sensor sites (identified by SEF) and is identified using the aforementioned two-spectrum procedure which has been suggested as the best approach for the determination of reactive frequencies (Pfurtscheller and Lopes da Silva, 1999). Following data filtering with a trial-specific frequency band (zero-phase, tenth-order, IIR Butterworth filter), reactive beta activities in each single epoch can be extracted. The extracted reactive beta activities are then subjected to source estimation and beta rebound (BR) computations.
Calculation of VAMWrecon of reactive beta activities and single-trial epoch selection using a nonparametric sign test
Movement-related beta rebound (BR) can be quantified from single-epoch reactive
beta activities and VAMWrecon (VAMW of reconstructed data) for reactive beta activity at each sensor site computed. The VAMWrecon of highest event-related beta modulation (see creation of temporal template) among the nine sensor sites vicinal to SMI is designated as VAMWrecon_max and is used in turn for single-trial epoch selection and BR computation, as the sensor site expressing VAMWrecon_max did not change throughout the experiment in our observations. A deterministic procedure, modified from Brovelli's et al. (2002) approach, is used to select the significant trial. A nonparametric sign test is applied to the VAMWrecon_max designated for BR calculation in each single trial by
computing the Z-score at each time point as )
2 /(1 2 ) ) 1 ( ( )
(t N t N N
Z = + − , in which
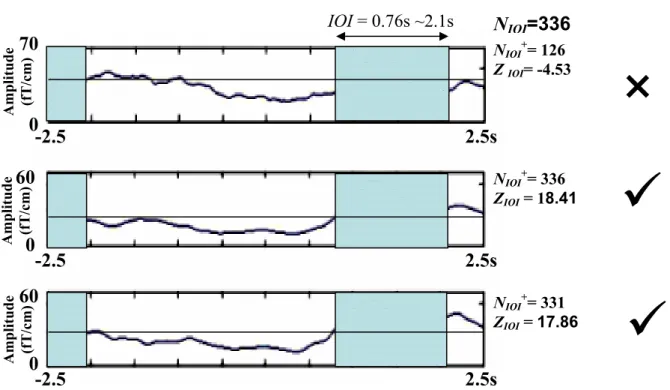
denotes the number of trials whose magnitudes are larger than the median value of their baseline activities at time point t, and N the total number of trials. Time points with Z values greater than 3.09 (P<0.01) are defined as the time interval-of-interest (IOI). After the determination of IOI for each subject, another sign test is then applied to find epochs showing significant increases in amplitude (Z>1.63, P<0.05) using
) (t N+
2 ) /(1 2 )
) 1 (
(NIOI i − NIOI NIOI
= +
) (i NIOI+ )
IOI(i
Z , in which is the Z value of the i
trial, is the number of data points in post-movement IOI with values larger
than the median of baseline activities of the trial, and is the total number of time points in post-movement IOI (Brovelli et al., 2002). An example of single-trial epoch selection is given in Fig. 4 (Subject I). The first trial in Fig. 4 with a Z
) (i
ZIOI th
ith NIOI
IOI score equal to -4.53 is marked as an insignificant epoch and eliminated from further analysis.
----Insert Figure 4 here----
Source estimation of the reactive beta activities
Source estimation of the MEG reactive beta activities was done using equivalent current dipole (ECD) analysis and minimum current estimation (MCE, Uutela et al., 1999; toolbox provided by Neuromag Ltd, Helsinki, Finland). A single dipole model was applied to explain the field every 1ms, and only dipoles showing goodness-of-fit (Jensen and Vanni, 2002) values higher than 80% were used for data explanation. In MCE, the lattice constant of the triangular grid was 10mm and locations closer than 30mm to the center of the conductor were excluded from current estimates. Both analyses used a realistic head model for each subject. Template generation and single-trial data processing procedure are schematized in Figs. 5a and 5b respectively.
Epochs achieving significance in the increase of beta activities were chosen for subsequent BR calculation and dipole/source analysis.
----Insert Figure 5 here----
Validation of coupled common spatial and temporal templates for single-trial analysis Since there are inevitably differences in head size and variations in head positions inside the MEG scanner among subjects, BR amplitude differences were compared using both individual spatial templates and the common spatial template. The use of a pair of common spatial and temporal templates for the extraction of individuals’
neuromagnetic single-trial signals was further validated on one additional subject.
RESULTS
Due to space constraints, some results are illustrated using data from one subject.
However, similar findings were observed in all subjects. Based on the known spatial location and temporal expression in terms of spatial and temporal templates, reactive
beta activities were successfully extracted. Figure 3a shows that IC 3 meets the dual criteria: i) the correlation values between spatial map and spatial template is 0.84 (rank=
97%, Z= 1.89, P=0.03); ii) correlation values of 16-20Hz VAMWIC and 20-24 Hz VAMWIC vs. VAMWtemplate are 0.8 (rank= 99%, Z=3.08, P=0.01) and 0.78 (rank= 97.8%, Z= 2.85, P=0.022), respectively. Fig. 3a illustrates that noise could also be identified and removed. IC 2 in Fig. 3a correlates highly (=0.88) in spatial distribution with the IC1 extracted from empty room measurements (Fig. 3b), and is therefore rejected.
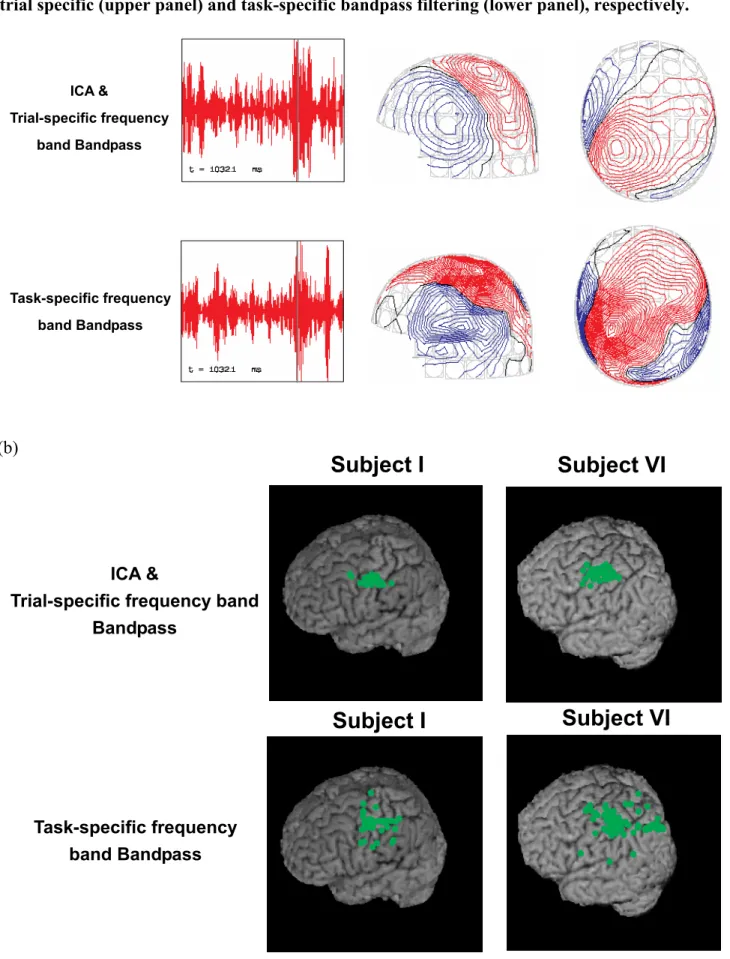
Figure 6a depicts the single-trial VAMWrecons of subject I filtered within the trial-specific frequency band (Fig. 6b). The conventional AM method on the average of 100 epochs reveals a bilateral post-movement rebound pattern with contralateral (left hemisphere) dominance, whereas the current ICA-based single-trial analysis (one hemisphere template) yields only activation (one trial) in the left hemisphere (Fig. 6a and 6c).
----Insert Figure 6 here----
Epoch acceptance rates were 84% (65/78), 89% (83/91), 71% (60/85), 73% (68/93), and 87% (76/87), respectively for the model generation group and 81% (71/88) for the validation subject; the average for all six was 80.8%. The IOIs of significance were 0.76s - 2.1s, 0.66s - 1.5s, 0.8s - 1.75s, 0.46s - 1.49s, and 0.71s – 1.28s for the five subjects in the model generation group, and 0.88s – 1.67s for the validation subject.
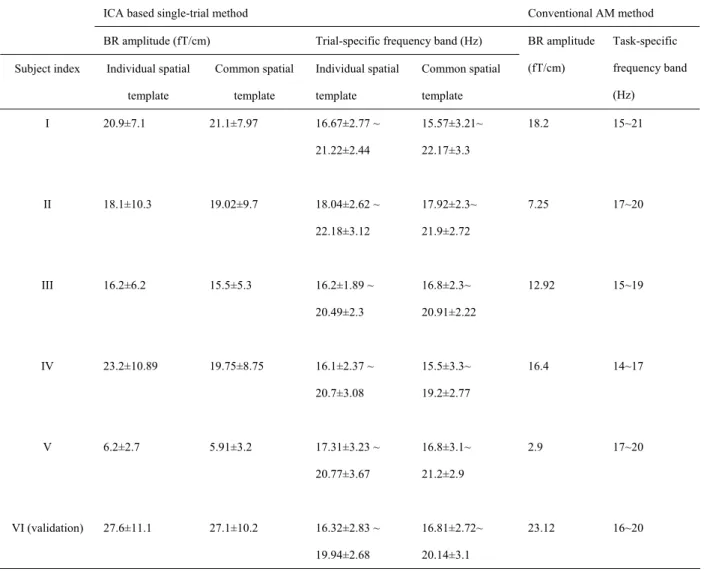
Averaged magnitude of BR was calculated from the reconstructed data on trials that survived the epoch-selection procedure. The BR amplitudes computed from individual spatial templates were 20.9±7.1 (mean±sd), 18.1±10.3, 16.2±6.2, 23.2±10.89, and 6.2±2.7 for the first 5 subjects, respectively, and 27.6±11.1 fT/cm for the 6th subject (Table I). Using the common spatial template, BR amplitudes were 21.1±7.97,
19.02±9.7, 15.5±5.3, 19.75±8.75, 5.91±3.2, and 27.1±10.2 fT/cm, respectively (Table I).
There was no significant difference between the results obtained with two approaches (p=0.88; unpaired two-tailed t test). BR amplitudes obtained with the conventional method of averaging on 100 trials were 18.2, 7.254, 12.92, 16.4, 2.9, and 23.12 fT/cm, respectively. Means for single-trial ICA-derived BRs, using either individual or common spatial templates, were significantly higher than those obtained using the conventional method of averaging (p<0.005; Matched-pair Wilcoxon test; Table I). The comparisons of BR amplitude and task-specific frequency band between ICA-based single-trial and conventional methods are given in Table I.
----Insert Figure 7 and Table 1 here----
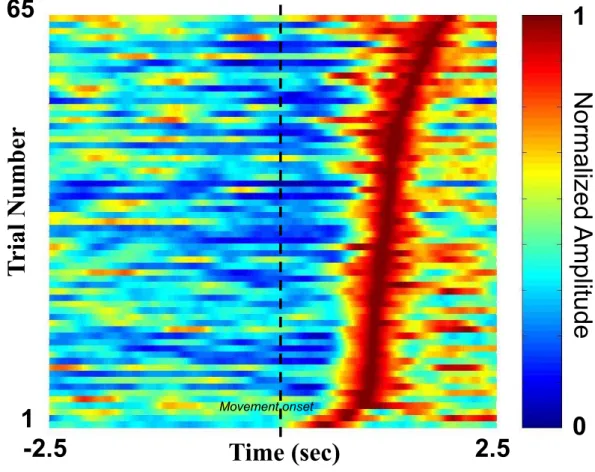
The ICA-based single-trial approach shows remarkable latency jittering and inter-trial variability throughout the whole measurement process. Both factors can result in attenuation and smearing of averaged movement-related MEG responses. Figure 7a shows the raster plot of sixty-five normalized single-trial VAMWrecon_maxs which survived the selection procedure for subject I, sorted by VAMWrecon_max peak latency as indexed to movement onset. The mean latency of peak beta rebound for the 65 trials was 1.41±0.43 s (mean±sd). With more epochs (random selection) averaged as with the conventional method of averaging, the averaged BR was attenuated (25.3, 24.6, 22.3, 21.5, 20.3 and 21.1 fT/cm for 1, 15, 25, 35, 45 and 65 trials averaged, respectively;
values taken from the averaged VAMWrecon_maxs using common spatial template) and the time-activity plots smeared (Fig. 7b).
----Insert Figure 7 here----
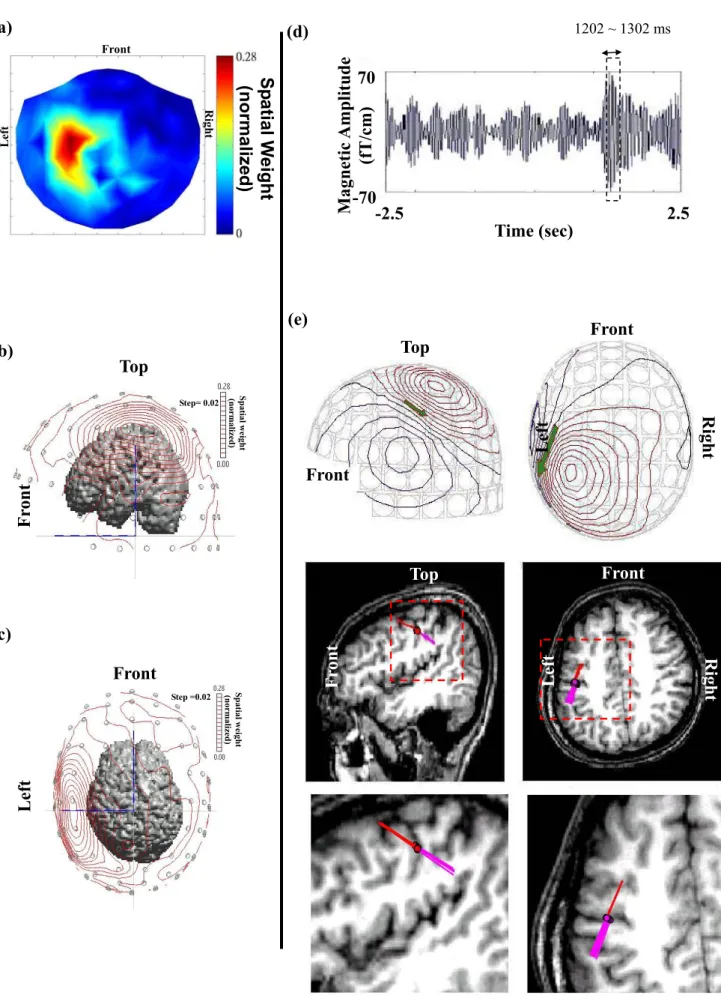
Source estimation using ECD and MCE both showed a cluster of current sources centered (mean coordinates) in the anterior bank of the central sulcus (see Fig. 8e and 8f) on data points around the rebound peak of extracted reactive beta activities (see Fig. 8d, time interval between 1202ms – 1302ms of one single epoch of subject I). The ECD-located dipoles oscillate and span a sector. Furthermore, the center of MCE-estimated current sources (yellow dots) lies less than 2mm from the center of ECD-estimated dipoles (red dots) (see Fig. 8F). These results cross-verify the validity of the ICA-based single-trial method.
----Insert Figure 8 here----
DISCUSSION
The movement-related oscillatory modulations (ERD/ERS of alpha, beta and gamma) have been reported to be spatially extended (Babiloni et al., 1999; Crone et al., 1998a;
Crone et al., 1998b; Leocani et al., 1997; Neuper and Pfurtscheller, 2001; Salmelin and Hari, 1994a; Taniguchi et al., 2000; van Burik et al., 1998). Source localizations using conventional filtering have also been reported to disperse among several regions (Salmelin and Hari, 1994a). However, our results strongly indicate that proper treatment when trial-by-trial dynamics can be accounted for yields clustered localizations congruent to neuroanatomical representations.
---- Insert Figure 9 here ---
The present ICA-based spatiotemporal approach for single-trial analysis study is dedicated to the extraction of neuromagnetic measurements of event-related beta oscillatory activities. One distinct feature of the current ICA-based method as compared with other single-trial approaches (Guger et al., 2000; Ioannides et al., 1993; Jung et al., 2001) is the simultaneous use of a spatial template and a temporal template for component selection. The spatial template provides a priori spatial information for brain signals, while the temporal template contains temporal characteristics of event-related responses. Using the paired criteria for component selection, identification specificity of task-related components for signal reconstruction is significantly improved. As shown in Fig. 3c, the inclusion of IC 9 with high spatial correlation (correlation value=0.61, rank= 95.2%, Z=1.67, P=0.048) but devoid of temporal congruence (correlation value
=0.28, rank=13%, Z=0.34, P=0.87) causes beta BR to deteriorate from 28.9 fT/cm (red curve) to 18.6 fT/cm (blue curve). The ICA-preprocessed dataset yields cleaner field
maps (Fig. 9-a), which result in circumscribed localizations (Fig. 9-b; c.f., Salmelin and Hari, 1994a).
Significantly, the current method also makes possible the analysis of the reactive frequency band for every single trial once task-related rhythmic activities are extracted.
The conventional method discounts this subtle but potentially important information.
Notwithstanding, the idea of using a fixed window for signal filtering is neurophysiologically not optimal. We emphasize the precise identification of reactive trial-specific frequencies for BR calculation, since task-related frequency modulation might exist in one or multiple bands (Pfurtscheller and Lopes da Silva, 1999). The three-standard frequency band procedure is used for generation of VAMWICs to recover all possible task-related information and is followed by a two short-time spectra comparison procedure (Pfurtscheller and Lopes da Silva, 1999) for the identification of the optimal reactive trial-specific frequency band in the reconstructed epochs. The present approach not only extracts the specific reactive frequencies but also retains phase information on a trial-by-trial basis. The trial-specific frequency band of post-movement beta modulation anchors mainly (~85% of all trials) in the lower beta band (16Hz~20Hz) and less frequently (~15%) in the higher beta band (20~24Hz).
Great variation of BR values is also seen, as reflected in large SD (Table I). The revealed trial-by-trial dynamics provide a possibility for future profound study of subtle brain dynamics.
It is noteworthy that not all the data reconstructed from the selected ICs survives the statistical threshold. We have carefully monitored online and thoroughly checked offline the EMG measurements in terms of EMG onset (p=0.61, unpaired two-tailed t- test), termination (p=0.53, unpaired two-tailed t-test) and the EMG duration (p=0.573, unpaired two-tailed t-test) during finger lifting between significant and insignificant trials as indexed to the movement registration by the optic pad (Abbink et al., 1998).
The data indicate an absence of prominent behavioral difference commensurate to the differential neuromagnetic responses. Some epochs with a fluctuating baseline, e.g., non-task-related spontaneous bursts of beta oscillatory activities, may manifest high baseline activity, which in turn results in a decrease in BR readout leading to exclusion after statistical manipulation (Fig 4). It has been suggested that baseline spontaneous activities may carry important information relevant to attention level, wakefulness, task difficulty, etc. (Buser and Rougeul-Buser, 1999; Sterman, 1999). The jittering of the neuromagnetic beta ERS is likewise interesting and may be also physiological. A zero-phase Butterworth filter was used to bandpass filter the raw data. The symmetric property of the zero-phase filter means that processed signals have precisely zero phase distortion and therefore no time shift of peak beta rebound was introduced. Hence, fluctuations of significance level and the jittering of central processing despite similar behavioral performance may be ascribed to the subject’s variant cognitive states or the degree of training (Buser and Rougeul-Buser, 1999; Sterman, 1999; Flotzinger et al., 1992; Wolpaw et al., 1994; Bastiaansen et al., 2001; Bastiaansen et al., 1999; Earle, 1988; Haig et al., 1995; Hoffman et al., 1991; Yabe et al., 1993). The exploration of underlying mechanisms mandates more meticulous designs in the future. Using the conventional method of averaging, certain diseases, such as Parkinson's and Unverricht-Lundborg myoclonic epilepsy, have been observed to show either attenuated, prolonged or abolished ERS responses (Silen et al., 2000; Tamas et al., 2003). Such cases can be further examined using the current ICA-based single-trial method for the time course and trial-by-trial dynamics to disclose hitherto unexplored mechanisms underlying these phenomena.
A concern with any data driven method is that prominent artifacts or noise can be intermingled with task-specific information (Ermer et al., 2000; Lins et al., 1993a; Lins et al., 1993b). However, previous ICA reports (Makeig et al., 2002; Mckeown and
Radtke, 2001) indicate that brain rhythmic signals generated from different sources usually have their own oscillatory frequencies with distinct phases and are located in specific brain regions with patterns that are distinct from artifacts or noise (see also Fig.
3). This endorses the feasibility of using ICA to separate targeted rhythmic signals from irrelevant ones. The high epoch-acceptance rate (~80%) can be attributed to an improved SNR as compared to other studies on single-trial approaches to sensorimotor oscillatory activities (Brovelli et al., 2002; Wolpaw and McFarland, 1994). For instance, the spatial map of IC2 in Fig. 2a correlates highly (0.88) with the spatial map of IC1 from empty room measurement as shown in Fig. 3b; this suggests that the neuromagnetic signal IC2, deselected for subsequent processing, can be accounted for by background noise in the shielding room. IC11 in Fig. 3a has a stationary cycle around 1.2 Hz, and its spatial map has higher weights at the outer rim of the MEG sensor array, which suggests a plausible connection with cardiac cycles. It was also observed (Fig. 3) that rhythmic activities in left and right SMIs as well as the occipital areas could be extracted into separate ICs that can be reminiscent of various mechanisms and time courses of different brain oscillatory activities (Pfurtscheller and Lopes da Silva, 1999; Pfurtscheller et al., 1997; Pfurtscheller et al., 1998b; Stancak and Pfurtscheller, 1996a; Stancak and Pfurtscheller, 1996b; Andrew and Pfurtscheller, 1999).
Since most task irrelevant signals, e.g., internal and external noises, can be removed by proper de-selection of ICs, it is possible to reconstitute the representative spatial map of all contributing ICs using
∑
, in which=
= k
j j
recon x
x
1
v
v xvreconis the reconstructed spatial
map, k is the number of selected ICs and xv is the spatial map of the ii th selected IC in Fig. (4) (Fig. 8a). This spatial map of reconstructed signals, which is a topographical distribution of weighting factors on the sensor array, can be overlaid with the segmented
MRI brain (Fig. 8b & 8c; ASA program, ANT Software, Dutch). The highest weight is shown to project over the SMI area, which demonstrates that the high SNR of the ICA-extracted rhythmic activities of each trial has made possible the use on single-trial data of source estimation methods that require high SNR on input data for processing, e.g., the equivalent current dipole technique (ECD), minimum current estimation (MCE), and minimum norm estimation (MNE) (Delorme et al., 2001; Delorme et al., 2002;
Jung et al., 2001; Makeig et al., 1997; Mckeown et al., 2001). Conventionally, these estimation methods exploit averaged data out of a large amount of trials.
Another reason why the intricate phase-unlocked signal can be preserved is the fact that no averaging procedure is needed; such a procedure would otherwise inherently distort the embedded information. Accordingly, as shown in Fig. 8d, source modeling with a moving dipole on a msec by msec basis on the reconstructed oscillatory beta signals during the rebound period (Brovelli et al., 2002) of a single-trial epoch results in a focused clustering of dipole foci at the pre-central area, i.e., the primary motor cortex (Fig. 8e). Figure 8 shows the result of MCE modeling (Uutela et al, 1999), where the center of MCE-estimated current sources (yellow dot) is very close (< 2mm distance) to the dipole location as estimated using the ECD approach (red dot).
It can be argued that one can first localize the generator area and then build a spatial filter for extracting single-trial data so that the subsequent analysis can be conducted on the source level instead of the sensor level. One premise and justification of using a source-area-generated spatial filter is that the source area can be precisely localized for the generation of a spatial filter (Tesche et al., 1995). The very first step is to filter the signals to obtain a presupposed reactive frequency band. However, using conventional simple filtering techniques, ambient noise with ~20Hz components cannot be optimally removed, and this will cause localization uncertainty for the probed sources (Fig 9).
However, ICA pre-processing decomposes the compound neuromagnetic signals into
various independent task-related and task-unrelated/noise components so that ~20Hz activities not related to the a priori spatiotemporal profile will not confound the selected ones. Furthermore, our ICA-based method differs from other spatial filtering techniques, e.g., signal space projection (SSP) which is a fixed spatial filter for signal extraction (Tesche et al., 1995). The ICA-based method blindly decomposes the MEG epochs (B) into a spatially distributed map (U) multiplied by temporal signals (S), i.e. B=U⋅S, on the basis of independency among sources (Vigario and Oja, 2000), whereas SSP mandates a pre-defined spatial filter (U_sf) for recovering signals (S), i.e. S=U_sf+⋅B, where + denotes pseudo inverse, based on orthogonal projection. When ambient noise and the spatial filter are not mutually orthogonal, the SSP has difficulty in resolving the two. Subsequent application of ICA following SSP does not ensure finer signal extraction or further noise removal since the data recovered from SSP are already linear mixtures of components out of a pre-defined spatial filter, which is a constraint drag on the optimal performance of ICA designed for blind decomposition.
Left and right sensorimotor rhythms can be decomposed into two distinct ICs (IC3 and IC5 in Fig. 3), respectively, implying possible independent modulatory mechanisms between the two hemispheres. This view is corroborated by an event-related coherence study (Andrew and Pfurtscheller, 1999) that reports a lack of interhemispheric coherence in human post-movement beta activities. Movement-related beta oscillatory activities of the right hemisphere can be extracted in the same way using spatial and temporal templates for right sensorimotor rhythm. The source locations for extracted right hemispheric beta activities were mainly in the right premotor area (data not shown), which agrees with previous studies (Brovelli et al., 2002; Ilmoniemi, R. J., 1991). Event-related beta activities in SMA and posterior parietal cortical areas (Brovelli et al., 2002; Joliot et al., 1999) are not observed in our data, possibly due to the fact that the contributing sources here are radial in orientation and thus could not be
optimally detected by MEG (Salmelin and Hari, 1994b).
The agreement between the values of BR amplitude obtained with the common spatial/temporal templates and the individually generated ones (Table I) promises a flexibility in both experimental design and analytical strategy. The proposed ICA-based spatiotemporal approach for single trial analysis can also be applied on fewer trials (Fig 7b), which is a great advantage over conventional methods. Given meticulous head positioning (see above the Method Section), common spatial and temporal templates can be used to extract pertinent movement-related neuromagnetic signals from subjects, which may shorten the overall time needed to run an experiment. We have no preference for the use of a grand averaged template over individual ones. On the contrary, the use of an individual template is suggested for any profound individual–based ERD/ERS study. However, the feasibility of using a grand averaged template provides an effective alternative in cases where lengthy procedures cannot be endured by the participants.
This is particularly true for clinical settings where patients have attention problems or are incapable of sustaining long experiments so that individual templates cannot be optimally obtained. Nevertheless, caution should be exercised when applying the current ICA-based single-trial method for clinical studies. For patients whose heads cannot be properly positioned in the center of the MEG helmet, the use of a common spatial template may fail, making a customized individual spatial template mandatory for IC selection. For patients whose motor performance deviates significantly from normal, e.g., victims of motor stroke or severe movement disorders, the use of the common temporal template might not be justified since the time courses of event-related brain activities may be significantly altered due to primary deficit or secondary plasticity. Accordingly, in such situations, an individual spatial template can be applied without a temporal template as an aid to component selection. Our future investigations will combine the current dual-template approach with a source estimation method so
that a spatial filter of better precision and higher dimensions can be designed, which will make possible sophisticated analysis on the source level instead of the sensor level, eliminating the positioning problem.
CONCLUSIONS
The present novel ICA-based spatiotemporal approach for single trial analysis features a paired-template matching for stringent component selection. The spatial template provides a priori spatial information for targeted brain signals while the temporal template contains temporal characteristics of event-related responses. Our method takes into account the subtle trial-by-trial dynamics. The method promises not only a high extraction rate of post-movement beta synchronization but also better localization of the corresponding sources. Various source modeling methods commanding high SNR can now be applied to single trial data as extracted using the ICA-spatiotemporal procedure. The embodied common template approach permits an effective alternative in cases where lengthy procedures cannot be endured by the participants or in clinical settings where patients have attention problems or are incapable of sustaining long experiments.
ACKNOWLEDGEMENTS
This study was funded by the Taipei Veterans General Hospital (90400, 90443, 91361, 91380, 923721, 92348, VTY-929112), National Science Council (902314B075124, 902314B075115, 902511S010001, 912314B075069, 912314B075069), and the Ministry of Education (89BFA221401) of Taiwan. We thank Mr. Chi-Cher Chou for MRI assistance and Dr. David M. Niddam for precious input to the work.
REFERENCES
Andrew, C. and Pfurtscheller G. 1995. Event-related coherence during finger movement:
a pilot study. Biomedizinische Technik 40:326-332.
Andrew, C. and Pfurtscheller, G. 1999. Lack of bilateral coherence of post-movement central beta oscillations in the human electroencephalography. Neuroscience letters 273:82-89.
Bastiaansen, M. C. M., Bocker, K. B. E., Cluitmans, P. J. M., and Brunia, C. H. M.
1999. Event-related desynchronization related to the anticipation of a stimulus providing knowledge of results. Clinical Neurophysiology 110:250-260.
Bastiaansen, M. C. M., Bocker, K. B. E. and Brunia, C. H. M. 2001. Event-related desynchronization during anticipatory attention for an upcoming stimulus: a comparative EEG/MEG study. Clinical Neurophysiology 112:393-403.
Brovelli, A., Battaglini, P. P., Naranjo, J. R., and Budai, R. 2002. Medium-range oscillatory network and the 20-Hz sensorimotor induced potential. Neuroimage 16:130-141.
Buser, P. and Rougeul-Buser A. 1999. EEG synchronization in cat, monkey and human during attentive states: a brief survey. In Event-related desynchronization. Handbook of electroencephalography and clinical neurophysiology. (G. Pfurtscheller and F. H.
Lopes da Silva), pp. 13-32. Elsevier, Amsterdam.
Clochon, P., Fontbonne, J. M. and Etevenon, P. 1996. A new method for quantifying EEG event-related desynchronization: amplitude envelope analysis.
Electroencephalography and Clinical Neurophysiology 98:126-129.
Delorme, A., Makeig, S., Fabre-Thorpe, M., and Sejnowske, T. 2001. From single-trial EEG to Brain Area dynamics. Neurocomputing 44: 1057-1064.
Delorme, A. and Makeig, S. 2003. EEG changes accompanying learned regulation of
12-Hz EEG activity. IEEE transactions on rehabilitation engineering, in press.
Earle, J. B. 1988. Task difficulty and EEG alpha asymmetry: an amplitude and frequency analysis. Neuropsychobiology 20:95-112.
Ermer, J. J., Mosher, J. C., Huang, M., and Leahy, R. M. 2000. Paired MEG data set source localization using recursively applied and projected (RAP) MUSIC. IEEE Transactions on Biomedical Engineering 47:1248-1260.
Florian, G. and Pfurtscheller, G. 1995. Dynamic spectral analysis of event-related EEG data. Electroencephalography and Clinical Neurophysiology 95:393-396.
Flotzinger, D., Kalcher, J. and Pfurtscheller, G. 1992. EEG classification by learning vector quantization. Biomedizinische Technik 37: 303-309.
Guger, C., Ramoser, H. and Pfurtscheller, G. 2000. Real-time EEG analysis with subject-specific spatial patterns for a brain-computer interface (BCI). IEEE Transactions on Rehabilitation Engineering 8:447-456.
Haig, A. R., Gordon, E., Rogers, G., and Anderson, J. 1995. Classification of single-trial ERP sub-types: application of globally optimal vector quantization using simulated annealing. Electroencephalography and Clinical Neurophysiology 94:
288-297.
Hoffman, R. E., Buchsbaum, M. S., Escobar, M. D., Makuch, R. W., Nuechterlein, K.
H., and Guich, S. M. 1991. EEG coherence of prefrontal areas in normal and schizophrenic males during perceptual activation. Journal of Neuropsychiatry and Clinical Neurosciences 3:169-175.
Hyvarinen, A., Karhunen, J. and Oja, E. 2001. Independent component analysis. John Wiley and Sons, New York.
Hyvarinen, A, Oja, E. 1997. A fast fixed-point algorithm for independent component analysis. Neural Computation 9(7):1483-1492.
Ilmoniemi, R. J. 1991. Estimates of neuronal current distributions. Acta Otolaryngol.
49(Suppl.): 80–87.
Ioannides, A. A., Singh, K. D., Hasson, R., Baumann, S. B., Rogers, R. L., Guinto, F. C., and Papanicolaou, A. C. 1993. Comparison of current dipole and magnetic field tomography analyses of the cortical response to auditory stimuli. Brain Topography 6:27-34.
Jensen, O. and Vanni, S. 2002. A new method to identify multiple sources of oscillatory activity from magnetoencephalographic data. Neuroimage 15:568-574.
Joliot, M., Papathanassiou, D., Mellet, E., Quinton, O., Mazoyer, N., Courtheoux, P., and Mazoyer, B. 1999. FMRI and PET of self-paced finger movement: comparison of intersubject stereotaxic averaged data. Neuroimage 10: 430-447.
Jung, T. P., Makeig, S., Westerfield, M., Townsend, J., Courchesne,E., and Sejnowski, J.
T. 2001. Analysis and Visualization of Single-Trial Event-Related Potentials. Human Brain Mapping 14:166-185.
Kajola, M., Ahonen, A., Hamalainen, M. S., Knuutila, J., Lounasmaa, O. V. Simola, J., and Vilkman, V. 1991. Development of multichannel neuromagnetic instrumentation in Finland. Clinical Physics & Physiological Measurement 12: 39-44.
Kao, Y. H., Guo, W. Y., Wu, Y. T., Liu, K. C., Chai, W. Y., Lin,C. Y., Hwang, Y. H., Liou, A. J. K., Cheng, H. C., Yeh, T. C., Hsieh, J. C., and Teng, M. M. H. 2003.
Hemodynamic segmentation of MR brain perfusion images using independent component, thresholding and Bayesian estimation. Magnetic Resonance in Medicine 49:885-894.
Kalcher, J. and Pfurtscheller, G. 1995. Discrimination between phase-locked and non-phase-locked event-related EEG activity. Electroencephalography and Clinical Neurophysiology 94:381-384.
Klimesch, W., Russegger, H., Doppelmayr, M., and Pachinger, T. 1998. A method for the calculation of induced band power: implications for the significance of brain
oscillation. Electroencephalography and Clinical Neurophysiology 108:123-130.
Leocani, L., Manganotti, C. T., Zhuang, P., and Hallett, M. 1997. Event-related coherence and event-related desynchronization/synchronization in the 10 Hz and 20 Hz EEG during self-paced movements. Electroencephalography and clinical neurophysiology 103: 199-206.
Lins, O. G., Picton, T. W., Berg, P., and Scherg, M. 1993a. Ocular artifacts in EEG and event-reated potentials. I. Scalp topography. Brain Topography 6:51-63.
Lins, O. G., Picton, T. W., Berg,P., and Scherg, M. 1993b. Ocular artifacts in recording EEGs and event-related potentials. II. Source dipoles and source components. Brain Topography 6:65-78.
Lopes da Silva, F. H. 1991. Neural mechanisms underlying brain waves: from neural membranes to networks. Electroencephalography and Clinical Neurophysiology 79:81-93.
Lopes da Silva, F. H. 1996. The generation of electric and magnetic signals of the brain by local networks. Comprehensive human physiology 1:509-531.
Makeig, S., Jung, T. P., Bell, A. J., Ghahremani, D., and Sejnowski, T. 1997. Blind separation of auditory event-related brain responses into independent components.
Proc. Natl. Acad. Sci. USA. 94: 10979-10984.
McKeown, M. J., Makeig, S., Brown. G. G., Jung. T. P., Kindermann. S. S, Bell. A. J, and Sejnowski, T. J. 1998. Analysis of fMRI data by blind separation into independent spatial components. Human Brain Mapping 6:160-188.
Mckeown, M. and Radtke, R. 2001. Phasic and tonic coupling between EEG and EMG demonstrated with independent component analysis. Journal of clinical neurophysiology 18: 45-57.
Mosher, J. C., Lewis, P. S. and Leahy, R. M. 1992. Multiple dipole modeling and localization from spatio-temporal MEG data. IEEE Transactions on Biomedical
Engineering 39:541-557.
Muller-Gerking, J., Pfurtscheller, G. and Flyvbjerg, H. 1999. Designing optimal spatial filters for single-trial EEG classification in a movement task. Clinical Neurophysiology 110:787-798.
Pfurtscheller, G. and Aranibar A. 1977. Event-related cortical desynchronization detected by power measurements of scalp EEG. Electroencephalography and Clinical Neurophysiology 42:817-826.
Pfurtscheller, G. and Aranibar A. 1979a. Evaluation of event-related desynchronization (ERD) preceding and following voluntary self-paced movement.
Electroencephalography and Clinical Neurophysiology 46:138-146.
Pfurtscheller, G. and Aranibar A. 1979b. Evaluation of event-related desynchronization (ERD) preceding and following voluntary self-paced movements.
Electroencephalography and Clinical Neurophysiology 46:138-146.
Pfurtscheller, G. 1981. Central beta rhythm during sensorimotor activities in man.
Electroencephalography and Clinical Neurophysiology 51:253-264.
Pfurtscheller, G. and Berghold, A. 1989. Patterns of cortical activation during planning of voluntary movement. Electroencephalography and Clinical Neurophysiology 72:250-258.
Pfurtscheller, G., Pregenzer M. and Neuper C. 1994. Visualization of sensorimotor areas involved in preparation for hand movement based on classification of alpha and central beta rhythms in single EEG trials in man. Neuroscience Letters 181:43-46.
Pfurtscheller, G., Stancak A., Jr. and Neuper C. 1996. Post-movement beta synchronization: a correlate of an idling motor area? Electroencephalography and Clinical Neurophysiology 98:281-293.
Pfurtscheller, G., Neuper C., Flotzinger D., and Pregenzer M. 1997. EEG-based discrimination between imagination of right and left hand movement.
Electroencephalography and Clinical Neurophysiology 103:642-651.
Pfurtscheller, G., Pichler-Zalaudek K., Ortmayr B., Diez J., and Reisecker F. 1998a.
Postmovement beta synchronization in patients with Parkinson's disease. Journal of Clinical Neurophysiology 15:243-250.
Pfurtscheller, G., Zalaudek K. and Neuper C. 1998b. Event-related beta synchronization after wrist, finger and thumb movement. Electroencephalography and Clinical Neurophysiology 109:154-160.
Pfurtscheller, G. and Lopes da Silva F. H. 1999. Event-related EEG/MEG synchronization and desynchronization: basic principles. [Review]. Clinical Neurophysiology 110:1842-1857.
Rosell, J., Casanas, R. and Scharfetter H. 2001. Sensitivity maps and system requirements for magnetic induction tomography using a plannar gradiometer.
Physiological Measurement 22: 121-130.
Salmelin, R. and Hari, R. 1994a. Characterization of spontaneous MEG rhythms in healthy adults. Electroencephalography and Clinical Neurophysiology 91:237-248.
Salmelin, R. and Hari, R. 1994b. Spatiotemporal characteristics of sensorimotor neuromagnetic rhythms related to thumb movement. Neuroscience 60:537-550.
Salmelin, R., Hamalainen, M., Kajola, M., and Hari, R. 1995. Functional segregation of movement-related rhythmic activity in the human brain. Neuroimage 2:237-243.
Silen T., Forss, N., Jensen, O., and Hari, R. 2000. Abnormal Reactivity of the ~20-Hz Motor Cortex Rhythm in Unverricht Lundborg Type Progressive Myoclonus Epilepsy.
Neuroimage 12:707-712.
Stancak, A. Jr. and Pfurtscheller G. 1996a. The effects of handedness and type of movement on the contralateral preponderance of mu-rhythm desynchronization.
Electroencephalography and Clinical Neurophysiology 99:174-182.
Stancak, A. Jr. and Pfurtscheller G. 1996b. Mu-rhythm changes in brisk and slow
self-paced finger movements. Neuroreport 7:1161-1164.
Sterman, M. B. 1999. Event-related EEG response correlates of task difficulty, sleep deprivation and sensory distraction. In Event-related desynchronization. Handbook of electroencephalography and clinical neurophysiology. (G. Pfurtscheller and F. H.
Lopes da Silva), pp. 233-242. Elsevier, Amsterdam.
Tamas, G. Szirmai, I., Palvolgyi, L., Takats, A., and Kamondi, A. 2003. Impairment of post-movement beta synchronization in parkinson's disease is related to laterality of tremor. Clinical Neurophysiology 114: 614-623.
Tang, A. C., Pearlmutter, B. A., Malaszenko, N. A., and Phung, D. B. 2002.
Independent components of magnetoencephalography: single-trial response onset times. Neuroimage 17:1773-1789.
Taniguchi, M., Kato, A., Fujita, N., Hirata, M., Tanaka, H., Kihara, T., Ninomiya, H., Hirabuki, N., Nakamura, H., Robinson, S. E., Cheyne, D., and Yoshimine, T. 2000.
Movement-related desynchronization of the cerebral cortex studied with spatially filtered magnetoencephalograpy. Neuroimage 12: 298-306.
Tesche, C. D., Unsitalo M. A., Ilmoniemi R. J., Huotilainen M., Kajola M., and Salonen O. 1995. Signal-space projections of MEG data characterize both distributed and well-localized neuroal sources. Electroencephalography and Clinical Neurophysiology 95:189-200.
Uutela, K., Hamalainen, M. and Somersalo, E. 1999. Visualization of magnetoencephalography data using minimum current estimates. Neuroimage 10:173-180.
Wolpaw, J. R. and McFarland, D. J. 1994. Multichannel EEG-based brain-computer communication. Electroencephalography and clinical Neurophysiology 90: 444-449.
Wu, Y. T., Lee, P. L., Chen, L. F., Yeh, T. C., and Hsieh, J. C. 2002. Single-trial quantification of imagery beta-band Mu rhythm in finger lifting task using