CHAPTER FOUR ANALYSES AND RESULTS
In this chapter, I will first present results of descriptive statistics and comparison between the two school sites. Since participants from the two sites were found to be significantly different, data from the two school sites will be reported separately in the following order: (1) effects of treatment, article, and interaction of these two on situational motivation before and after the reading task, (2) effects of treatment, article, and interaction of these two on reading comprehension, (3) participants’ preferences over the treatments and the reasons behind their preferences, and (4) comparison of participant characteristics by preference groups.
Descriptive Statistics and Comparison Between the Two School Sites
In this section, the analyses will be presented in the following order: (1) descriptive statistics of five pretest variables, including General Academic Motivation, L1 Academic Reading Motivation, EFL Learning Motivation, EFL Reading Comprehension, and Academic Reading Comprehension in L1; (2) descriptive statistics of the three dependent variables, including Pre-reading Situational Motivation, Post-reading Situational Motivation, and EAP Reading Comprehension; and (3) comparison of all the above variables between the two school sites.
Pretest Variables
The purpose of pretests, including three motivation-related scales and two proficiency tests, was twofold. First, the pretests were used to collect and identify participant data that may have influences on the dependent variables so that they may serve as covariates for later ANCOVA analyses. Second, they were used to examine if participants with different treatment preferences differed in these pretest aspects.
Internal consistency estimates of reliability were computed for the three scales. The
Cronbach alphas for the three separate scales, General Academic Motivation, L1 Academic
Reading Motivation, and EFL Learning Motivation, were .74, .69, and .88 respectively.
The descriptive statistics including means and standard deviations for all five pretest scores were summarized both aggregately and by school site in Table 16.
Table16. Means (SDs) of Pretest Scores Scale/Test (range) Whole Data Set
(n = 175)
Site A (n = 104)
Site B (n = 71) GAM (10-70) 45.64 (6.92) 46.70 (6.94) 44.08 (6.64) ARM (10-70) 45.47 (6.73) 46.02 (6.42) 44.68 (7.12) ELM (20-140) 97.23 (14.81) 100.37 (13.63) 92.65 (15.36) ERC (0-20) 9.64 (3.31) 7.75 (2.45) 12.41 (2.30) ARC (0-15) 11.37 (2.02) 10.97 (1.99) 11.96 (1.94)
Note: GAM = General Academic Motivation; ARM = Academic Reading Motivation ELM = EFL Learning Motivation; ERC = EFL Reading Comprehension;
ARC = Academic Reading Comprehension in L1
Dependent Variables
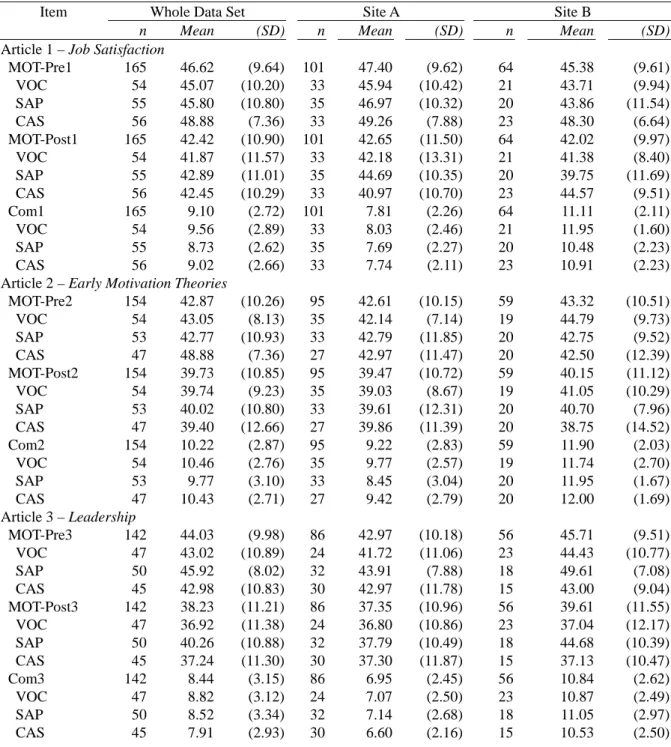
A summary of numbers, means, and standard deviations for dependent variables, including scores of (1) Pre-reading Situational Motivation, (2) Post-reading Situational Motivation, and (3) EAP Reading Comprehension by site, article, and treatment is presented in Table 17. Important information from Table 17 was also summarized and transferred to form Figures 4, 5, 6, and 7.
Situational Motivation
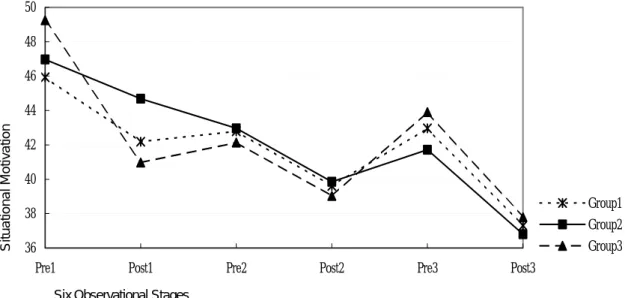
Figure 4 shows Site A participants’ situational motivation levels observed in the
following sequential order: (1) after treatment and before reading the first article; (2) after
reading the first article; (3) after treatment and before reading the second article; (4) after
reading the second article; (5) after treatment and before reading the third article; and (6) after
reading the third article. The figure shows that in general, regardless of articles being read,
participants’ situational motivation level decreased from the time they received the treatment
before reading to the time they completed the reading tasks. Comparing motivation across
articles, it was found that both pre- and post-reading motivation levels became lower from the
first to the second article. In reading the third article, however, participants’ pre-reading situational motivation was higher compared to the previous round, but their post-reading motivation dropped to a lowest point of all.
Table 17. Unadjusted Descriptive Statistics of All Dependent Variables
Whole Data Set Site A Site B
Item
n Mean (SD) n Mean (SD) n Mean
(SD)
Article 1 – Job Satisfaction
MOT-Pre1 165 46.62 (9.64) 101 47.40 (9.62) 64 45.38 (9.61)
VOC 54 45.07 (10.20) 33 45.94 (10.42) 21 43.71 (9.94)
SAP 55 45.80 (10.80) 35 46.97 (10.32) 20 43.86 (11.54)
CAS 56 48.88 (7.36) 33 49.26 (7.88) 23 48.30 (6.64)
MOT-Post1 165 42.42 (10.90) 101 42.65 (11.50) 64 42.02 (9.97)
VOC 54 41.87 (11.57) 33 42.18 (13.31) 21 41.38 (8.40)
SAP 55 42.89 (11.01) 35 44.69 (10.35) 20 39.75 (11.69)
CAS 56 42.45 (10.29) 33 40.97 (10.70) 23 44.57 (9.51)
Com1 165 9.10 (2.72) 101 7.81 (2.26) 64 11.11 (2.11)
VOC 54 9.56 (2.89) 33 8.03 (2.46) 21 11.95 (1.60)
SAP 55 8.73 (2.62) 35 7.69 (2.27) 20 10.48 (2.23)
CAS 56 9.02 (2.66) 33 7.74 (2.11) 23 10.91 (2.23)
Article 2 – Early Motivation Theories
MOT-Pre2 154 42.87 (10.26) 95 42.61 (10.15) 59 43.32 (10.51)
VOC 54 43.05 (8.13) 35 42.14 (7.14) 19 44.79 (9.73)
SAP 53 42.77 (10.93) 33 42.79 (11.85) 20 42.75 (9.52)
CAS 47 48.88 (7.36) 27 42.97 (11.47) 20 42.50 (12.39)
MOT-Post2 154 39.73 (10.85) 95 39.47 (10.72) 59 40.15 (11.12)
VOC 54 39.74 (9.23) 35 39.03 (8.67) 19 41.05 (10.29)
SAP 53 40.02 (10.80) 33 39.61 (12.31) 20 40.70 (7.96)
CAS 47 39.40 (12.66) 27 39.86 (11.39) 20 38.75 (14.52)
Com2 154 10.22 (2.87) 95 9.22 (2.83) 59 11.90 (2.03)
VOC 54 10.46 (2.76) 35 9.77 (2.57) 19 11.74 (2.70)
SAP 53 9.77 (3.10) 33 8.45 (3.04) 20 11.95 (1.67)
CAS 47 10.43 (2.71) 27 9.42 (2.79) 20 12.00 (1.69)
Article 3 – Leadership
MOT-Pre3 142 44.03 (9.98) 86 42.97 (10.18) 56 45.71 (9.51)
VOC 47 43.02 (10.89) 24 41.72 (11.06) 23 44.43 (10.77)
SAP 50 45.92 (8.02) 32 43.91 (7.88) 18 49.61 (7.08)
CAS 45 42.98 (10.83) 30 42.97 (11.78) 15 43.00 (9.04)
MOT-Post3 142 38.23 (11.21) 86 37.35 (10.96) 56 39.61 (11.55)
VOC 47 36.92 (11.38) 24 36.80 (10.86) 23 37.04 (12.17)
SAP 50 40.26 (10.88) 32 37.79 (10.49) 18 44.68 (10.39)
CAS 45 37.24 (11.30) 30 37.30 (11.87) 15 37.13 (10.47)
Com3 142 8.44 (3.15) 86 6.95 (2.45) 56 10.84 (2.62)
VOC 47 8.82 (3.12) 24 7.07 (2.50) 23 10.87 (2.49)
SAP 50 8.52 (3.34) 32 7.14 (2.68) 18 11.05 (2.97)
CAS 45 7.91 (2.93) 30 6.60 (2.16) 15 10.53 (2.50)
Note: MOT-Pre1, 2, 3 = Pre-reading Situational Motivation measured the first, second, and third time.
MOT-Post1, 2, 3 = Post-reading Situational Motivation measured the first, second, and third time.
Com1, 2, 3 = Comprehension measured the first, second, and third time.
VOC = Vocabulary List; SAP = Self Appraisal; CAS = Case Study
36 38 40 42 44 46 48 50
Pre1 Post1 Pre2 Post2 Pre3 Post3
Six Observational Stages
Situational Motivation
Group1 Group2 Group3
Figure 4. Situational motivation levels at the six sequential stages of experiment, Site A
Note: Group 1 students received treatments of Vocabulary List, Self Appraisal, and Case Study for reading the first, second, and third articles. Group 2 students received treatments of Self Appraisal, Case Study, and Vocabulary List for reading the first, second, and third articles. Group 3 students received treatments of Case Study, Vocabulary List, and Self Appraisal for reading the first, second, and third articles. Pre1, Pre2, Pre3 = Pre-reading Situational Motivation measured before reading the first, second, and third article.
Post1, Post2, Post3 = Post-reading Situational Motivation after reading the first, second, and third article.
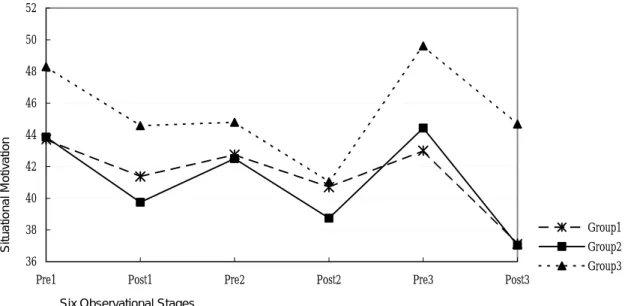
Figure 5 shows Site B participants’ situational motivation levels. The decreasing
pattern from article to article and from pre-reading to post-reading is similar to the pattern
observed in Site A but is less dramatic. Again, although pre-reading motivation fell from
reading the first article to reading the second one, it went up when participants read the third
article. One additional difference in Site B is that Group 3 participants (whose order for
receiving treatments was Case Study, Vocabulary List, and Self Appraisal for the first, second,
and third articles) had consistently higher levels of motivation than participants from Groups
1 and 2.
36 38 40 42 44 46 48 50 52
Pre1 Post1 Pre2 Post2 Pre3 Post3
Six Observational Stages
Situational Motivation
Group1 Group2 Group3
Figure 5. Situational motivation levels at the six sequential stages of experiment, Site B
Note: Group 1 students received treatments of Vocabulary List, Self Appraisal, and Case Study for reading the first, second, and third articles. Group 2 students received treatments of Self Appraisal, Case Study, and Vocabulary List for reading the first, second, and third articles. Group 3 students received treatments of Case Study, Vocabulary List, and Self Appraisal for reading the first, second, and third articles. Pre1, Pre2, Pre3 = Pre-reading situational motivation measured before reading the first, second, and third article.
Post1, Post2, Post3 = Post-reading situational motivation after reading the first, second, and third article.
Paired-sample t tests were conducted to see, in the pairs of Pre-reading and Post-reading Situational Motivation scores, if participants’ situational motivation level decreased significantly. All six tests were significant, indicating a significant deteriorating effect by the actual reading experience on situational motivation for participants from both sites.
Results of paired-sample t tests were summarized in Table 18.
Table 18. Summary of t Tests Between Pre-reading and Post-reading Situational Motivation
Site A Site B
Paired-samples t tests
df t p df t p
MOT-Pre1 vs. MOT-Post1 100 4.934 .000 63 3.385 .001 MOT-Pre2 vs. MOT-Post2 94 4.611 .000 58 3.017 .004 MOT-Pre3 vs. MOT-Post3 85 5.524 .000 55 6.582 .000
Note: MOT-Pre1, 2, 3 = Pre-reading Situational Motivation measure the first, second, and third time.
MOT-Post1, 2, 3 = Post-reading Situational Motivation measure the first, second, and third time.
Comprehension
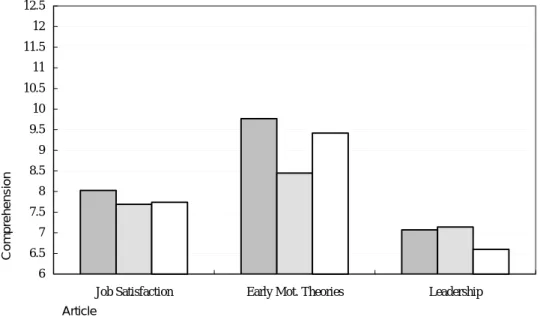
Participants’ mean comprehension scores by article and treatment are presented in
Figures 6 and 7 for each site respectively. From the two bar charts, it can be observed that Site A participants’ comprehension scores were consistently lower than those of Site B.
Among articles, comprehension for the second article was on average higher than that for the first and the third, especially in Site A. Comprehension on the third article was the lowest.
6 6.5 7 7.5 8 8.5 9 9.5 10 10.5 11 11.5 12 12.5
Job Satisfaction Early Mot. Theories Leadership Article
Comprehension
VOC
CAS SAP
VOC SAP
Figure 6. Unadjusted means of comprehension by article and treatment, Site A
Note: VOC = Vocabulary List; SAP = Self Appraisal; CAS = Case Study
6.0 6.5 7.0 7.5 8.0 8.5 9.0 9.5 10.0 10.5 11.0 11.5 12.0 12.5
Job Satisfaction Early Mot. Theories Leadership Article
Comprehension
CAS
Figure 7. Unadjusted means of comprehension by article and treatment, Site B
Note: VOC = Vocabulary List; SAP = Self Appraisal; CAS = Case Study
Comparison Between the Two School Sites
Independent-samples t tests were performed to determine if participants from Site A differed from those from Site B significantly in their motivational orientations and EAP reading related proficiencies. As seen in Tables 16 and 19, participants from Site A had significantly higher motivational scores (including General Academic Motivation and EFL Learning Motivation) than those from Site B. However, participants from Site A scored relatively lower than those from Site B on their two ability indicators (including EFL Reading Comprehension test and L1 Academic Reading Comprehension test). The results of t tests showed that the two school sites had significant differences on four of the five pretest variables except for L1 Academic Reading Motivation. The difference between their mean scores on EFL Reading Comprehension (7.75 for Site A versus 12.41 for Site B from a possible total of 20) was especially dramatic. Results of independent-samples t tests for the five pretests between two school sites are summarized in Table 19.
Table19. Summary of t Tests for Pretest Variables between Two School Sites
Scales / Tests df t p
GAM 173 2.493 .014
ARM 173 1.300 .195
ELM 173 3.492 .001
ERC 173 -12.658 .000
ARC 173 -3.257 .001
Note: GAM = General Academic Motivation; ARM = Academic Reading Motivation ELM = EFL Learning Motivation; ERC = EFL Reading Comprehension;
ARC = Academic Reading Comprehension in L1
Independent-samples t tests were also conducted for dependent variables to examine if the two school sites differed significantly on situational motivation and comprehension.
Results of t tests are presented in Table 20. Results indicated that Site A and Site B
participants did not differ in situational motivation, but differed significantly in all three
comprehension scores. Site B participants comprehended all the three articles significantly
better than those from Site A.
Table 20. Summary of t Tests for Dependent Variables between Two School Sites
Items df t p
MOT-Pre1 163 1.322 .188
MOT-Post1 163 .365 .715
MOT-Pre2 152 -.423 .673
MOT-Post2 152 -.380 .704
MOT-Pre3 140 -1.620 .107
MOT-Post3 140 -1.194 .235
Comprehension 1 163 -9.416 .000
Comprehension 2 152 -6.349 .000
Comprehension 3 140 -9.179 .000
Note: MOT-Pre1,2,3 = Pre-reading Situational Motivation measured the first, second, and third time.
MOT-Post1,2,3 = Post-reading Situational Motivation measured measure the first, second, and third time.
In summary, Site A participants demonstrated a higher motivation (General Academic Motivation and EFL Learning Motivation) while Site B participants had a higher proficiency (EFL Reading Comprehension and Academic Reading Comprehension in L1) on the pretests.
As for dependent variables, participants from two sites did not differ in situational motivation, despite the fact that Site A participants had higher General Academic Motivation and EFL Learning Motivation on the pretest. Participants from Site B demonstrated significantly higher comprehension than those from Site A. Since the comparison between the two school sites showed that these two groups of participants were significantly different in most of the pretest scores and posttest variables, the following analyses will be presented by separating the two sites.
Analyses and Results for Site A
In the following sections, I will first show the results of correlation analyses among all
variables and then present results of the following: (1) treatment/article effects on pre-reading
and post-reading situational motivation, (2) treatment/article effects on comprehension, (3)
analyses of preferences over treatments and reasons behind preferences, and (4) comparison
of participant characteristics by their preferences.
Correlation Analyses
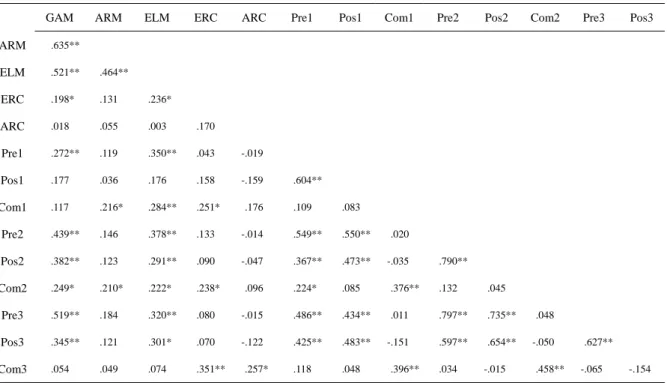
Correlation coefficients were computed among all pretest and dependent variables and the results are presented in Table 21. Between pretest and dependent variables, all three Pre-reading Situational Motivation scores were significantly correlated with two of the three pretest motivation scores, including General Academic Motivation and EFL Learning Motivation, all at the .01 level. However, Pre-reading Situational Motivation was uncorrelated with either of the pretest proficiency scores, EFL Reading Comprehension or L1 Academic Reading Comprehension. Post-reading Situational Motivation showed a similar, but less straightforward, pattern. The Post-reading Situational Motivation scores measured at the second and the third times, but not the first time, were significantly correlated with General Academic Motivation and EFL Learning Motivation. Like Pre-reading Situational Motivation, Post-reading Situational Motivation was uncorrelated with any of the two pretest proficiency scores. Another type of dependent variable, Comprehension, showed different relations with pretest variables. All three comprehension scores were significantly correlated with EFL Reading Comprehension; Comprehension measured the first and the second time were also correlated with Academic Reading Motivation and EFL Learning Motivation; the second Comprehension score was additionally correlated with General Academic Motivation and the third with L1 Academic Reading Comprehension. In summary, Situational Motivation was correlated with both General Academic Motivation and EFL Learning Motivation and at the same time uncorrelated with either of the two proficiency scores while all three Comprehension scores were consistently correlated with proficiency on EFL Reading Comprehension.
Among pretest variables, the three motivational scales (General Academic Motivation,
L1 Academic Reading Motivation, and EFL Learning Motivation) were correlated with one
another at a .01 level, but the two competency measures (EFL Reading Comprehension and
L1 Academic Reading Comprehension) were not correlated. EFL Reading Comprehension was also correlated with General Academic Motivation and EFL Learning Motivation.
Among dependent variables, Pre-reading Motivation was highly correlated with Post-reading Motivation, but they did not correlate with Comprehension (except in one of the 12 incidents).
The correlation coefficients shown in Table 21 were examined as criteria for selecting covariates in later ANCOVA analyses.
Table 21. Correlation Coefficients, Site A
GAM ARM ELM ERC ARC Pre1 Pos1 Com1 Pre2 Pos2 Com2 Pre3 Pos3
ARM .635**
ELM .521** .464**
ERC .198* .131 .236*
ARC .018 .055 .003 .170
Pre1 .272** .119 .350** .043 -.019
Pos1 .177 .036 .176 .158 -.159 .604**
Com1 .117 .216* .284** .251* .176 .109 .083
Pre2 .439** .146 .378** .133 -.014 .549** .550** .020
Pos2 .382** .123 .291** .090 -.047 .367** .473** -.035 .790**
Com2 .249* .210* .222* .238* .096 .224* .085 .376** .132 .045
Pre3 .519** .184 .320** .080 -.015 .486** .434** .011 .797** .735** .048
Pos3 .345** .121 .301* .070 -.122 .425** .483** -.151 .597** .654** -.050 .627**
Com3 .054 .049 .074 .351** .257* .118 .048 .396** .034 -.015 .458** -.065 -.154
Note: **p<.01, *p<.05
GAM = General Academic Motivation ARM = L1 Academic Reading Motivation ELM = EFL Learning Motivation
ERC = EFL Reading Comprehension
ARC = Academic Reading Comprehension in L1
Pre1, Pre2, Pre3 = Pre-reading Situational Motivation measured the first, second, and third time Post1, Post 2, Post3 = Post-reading Situational Motivation measured the first, second, and third time Com1, Com2, Com3 = Comprehension measured the first, second, and third time
Effects on Pre-reading and Post-reading Motivation
Pre-reading Situational Motivation was a direct measure of participants’ perception right
after the treatment was received. It should not be influenced by factors such as the content
of reading materials or the reading experience. Post-reading Situational Motivation, on the
other hand, was mediated by the actual reading experience. They will be discussed separately in the following two sub-sections.
Pre-reading Situational Motivation
A 3 by 3 ANCOVA was performed to examine possible treatment (Vocabulary List, Self Appraisal, and Case Study), article (Job Satisfaction, Early Motivation Theories, and Leadership), and interactive effects on Pre-reading Situational Motivation. Based on
correlation coefficients from Table 21, General Academic Motivation and EFL Learning Motivation were used as covariates in the analysis. Results of ANCOVA analysis on Pre-reading Motivation for Site A are presented in Table 22. There was no interaction between article and treatment. Significant article effect was observed; however, treatment did not have a significant effect on participants’ Pre-reading Situational Motivation.
Follow-up analyses of the main effect for article consisting of all pairwise comparisons among the three articles were examined. The results of these analyses indicated that the Pre-reading Situational Motivation on the first article was significantly higher than that on the second, t (92) = 4.76, p = .00, as well as than that on the third, t (83) = 3.85, p = .00. There was no significant difference between the second and the third article. Overall, the 3 x 3 ANCOVA indicated higher Pre-reading Situational Motivation for the first article than for the other two articles.
Table 22. ANCOVA Summary for Pre-reading Situational Motivation, Site A
Source df F p η2
Covariate 1 – GAM 1 25.022 .000 .086
Covariate 2 – ELM 1 9.442 .002 .034
Treatment 2 1.434 .240 .011
Article 2 7.611 .001 .054
Treatment*Article 4 .619 .649 .009
Error 265 Total 276
Note: GAM = General Academic Motivation; ELM = EFL Learning Motivation
The mean scores of Pre-reading Situational Motivation by article and treatment were depicted in Figure 8. Three separate lines represented the three treatments, the horizontal axis positioned the three articles for comparison, and the vertical axis showed the estimated marginal means of pre-reading motivation. By comparing treatments, it was found that the Vocabulary List treatment produced the lowest Pre-reading Situational Motivation across three articles. Case Study treatment induced the highest Pre-reading Situational Motivation in the article Job Satisfaction; Self Appraisal induced a slightly higher Pre-reading Situational Motivation in the third article Leadership; and the three treatments produced very close scores in the second article Early Motivation Theories. Comparing across articles, it was found that participants showed the highest Pre-reading Situational Motivation with the first article.
With the Vocabulary List treatment, Pre-reading Situational Motivation decreased through the second and the third article. With the other two treatments, Pre-reading Situational Motivation dropped to a lowest point in the second article and increased slightly in the third.
ARTICLE
Leadership Early Mot. Theories
Job Satisfaction
Estimated Marginal Means
50
48
46
44
42
40
Treatment
VOC SAP CAS
Figure 8. Means plot of pre-reading situational motivation, Site A
Note: VOC = Vocabulary List; SAP = Self Appraisal; CAS = Case Study
Post-reading Situational Motivation
A 3 by 3 ANCOVA was performed to examine possible treatment (Vocabulary List, Self Appraisal, and Case Study), article (Job Satisfaction, Early Motivation Theories, and Leadership), and interactive effects on Post-reading Situational Motivation. Based on
correlation coefficients from Table 21, General Academic Motivation and EFL Learning Motivation were used as covariates in the analysis. Results of ANCOVA analysis on Post-reading Motivation for Site A were presented in Table 23. There was no interaction between article and treatment. Significant article effect was observed; however, treatment did not have a significant effect on participants’ Post-reading Situational Motivation.
Follow-up analyses to the main effect for article were examined. Post-hoc pairwise comparisons indicated that the Post-reading Situational Motivation on the first article was significantly higher than that on the third, t (83) = 3.46, p = .00. There was no significant difference between the first and the second or the second and the third article. Overall, the 3 x 3 ANCOVA indicated higher Post-reading Situational Motivation for the first article.
Table 23. ANCOVA Summary for Post-reading Motivation, Site A
Source df F p η2
Covariate 1 - GAM 1 10.989 .001 .040
Covariate 2 - ELM 1 3.750 .054 .014
Treatment 2 .449 .639 .003
Article 2 6.028 .003 .044
Treatment*Article 4 .329 .858 .005
Error 261 Total 272
Note: GAM = General Academic Motivation; ELM = EFL Learning Motivation
The mean scores of Post-reading Situational Motivation by article and treatment are
depicted in Figure 9. By comparing treatments, it was found that the Vocabulary List
treatment produced the lowest Post-reading Situational Motivation in general. Self
Appraisal treatment induced highest Post-reading Situational Motivation with the article Job
Satisfaction but the differences among treatments diminished in the second article, Early
Motivation Theories, and the third one, Leadership.
ARTICLE
Leadership Early Mot. Theories
Job Satisfaction
Estimated Marginal Means
46
44
42
40
38
36
34
Treatment
VOC SAP CAS
Figure 9. Means plot of post-reading situational motivation, Site A
Note: VOC = Vocabulary List; SAP = Self Appraisal; CAS = Case StudyEffects on Comprehension
A 3 by 3 ANCOVA was performed to examine possible treatment (Vocabulary List, Self Appraisal, and Case Study), article (Job Satisfaction, Early Motivation Theories, and Leadership), and interactive effects on comprehension. Based on correlation analysis,
Academic Reading Motivation, EFL Learning Motivation, EFL Reading Comprehension, and L1 Academic Reading Comprehension were used as covariates in the ANCOVA analysis.
General Academic Motivation, although correlated, was not chosen as one of the covariates because of two reasons. First, it correlated with only one of the three comprehension scores.
Second, it was highly correlated with Academic Reading Motivation (p = .64) which has
already been chosen as a covariate. Results of ANCOVA analysis on Comprehension for
Site A are presented in Table 24. There was no interaction between article and treatment.
Treatment did not have a significant effect on participants’ comprehension, either.
Significant article effect was observed. Post-hoc pairwise comparisons showed significant difference between the first and second article, t (92) = 5.21, p = .00; between the second and the third, t (83) = 7.84, p = .00; and between the first and the third, t (83) = 2.33, p = .02.
Comprehension on the second article was the highest, followed by that on the first article and then the third.
Table 24. ANCOVA Summary for Comprehension, Site A
Source df F p η2
Covariate 1 - ARM 1 1.499 .222 .006
Covariate 2 - ELM 1 3.665 .057 .014
Covariate 3 - ERC 1 12.774 .000 .046
Covariate 4 - ARC 1 5.282 .022 .019
Treatment 2 2.004 .137 .015
Article 2 20.184 .000 .132
Treatment*Article 4 1.107 .354 .016
Error 266 Total 279
Note: ARM = Academic Reading Motivation; ELM = EFL Learning Motivation;
ERC = EFL Reading Comprehension; ARC = L1 Academic Reading Comprehension
The mean scores of Comprehension by article and treatment are depicted in Figure 10.
By comparing treatments, it was found that the Vocabulary List treatment produced the
highest comprehension scores in general. Self Appraisal treatment produced the lowest
comprehension scores with the first article Job Satisfaction and the second one Early
Motivation Theories. Among three articles, comprehension was the highest with the second
article Early Motivation Theories and the lowest with the third one Leadership.
ARTICLE
Leadership Early Mot. Theories
Job Satisfaction
Estimated Marginal Means
11
10
9
8
7
6
Treatment
VOC SAP CAS
Figure 10. Means plot of comprehension, Site A
Note: VOC = Vocabulary List; SAP = Self Appraisal; CAS = Case Study
Analyses of Preferences for Treatments and the Reasons
Students were originally assigned randomly into three groups to receive different treatments in three orders combined with three different articles. Reading the three articles in identical order (1
st: Job Satisfaction; 2
nd: Early Motivation Theories; 3
rd: Leadership), Group 1 participants underwent Vocabulary List treatment for the first article, Self Appraisal treatment for the second article, and Case Study treatment for the third; Group 2 participants’
treatment order was Self Appraisal, Case Study, and Vocabulary List for the first, second, and third articles; Group 3 received Case Study, Vocabulary List, and Self Appraisal treatments for the first, second, and third articles. Since different groups had different combination of treatments and articles and all the treatments were catered to the specific articles, the exact content of one treatment varied according to the article. For example, Group 1 participants’
Vocabulary List was based on the first article and therefore different from Group 2’s which
was based on the third article. Therefore the analyses conducted in this section separated students by their experimental groups. After the entire experiment, participants indicated which treatment they preferred to have and which one they preferred not to have if they were required to do similar reading exercises again.
Two 3 by 3 contingency table analyses were conducted to evaluate the homogeneity of proportions of each group’s most and least preferred choices. The row variable was the randomly assigned group of students with three levels (Group 1, Group 2, and Group 3) and the column variable was treatment preference or dislike with three levels (Vocabulary List, Self Appraisal, and Case Study) each. The frequencies in Table 25 were the number of participants in each group who chose the corresponding treatment. Site A participants’
assigned groups were not found to be significantly related with their preferences, Pearson (4, N = 82) = 1.23, p = .87, Cramer’s V = .09. There was no significant difference for participants’ least preferred treatment, either, Pearson (4, N = 82) = 2.96, p
= .56, Cramer’s V = .13.
χ
2χ
2Detailed counts for Site A by groups were transferred to percentage values and presented in Table 25. As displayed, the percentages for Site A participants were relatively evenly distributed. Except for Group 1 on the most preferred treatment, where Vocabulary List had a relatively higher percentage, and for Group 3 on the least preferred treatment, where Vocabulary List had a relatively lower percentage, no obvious preference seemed present.
Table 25. Participants’ Preference over Treatments by Experimental Group, Site A Count (%) Most Preferred Treatment Least Preferred Treatment
VOC SAP CAS Total VOC SAP CAS Total
Group 1 (n=24)
10
(42%)7
(29%)7
(29%)24 7
(30%)7
(30%)9
(39%)23
Group 2 (n=27)
9
(33%)10
(37%)8
(30%)27 9
(33%)9
(33%)9
(33%)27
Group 3 (n=32)
9
(28%)12
(38%)11
(34%)32 5
(16%)12
(38%)15
(47%)32
Total
28 29 26 83 21 28 33 82
Note: VOC = Vocabulary List; SAP = Self Appraisal, CAS = Case Study
After deciding on their preferences for treatments, participants were asked to write
briefly their reasons for why they preferred or disliked the treatments they chose. An analysis of the reasons they provided seemed to indicate no difference across groups of students; that is, participants’ reasons for preferring certain type of treatments were similar regardless of the order of the treatments they received.
The analysis showed that those who chose Vocabulary List to be their most preferred treatment liked it because: (a) it aided comprehension (14 tokens); (b) vocabulary was their barrier to reading (6 tokens); (c) it saved their time in looking up words (4 tokens); (d) it speeded up their reading (3 tokens); and (e) it was easy to understand (1 token). Students chose Vocabulary List as the least preferred treatment because: (a) it was not necessary or it was useless (7 tokens); (b) it was boring and could not interest them (6 tokens); and (c) vocabulary meaning was something they could look up by themselves (6 tokens).
As for the treatment of Self Appraisal, the reasons for participants’ preference include: (a) it was more interesting (14 tokens); (b) it promoted self-understanding (5 tokens); and (c) it was easier (2 tokens). Students’ reasons for disliking Self Appraisal included: (a) it did not help comprehension (16 tokens); and (b) it was not directly relevant to the articles to be read (6 tokens). Other reasons included complaints on the credibility of Self Appraisal result (1 token), the complexity (1 token), the lack of interest (1 token), and the inability of the content to make them focus on the reading (1 token).
For the treatment of Case Study, those participants who chose it as their most preferred
treatment said: (a) it helped them to think about the articles’ main ideas or prepared them for
later reading (14 tokens); (b) it broadened their perspectives (5 tokens); (c) it aroused their
interests (3 tokens); and (d) it was more practical (2 tokens). Those who disliked Case Study
said that: (a) it was too complicated and too heavy for them when they were busy enough with
EAP texts, even when the Case Study was in their L1 (8 tokens); (b) it was boring and tiring
(6 tokens); (c) it couldn’t aid comprehension of the English text (1 token); (d) it took time (1
token); (e) it was not relevant to the text (1 token); and (f) there was no follow-up discussion
(1 token). The above results are summarized in Table 26.
Table 26. Summary of Positive and Negative Feelings toward Treatments, Site A
Vocabulary List Self Appraisal Case Study
Positive
aided comprehension (14) vocabulary obstacle (6) saved time (4)
speeded up (3) easy (1)
interesting (14) self-understanding (5) easy (2)
prepared for reading (14) broaden perspective (5) aroused interests (3) more practical (2)
Negative
not necessary (7) boring (6) self help (6)
not aid comprehension (16) not relevant to text (6) credibility of result (1) complexity (1)
lack of interest (1) hard to focus (1)
too complicated (8) boring (6)
did not help comprehend (1)
took time (1)
not relevant (1) no discussion (1)
Note: Number of tokens for each type are shown in parentheses.
To sum up, participants’ written responses indicated that Vocabulary List was preferred mainly because it aided comprehension directly; Self Appraisal was liked mainly because it was interesting; Case Study was chosen mainly because it prepared them for reading. As for why the treatments were disliked, the main reason for Vocabulary List was unnecessary; for Self Appraisal was the lack of assistance for comprehension, and for Case Study was its difficulty.
Comparison of Participant Characteristics by Their Preferences
Participants, according to their reported preferences, were grouped to see whether those
with different preferences differed significantly in their motivational orientations or EAP
reading related proficiency as indicated by pretest scores. Two-way multivariate analyses of
variance (MANOVA) were conducted to determine the relationship of preference (Vocabulary
List, Self Appraisal, and Case Study) with the five pretest variables: (1) General Academic
Motivation, (2) L1 Academic Reading Motivation, (3) EFL Learning Motivation, (4) EFL
Reading Comprehension, and (5) L1 Academic Reading Comprehension. The two
independent variables were the two choices participants’ reported, the most preferred treatment and the least preferred one.
No interaction was found between the three groups of preference and the three groups of dislike, Wilks’ λ= .94, F (5, 76) = .93, p = .47, multivariate = .06. No significant difference was found among the three groups of preference over different treatments on 5 pretest variables, Wilks’ λ= .93, F (5, 76) = .51, p = .88, multivariate = .03. There was also no significant difference among the three groups of dislike over different treatments on the same 5 pretest variables, Wilks’ λ= .95, F (5, 76) = .40, p = .95, multivariate = .03.
η
2η
2η
2Analyses and Results for Site B
Like the analyses in the previous sections performed for Site A, I will first show the results of correlation analyses among all variables and then present results for Site B on the following: (1) treatment/article effects on pre-reading and post-reading motivation, (2) treatment/article effects on comprehension, (3) analyses of preferences over treatments and reasons behind preference, and (4) comparison of participant characteristics by their preferences.
Correlation Analyses
Correlation coefficients were computed among all pretest and dependent variables and the results are presented in Table 27. Between pretest and dependent variables, all three Pre-reading Situational Motivation scores were significantly correlated with EFL Learning Motivation, all at the .01 level; two of them were also correlated with L1 Academic Reading Motivation and one was additionally correlated with General Academic Motivation.
Pre-reading Situational Motivation was uncorrelated with either of the pretest proficiency scores, EFL Reading Comprehension or L1 Academic Reading Comprehension.
Post-reading Situational Motivation showed a similar pattern. All three Post-reading
Situational Motivation scores were significantly correlated with EFL Learning Motivation, but the first measured Post-reading Situational Motivation score was additionally correlated with General Academic Motivation and L1 Academic Reading Motivation. Like Pre-reading Situational Motivation, Post-reading Situational Motivation was uncorrelated with pretest proficiency scores.
Table 27. Correlation Coefficients, Site B
GAM ARM ELM ERC ARC Pre1 Pos1 Com1 Pre2 Pos2 Com2 Pre3 Pos3
ARM .676**
ELM .538** .420**
ERC .118 .180 .191
ARC .212 .214 .084 .033
Pre1 .147 .244 .441** .065 -.131
Pos1 .263* .383** .374** .062 -.136 .696**
Com1 .204 .307* .110 .175 .485** -.216 -.155
Pre2 .395** .501** .464** .116 -.091 .702** .812** -.049
Pos2 .172 .222 .378** .156 -.105 .593** .685** .048 .723**
Com2 .269* .397** .224 .307** .276** -.057 .027 .407** .109 .204
Pre3 .259 .412** .508** .109 -.039 .690** .700** -.110 .664** .594** .118
Pos3 .031 .143 .284* .100 -.233 .709** .589** -.165 .548** .497** -.031 .734**
Com3 .264 .207 .190 .260 .321* -.027 .064 .140 .199 .107 .451** .145 .052
Note: **p<.01, *p<.05
GAM = General Academic Motivation ARM = Academic Reading Motivation ELM = EFL Learning Motivation ERC = EFL Reading Comprehension
ARC = Academic Reading Comprehension in L1
Pre1, Pre2, Pre3 = Pre-reading Situational Motivation measured the first, second, and third time Post1, Post 2, Post3 = Post-reading Situational Motivation measured the first, second, and third time Com1, Com2, Com3 = Comprehension measured the first, second, and third time
Another type of dependent variable, EAP Reading Comprehension, showed different
relations with pretest variables. All three comprehension scores were significantly
correlated with L1 Academic Reading Motivation, and the second Comprehension score was
additionally correlated with EFL Reading Comprehension. Comprehension scores measured
at the first and the second time were also correlated with L1 Academic Reading Motivation;
the second Comprehension score was additionally correlated with General Academic Motivation. However, EAP Reading Comprehension was never correlated with EFL Learning Motivation. In summary, Situational Motivation was constantly correlated with EFL Learning Motivation and at the same time uncorrelated with proficiency scores, while Comprehension was more closely correlated with proficiency on L1 Academic Reading Comprehension and uncorrelated with EFL Learning Motivation.
Among pretest variables, the three motivational scales (General Academic Motivation, L1 Academic Reading Motivation and EFL Learning Motivation) were all correlated with one another at a .01 level, but the two competency measures (EFL Reading Comprehension and L1 Academic Reading Comprehension) were not correlated. Among dependent variables, Pre-reading Situational Motivation was highly correlated with Post-reading Situational Motivation, but neither of them correlated with EAP Reading Comprehension. The correlation coefficients shown in Table 27 were examined as criteria for selecting covariates in later ANCOVA analyses.
Effects on Pre-reading and Post-reading Motivation
Same analyses done for Site A were repeated here for Site B on Pre-reading and Post-reading Situational Motivation.
Pre-reading Situational Motivation
A 3 by 3 ANCOVA was performed to examine possible treatment (Vocabulary List, Self Appraisal, and Case Study), article (Job Satisfaction, Early Motivation Theories, and Leadership), and interactive effects on Pre-reading Situational Motivation. Based on
correlation coefficients from Table 27, L1 Academic Reading Motivation and EFL Learning
Motivation were used as covariates in the analysis. General Academic Motivation was not
used because it was correlated with only one of the three Pre-reading Situational Motivation
scores and it was highly correlated with L1 Academic Reading Motivation.
Results of ANCOVA analysis on Pre-reading Motivation for Site A are presented in Table 28. There was significant interaction between article and treatment. No significant article main effect or treatment main effect was observed. Follow-up tests were conducted to evaluate the pairwise differences among the means of different treatments for each of the three articles. The Self Appraisal treatment used for the third article Leadership showed significantly higher Pre-reading Situational Motivation scores than the Case Study treatment for the same article, t (31) = 2.36, p = .03. There were no significant differences between other pairs of comparison.
Table 28. ANCOVA Summary for Pre-reading Situational Motivation, Site B
Source df F p η2
Covariate 1 – ARM 1 8.565 .004 .051
Covariate 2 – ELM 1 24.585 .000 .132
Treatment 2 .370 .691 .005
Article 2 .616 .542 .008
Treatment*Article 4 2.771 .029 .064
Error 161 Total 172
Note: ARM = L1 Academic Reading Motivation; ELM = EFL Learning Motivation
The mean scores of Pre-reading Situational Motivation by article and treatment are
depicted in Figure 11. In reading the first article Job Satisfaction, Case Study produced
higher Pre-reading Situational Motivation; while in reading the third article Leadership, Self
Appraisal aroused the highest level of Pre-reading Situational Motivation. It seemed
different types of treatments worked differently for different articles. This phenomenon will
be discussed in Chapter Five.
ARTICLE
Leadership Early Mot. Theories
Job Satisfaction
Estimated Marginal Means
50
48
46
44
42
40
Treatment
VOC SAP CAS
Figure 11. Means plot of pre-reading situational motivation, Site B
Note: VOC = Vocabulary List; SAP = Self Appraisal; CAS = Case Study
Post-reading Situational Motivation
A 3 by 3 two-way ANCOVA was performed to examine possible treatment (Vocabulary List, Self Appraisal, and Case Study), article (Job Satisfaction, Early Motivation Theories, and Leadership), and interactive effects on Post-reading Situational Motivation. Based on
correlation coefficients from Table 27, L1 Academic Reading Motivation and EFL Learning
Motivation were used as covariates in the analysis. General Academic Motivation was not
chosen because, first, it was correlated with L1 Academic Reading Motivation and, second, it
was correlated with Post-reading Situational Motivation with a smaller magnitude than L1
Academic Reading Motivation. Results of ANCOVA analysis on Post-reading Motivation
for Site B were presented in Table 29. There was no interaction between article and
treatment. Treatment and article main effects were both found to be insignificant.
Table 29. ANCOVA Summary for Post-reading Situational Motivation, Site B
Source df F p η2
Covariate 1 – ARM 1 2.099 .149 .013
Covariate 2 – ELM 1 12.068 .001 .069
Treatment 2 .854 .428 .010
Article 2 1.100 .335 .013
Treatment*Article 4 2.035 .092 .048
Error 162 Total 173
Note: ARM = L1 Academic Reading Motivation; ELM = EFL Learning Motivation
The mean scores of Post-reading Situational Motivation by article and treatment are depicted in Figure 12. By comparing treatments, it was found that the Case Study treatment produced higher Post-reading Situational Motivation than the other two treatments for the first article Job Satisfaction. Self Appraisal treatment induced the highest Post-reading Situational Motivation in the third article, Leadership, in comparison with the other two treatments.
ARTICLE
Leadership Early Mot. Theories
Job Satisfaction
Estimated Marginal Means
46
44
42
40
38
36
34
Treatment
VOC SAP CAS
Figure 12. Means plot of post-reading situational motivation, Site B
Note: VOC = Vocabulary List; SAP = Self Appraisal; CAS = Case Study
Effects on Comprehension
A 3 by 3 ANCOVA was performed to examine possible treatment (Vocabulary List, Self Appraisal, and Case Study), article (Job Satisfaction, Early Motivation Theories, and Leadership), and interactive effects on comprehension. Based on correlation analysis,
Academic Reading Motivation, EFL Reading Comprehension, and L1 Academic Reading Comprehension were used as covariates in the ANCOVA analysis. General Academic Motivation was not chosen as one of the covariates for two reasons. First, it was correlated with only one of the three comprehension scores. Second, it was highly correlated with Academic Reading Motivation (p = .64), which had already been chosen as a covariate.
Results of ANCOVA analysis on Comprehension for Site B are presented in Table 30. There was no interaction between article and treatment. Significant article effect was observed; but treatment did not have a significant effect on participants’ Comprehension. Post-hoc analysis indicated that comprehension on the second article was significantly higher than that on the third article, t (46) = 3.04, p = .00. Comparisons for other pairs did not yield significant results.
Table 30. ANCOVA Summary for Comprehension, Site B
Source df F p η2
Covariate 1 – ARM 1 5.678 .018 .034
Covariate 2 – ERC 1 8.777 .004 .052
Covariate 3 – ARC 1 16.967 .000 .095
Treatment 2 .629 .534 .008
Article 2 4.626 .011 .054
Treatment*Article 4 1.290 .276 .031
Error 161 Total 173
Note: ARM = L1 Academic Reading Motivation; ERC = EFL Reading Comprehension;
ARC = L1 Academic Reading Comprehension
The mean scores of Comprehension by article and treatment are depicted in Figure 13.
By comparing treatments, it was found that the Vocabulary List treatment produced the
highest comprehension scores in the first article Job Satisfaction but not in the other two
articles. Comprehension was much higher for the second article Early Motivation Theories across three treatments. Comprehension scores among treatments, except the Vocabulary List treatment for the first article, were very close.
ARTICLE
Leadership Early Mot. Theories
Job SatisfactionEstimated Marginal Means
12.5
12.0
11.5
11.0
10.5
Treatment
VOC SAP CAS
Figure 13. Means plot of comprehension, Site B
Note: VOC = Vocabulary List; SAP = Self Appraisal; CAS = Case Study
Analyses of Preferences for Treatments and the Reasons
Two 3 by 3 contingency table analyses were conducted to evaluate the homogeneity of proportions of each group’s most and least preferred choices. No significant difference was found among preferences for three groups of participants (Pearson (4, N=53) = 3.07, p
= .55, Cramer’s V = .17). However, there was significant difference among groups for the least preferred treatments (Pearson (4, N = 53) = 13.58, p = .01, Cramer’s V = .36). The observed counts and percentages are shown in Table 31. Follow-up pairwise comparisons were conducted to evaluate the difference among participant choices. The significant pairwise differences were between Vocabulary List and Case Study treatments (Pearson (4,
χ
2χ
2χ
2N = 53) = 9.68, p = .01, Cramer’s V = .57) and between Self Appraisal and Case Study
treatments (Pearson (4, N = 53) = 8.80, p = .01, Cramer’s V = .57). In Site B, significantly fewer participants chose Case Study as their least preferred treatment than those choosing the other two treatments.
χ
2Table 31. Participants’ Preference over Treatments by Experimental Group, Site B Count (%) Most Preferred Treatment Least Preferred Treatment
VOC SAP CAS Total VOC SAP CAS Total
Group 1 (n=14)
5
(36%)5
(36%)4
(29%)14 3
(21%)4
(29%)7
(50%)14
Group 2 (n=21)
5
(24%)7
(33%)9
(43%)21 11
(52%)9
(43%)1
(5%)21
Group 3 (n=18)
5
(28%)3
(17%)10
(56%)18 6
(33%)10
(56%)2
(11%)18
Total
15 15 23 53 20 23 10 53
Note: VOC = Vocabulary List; SAP = Self Appraisal; CAS = Case Study
The analysis of Site B participants’ reported reasons for preference showed that those who chose Vocabulary List to be their most preferred treatment liked it because: (a) it aided comprehension (7 tokens); (b) vocabulary was their biggest obstacle to reading (5 tokens);
and (c) it saved their time in looking up words (3 tokens). Students chose Vocabulary List as the least preferred treatment because: (a) it was boring and could not interest them (7 tokens);
(b) vocabulary was something they could resolve by themselves (5 tokens); (c) it was not necessary or it was useless (2 tokens); (d) it made one to rely on L1 (1 token); (e) vocabulary was not the main purpose of reading so it should not take too much time (1 token); (f) it didn’t provide any association with the English text (1 token).
As for the treatment of Self Appraisal, the reasons for participants’ preference included:
(a) it was more interesting (10 tokens); (b) it facilitated self-understanding (5 tokens); (c) it was easier (2 tokens); and (d) it aided comprehension (1 token). The reasons for students to dislike Self Appraisal include: (a) it did not aid comprehension (12 tokens); (b) it was not directly relevant to the articles being read (6 tokens); (c) it was too subjective (1 token); and (d) it was too theoretical (1 token).
For the treatment of Case Study, those participants who chose it as their most preferred
treatment said: (a) it helped them to think about the main ideas of the article or prepared them for later reading (13 tokens); (b) it aroused their interests (4 tokens); (c) it broadened their perspectives (2 tokens); (d) it was more practical (1 tokens); and (e) it was more impressive (1 token). Those who disliked Case Study said that: (a) it was too complicated and too heavy for them (6 tokens); (b) it was boring (5 tokens); (c) it couldn’t aid comprehension of the English text (2 tokens); (d) it was not familiar to them (1 token); and (e) it was hard for them to focus on (1 token). The above results are summarized in Table 32.
Table 32. Summary of Positive and Negative Feelings toward Treatments, Site B
Vocabulary List Self Appraisal Case Study
Positive
aided comprehension (7) vocabulary obstacle (5) saved time (3)
interesting (10) self-understanding (5) easy (2)
aid comprehension (1)
prepared for reading (13) aroused interest (4) broaden perspective (2) more practical (1) more impressive (1)
Negative
boring (7) self help (5) unnecessary (2) rely on L1 (1) not the purpose (1) no association (1)
not aid comprehension (12) not relevant to text (6) too subjective (1) too theoretical (1)
too complicated (6) boring (5)
not aid comprehend (2) not familiar (1)
not relevant (1) hard to focus (1)
Note: Number of tokens for each type are shown in parentheses.
To sum up, participants’ written responses indicated that Vocabulary List was preferred mainly because it aided comprehension directly; Self-Appraisal was liked mainly because it was interesting; Case Study was chosen mainly because it prepared them for reading and broadened their perspectives. As for why the treatments were disliked, the main reasons for Vocabulary List was boring; for Self-Appraisal was the lack of assistance for comprehension;
and for Case Study was its difficulty.
Comparison of Participant Characteristics by Their Preferences
Two-way MANOVA was conducted to see if there existed relation between preference
groups and pretest variables. The two independent variables were participants’ reported preference and dislike. The dependent variables were the 5 pretest scores. For Site B, no significant difference was found among the three groups of treatment preference on the pretest variables, Wilks’ λ= .79, F (5, 49) = 1.16, p = .33, multivariate = .11. However, significant difference was found among the three dislike groups on the pretest variables, Wilks’ λ= .66, F (5, 49) = 2.10, p = .03, multivariate = .19. No significant difference was found for the interaction of the two factors (most and least preferred treatments), Wilks’
λ= .87, F (5, 49) = 1.36, p = .26, multivariate = .13.
η
2η
2η
2In order to compare among groups of participants choosing Vocabulary List, Self Appraisal, and Case Study as their dislike, one-way analyses of variance (ANOVA) on each of the dependent variables (including General Academic Motivation, Academic Reading Motivation, EFL Learning Motivation, EFL Reading Comprehension, and L1 Academic Reading Comprehension) were conducted as follow-up tests to the MANOVA. The ANOVA was significant on General Academic Motivation, F (2, 52) = 5.30, p = .01, = .17 and on EFL Reading Comprehension, F (2, 52) = 3.84, p = .03, = .13. No significant difference was found on Academic Reading Motivation, F (2, 52) = .50, p = .61, = .02; on EFL Learning Motivation, F (2, 52) = .13, p = .88, = .01; on EFL Reading Comprehension; or on L1 Academic Reading Comprehension, F (2, 52) = .07, p = .93, = .00.
η
22