人力資源調 查 統 計 年 報
YEARBOOK OF MANPOWER SURVEY STATISTICS
行政院主計總處
中華民國 年 月編印
DIRECTORATE-GENERAL OF BUDGET, ACCOUNTING AND STATISTICS, EXECUTIVE YUAN, REPUBLIC OF CHINA, MARCH
2015 民國 104 年
105 3
2016
人力資源調 查 統 計 年 報
YEARBOOK OF MANPOWER SURVEY STATISTICS
行政院主計總處
中華民國 年 月編印
DIRECTORATE-GENERAL O DIRECTORATE-GENERAL O
DIRECTORATE-GENERAL F BUDGET, ACC ACC A OUNTING AND STATISTICS, EXECUTIVE YUAN, REPUBLIC OF CHINA, MARCH
2015 民國 104 年
105 3
2016
人力資源調查統計年報
發 行 人:石素梅
發行機關:行政院主計總處
地址:臺北市廣州街 2 號
電話: (02)2380-3601〜3621 印 刷 所:科藝彩色製版印刷有限公司
地址:臺北市大理街 157 號 3 樓之 2
電話: (02) 2302-0406 經 銷 者:中國統計學社
地址:臺北市廣州街 2 號
電話: (02)2380-3656 五南文化廣場
地址:臺中市中山路 6 號
電話: (04)2226-0330 國家書店松江門市
地址:臺北市松江路 209 號 1F
電話: (02)2518-0207 國家網路書店
http://www.govbooks.com.tw
出版年月:中華民國 105 年 3 月
創刊年月:中華民國 76 年
定 價:每本新臺幣 250 元
本著作採創用 CC「姓名標示-非商業性」授權條款台灣 2.5 版釋出,
限於標示著作人姓名及非營利性目的之條件下,得利用本著作。
G P N:2006700036 I S S N:1028-7302
人力資源調查統計年報
發 行 人:石素梅
發行機關:行政院主計總處
地址:臺北市廣州街 2 號
電話: (02)2380-3601〜3621 印 刷 所:科藝彩色製版印刷有限公司
地址:臺北市大理街 157 號 3 樓之 2
電話: (02) 2302-0406 經 銷 者:中國統計學社
地址:臺北市廣州街 2 號
電話: (02)2380-3656 五南文化廣場
地址:臺中市中山路 6 號
電話: (04)2226-0330 國家書店松江門市
地址:臺北市松江路 209 號 1F
電話: (02)2518-0207 國家網路書店
http://www.govbooks.com.tw
出版年月:中華民國 105 年 3 月
創刊年月:中華民國 76 年
定 價:每本新臺幣 250 元
本著作採創用 CC「姓名標示-非商業性」授權條款台灣 2.5 版釋出,
限於標示著作人姓名及非營利性目的之條件下,得利用本著作。
G P N:2006700036
I S S N:1028-7302
人力資源調查統計年報
發 行 人:石素梅
發行機關:行政院主計總處
地址:臺北市廣州街 2 號
電話: (02)2380-3601〜3621 印 刷 所:科藝彩色製版印刷有限公司
地址:臺北市大理街 157 號 3 樓之 2
電話: (02) 2302-0406 經 銷 者:中國統計學社
地址:臺北市廣州街 2 號
電話: (02)2380-3656 五南文化廣場
地址:臺中市中山路 6 號
電話: (04)2226-0330 國家書店松江門市
地址:臺北市松江路 209 號 1F
電話: (02)2518-0207 國家網路書店
http://www.govbooks.com.tw
出版年月:中華民國 105 年 3 月
創刊年月:中華民國 76 年
定 價:每本新臺幣 250 元
本著作採創用 CC「姓名標示-非商業性」授權條款台灣 2.5 版釋出,
限於標示著作人姓名及非營利性目的之條件下,得利用本著作。
G P N:2006700036 I S S N:1028-7302
(1)
前 言
人力資源調查統計,為規劃人力資源分配,策訂國家建設計畫之重要參據,
現代國家莫不積極推動辦理此項調查,冀能定期獲得可靠之人力統計資料。我國 臺灣地區天然資源有限,人力遂成為主要之生產要素,如何有效運用人力資源,
解決人力市場供需調節等問題,尤屬重要。因此政府為明瞭臺灣地區人力供應情 形,勞動力之數量、品質、就業、失業狀況與人力發展趨勢,本總處乃按月以家 庭為對象,查編人力資源統計,同時為提升統計應用時效,已將其調查結果,編 製人力資源統計月報,定期刊布。
本調查係採「分層二階段隨機抽樣法(Stratified two-stage random sampling method)」,就第一階段先抽出約 513 個樣本村里,第二階段再抽出約 20,500
樣本戶,調查樣本總抽出率約 2.5 ‰,兼採派員面訪與電話訪問兩種調查方法。
民國 82 年以前,以臺灣省、臺北市、高雄市為抽樣副母體,加以推計整個臺灣 地區重要人力基本特徵值,若欲對各縣市別之勞動力狀況及失業等樣本稀少之項 目,按月編製交叉分類統計,作精細而深入分析則尚有所困難。為彌補此種缺憾,
乃自 67 年起,逐年將 1 至 12 月有關樣本資料加總推算,彙編「勞動力調查研究 分析」一種,用以彌補按月發表資料之不足。自 82 年 1 月起改按臺灣地區 23 個 縣市為個別單一副母體抽樣,按月發布縣市別人力重要指標;惟考量統計結果之 精確度,自 94 年 6 月起縣市別重要勞動統計指標改以按半年之累計平均值發布。
本調查多年來均與受僱員工調查統計結果,合併編印「勞工統計年報」一種,
分送各界參用。為保持人力資源調查統計結果之完整性,並簡化刊物種類與篇 幅,爰自 77 年起比照月報名稱,將原「勞工統計年報」中有關本調查結果部分 與「勞動力調查研究分析」合併刊印,另增列各類補充專案調查重要結果,追溯 估計與調整銜接結果連同有關國際人力統計資料等,一併編輯為「人力資源調查 統計年報」一種,並改以資料之主體年份為年報之年別名稱,俾利使用資料者之 研參應用。
本年報係將按月人力資源調查統計結果加以分類、整理彙編而成,期能增廣 下列用途:
(一)綜合陳示臺灣地區人力資源結構、就業、失業等統計之完整時間數列,藉以 觀察既往變遷,測知未來發展情勢,增進統計效用,提供人力規劃、職業訓 練及就業服務等施政決策之參據。
(1)
(2)
(二)運用全年調查較大樣本資料,進而作較細之分類統計,如按各行業、職業別、
縣市別就業、失業人口等,依其各項特性編製交叉統計,以提升統計層次,
而增廣研究分析之用途。
(三)便利國際人力統計資料之比較,以促進國際統計交流,增強國際間之了解與合 作。
為配合政府 e 化及響應環保,「人力資源統計月報」自 96 年 2 月(即 399 期;資料時期為 96 年 1 月)起停印紙本,嗣後如需查閱,請逕至本總處網站
(http://www.dgbas.gov.tw)點選「出版品及普(抽)查資料」→「統計電子 書」→「就業失業統計」→「月報」查詢;或請參閱隨書贈送之光碟片。
本調查雖已辦理有年,惟因社會環境變遷,經濟快速發展,各界需求人力 統計,莫不較前倍加關切,本刊倘有疏漏之處,尚祈不吝賜正,藉資改進參考。
此外,在推動調查及編算過程中,由於各受訪家庭之充分合作,提供翔實資料,
方能按期編印發表,謹此併致謝忱。
(2)
(二)運用全年調查較大樣本資料,進而作較細之分類統計,如按各行業、職業別、
縣市別就業、失業人口等,依其各項特性編製交叉統計,以提升統計層次,
而增廣研究分析之用途。
(三)便利國際人力統計資料之比較,以促進國際統計交流,增強國際間之了解與合 作。
為配合政府 e 化及響應環保,「人力資源統計月報」自 96 年 2 月(即 399 期;資料時期為 96 年 1 月)起停印紙本,嗣後如需查閱,請逕至本總處網站
(http://www.dgbas.gov.tw)點選「出版品及普(抽)查資料」→「統計電子 書」→「就業失業統計」→「月報」查詢;或請參閱隨書贈送之光碟片。
本調查雖已辦理有年,惟因社會環境變遷,經濟快速發展,各界需求人力 統計,莫不較前倍加關切,本刊倘有疏漏之處,尚祈不吝賜正,藉資改進參考。
此外,在推動調查及編算過程中,由於各受訪家庭之充分合作,提供翔實資料,
方能按期編印發表,謹此併致謝忱。
(3)
凡 例
一、本年報之編印目的在提供有關臺灣地區人力資源調查統計資料,俾便瞭解 15 歲以上民間人口之質量、勞動力、就業、失業等狀況,以為釐訂經建計 畫、人力發展、就業輔導及勞工政策等參考依據。
二、本年報所載資料由本總處負責調查、整理及統計分析,每月調查樣本戶數約 20,500 戶。
三、本年報所載資料如有更新數字均予以修正,凡與前期內容不同者,悉以本年 報數字為準。
四、本年報為便於國際間參考及交流起見,除提要分析、性別專題分析外,一律 中英文對照。
五、本年報所用符號意義如下 0 表示數字不及一單位
— 表示無數字
… 表示數字不明
六、本年報資料因四捨五入關係,部分總計數字不等於細項數字之和。
(4)
EXPLANATORY NOTES
1. The Yearbook of Manpower Statistics is to provide associated statistics in Taiwan Area, in terms of quantity, quality and status about the labor force, employment and unemployment of civilian population aged 15 years and over, for economic planning, manpower development, employment service and labor policy.
2. The data presented in this year book except the international are responsible to the DGBAS for survey data processing analysis the sample are about 20,500 households every month.
3. The figures given in this issue may not agree with the corresponding figures in the previous issue due to the corrections and revisions made in exchange of base.
4. In order to facilitate reference and promote inter-changeability of statistical data among nations, the year book is written on a bilingual basis except the prefatory analysis, special topics etc.
5. The following symbols are used for tables:
0 less than a unit of value
— none
… not available
6. The figures of total item in this issue may not agree with the sums of detail due to omitting the decimal fraction less than 0.5 and counting all the others.
EXPLANATORY NOTES
1. The Yearbook of Manpower Statistics is to provide associated statistics in Taiwan Area, in terms of quantity, quality and status about the labor force, employment and unemployment of civilian population aged 15 years and over, for economic planning, manpower development, employment service and labor policy.
2. The data presented in this year book except the international are responsible to the DGBAS for survey data processing analysis the sample are about 20,500 households every month.
3. The figures given in this issue may not agree with the corresponding figures in the previous issue due to the corrections and revisions made in exchange of base.
4. In order to facilitate reference and promote inter-changeability of statistical data among nations, the year book is written on a bilingual basis except the prefatory analysis, special topics etc.
5. The following symbols are used for tables:
0 less than a unit of value
— none
… not available
6. The figures of total item in this issue may not agree with the sums of detail due to
omitting the decimal fraction less than 0.5 and counting all the others.
(4)
EXPLANATORY NOTES
1. The Yearbook of Manpower Statistics is to provide associated statistics in Taiwan Area, in terms of quantity, quality and status about the labor force, employment and unemployment of civilian population aged 15 years and over, for economic planning, manpower development, employment service and labor policy.
2. The data presented in this year book except the international are responsible to the DGBAS for survey data processing analysis the sample are about 20,500 households every month.
3. The figures given in this issue may not agree with the corresponding figures in the previous issue due to the corrections and revisions made in exchange of base.
4. In order to facilitate reference and promote inter-changeability of statistical data among nations, the year book is written on a bilingual basis except the prefatory analysis, special topics etc.
5. The following symbols are used for tables:
0 less than a unit of value
— none
… not available
6. The figures of total item in this issue may not agree with the sums of detail due to omitting the decimal fraction less than 0.5 and counting all the others.
( 5)
目 次
前 言 ... ( 1)
凡 例 ... ( 3)
壹、人力資源調查提要分析 ... (14)
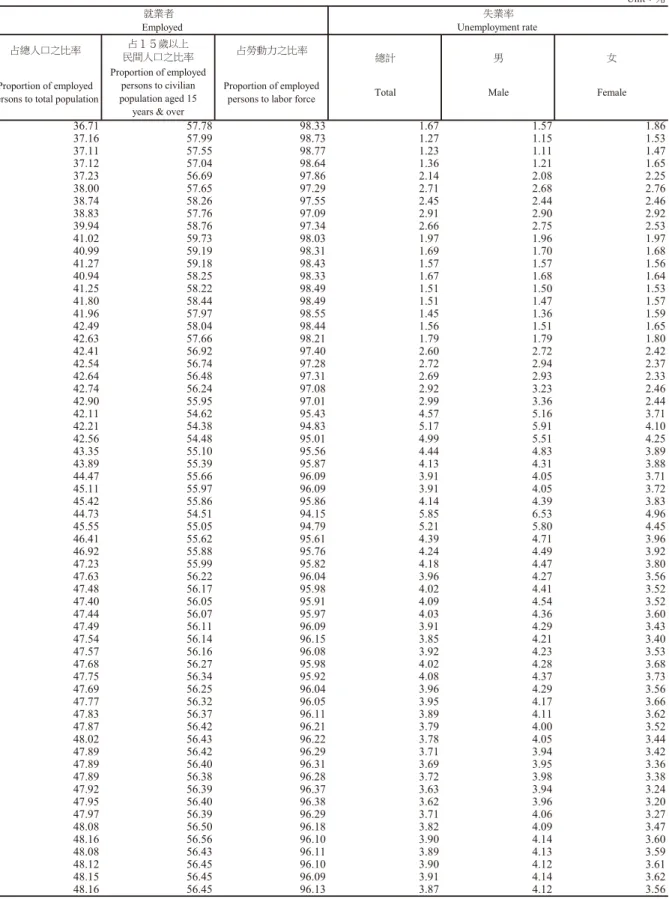
貳、人力資源調查統計結果表 甲、歷年及月別數列統計 表 1 歷年人力資源調查重要結果 ... 2
表 2 歷年人力資源調查重要指標 ... 4
表 3 歷年人力資源調查重要指數 ... 6
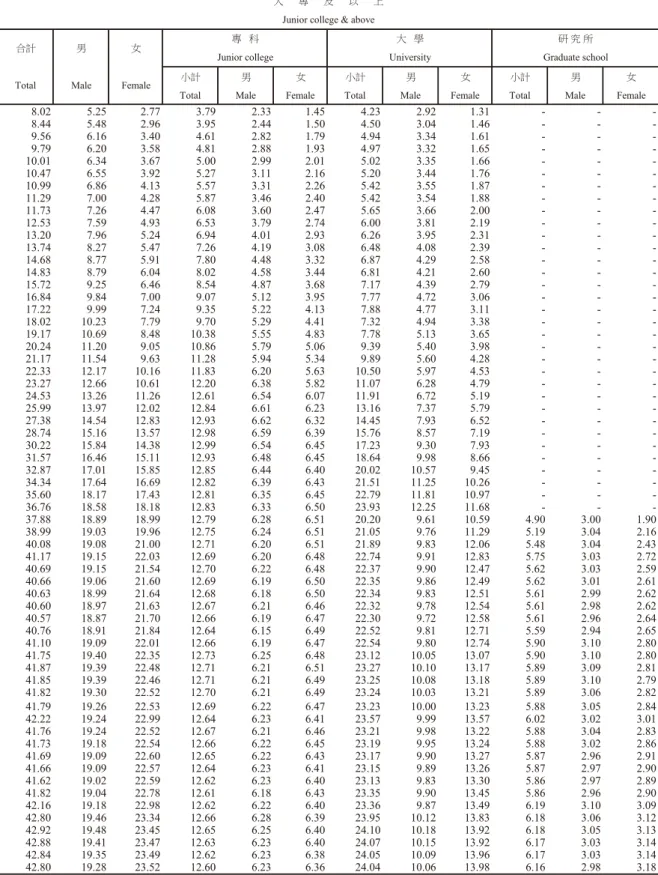
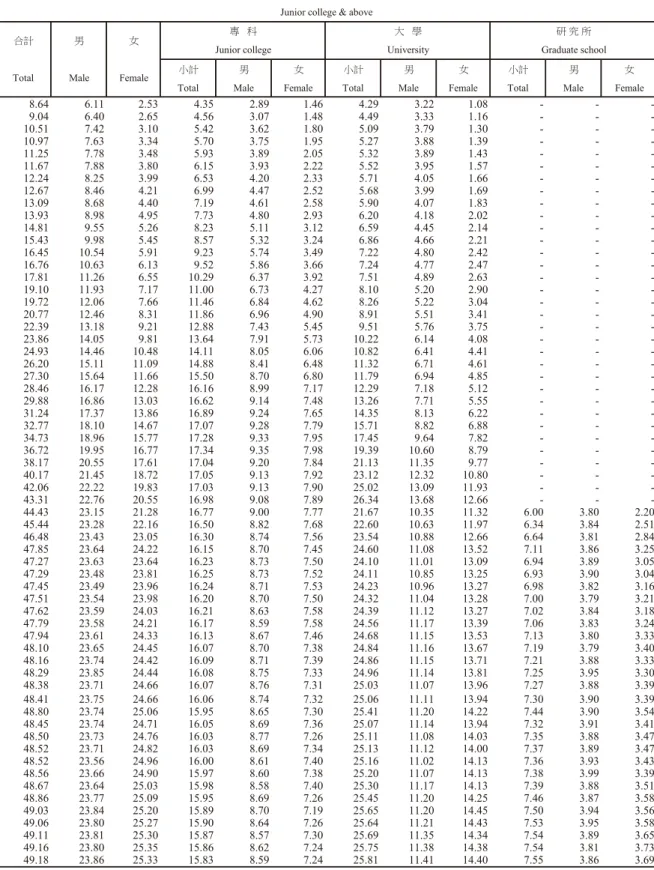
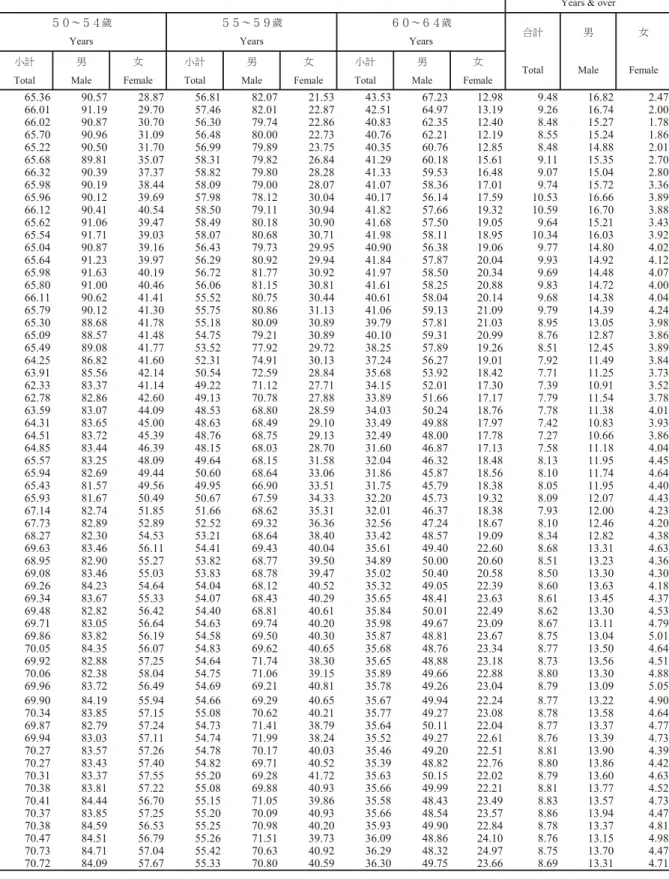
表 4 歷年15歲以上民間人口之年齡 ... 8
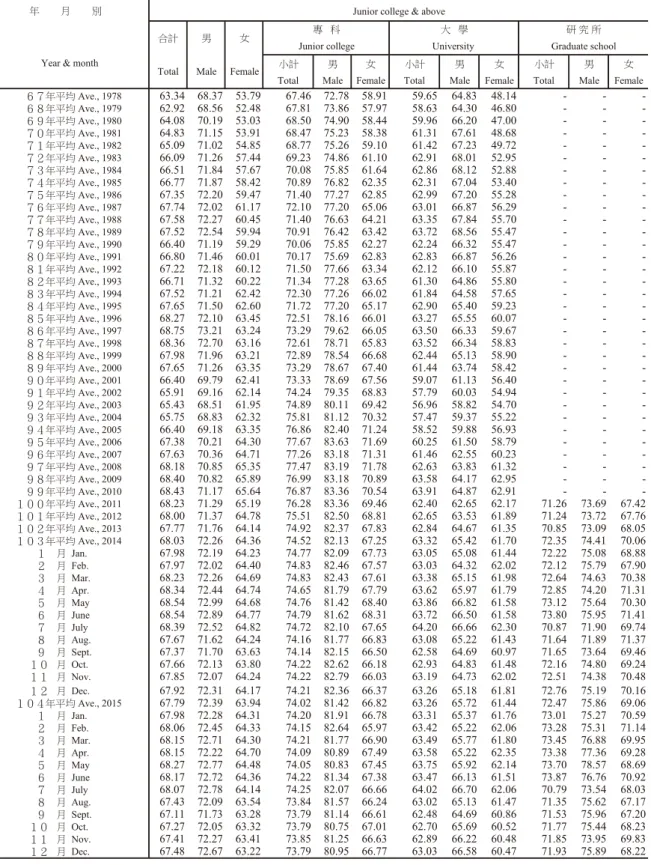
表 5 歷年15歲以上民間人口之教育程度 ... 16
表 6 歷年勞動力之年齡 ... 22
表 7 歷年勞動力之教育程度 ... 30
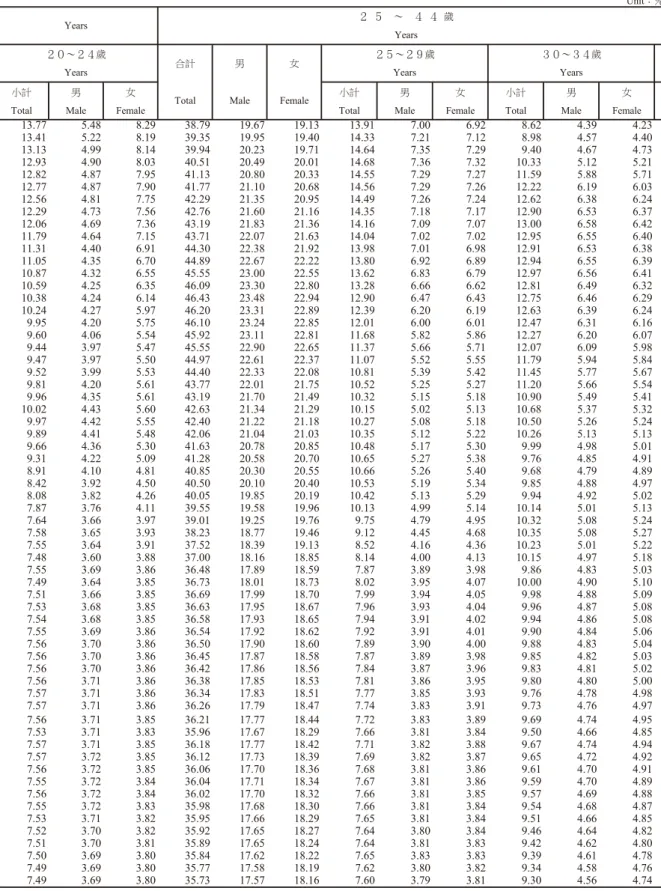
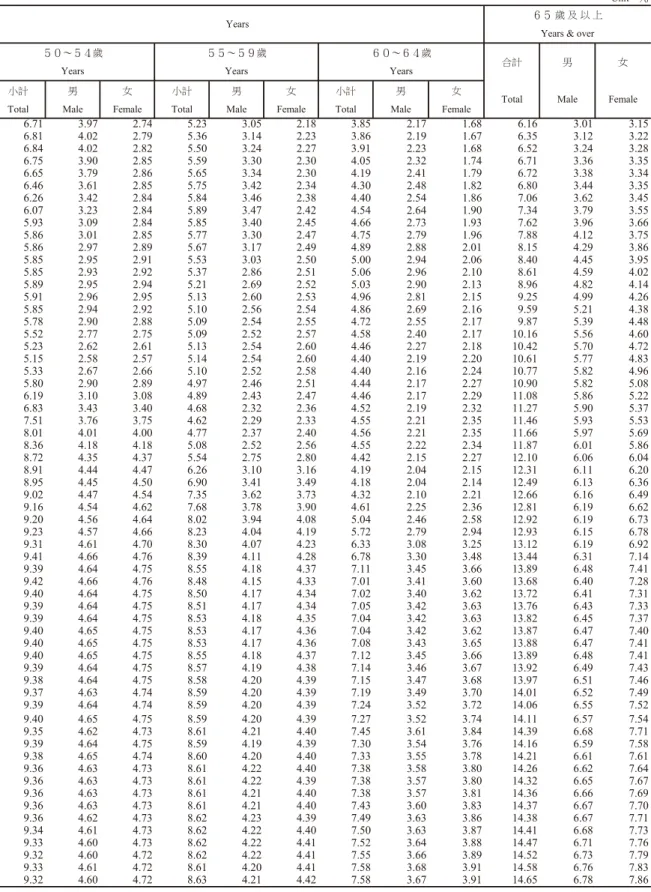
表 8 歷年年齡組別勞動力參與率 ... 36
表 9 歷年教育程度別勞動力參與率 ... 40
表 10 歷年婚姻狀況別勞動力參與率 ... 43
表 11 歷年就業者之年齡 ... 44
表12 歷年就業者之教育程度 ... 52
表13 歷年就業者之行業 ... 58
表 14 歷年就業者之職業 ... 82
表 15 歷年就業者之從業身分 ... 90
表16 歷年就業者之服務場所員工人數 ... 94
表17 歷年失業者按初次尋職者與非初次尋職者分 ... 100
表 18 歷年失業者之年齡 ... 102
表 19 歷年年齡組別失業率 ... 106
目 次 前 言... ( 1)
凡 例 ... ( 3)
壹、人力資源調查提要分析 ... (14)
貳、人力資源調查統計結果表 甲、歷年及月別數列統計 表 1 歷年人力資源調查重要結果... 2
表 2 歷年人力資源調查重要指標... 4
表 3 歷年人力資源調查重要指數... 6
表 4 歷年15歲以上民間人口之年齡... 8
表 5 歷年15歲以上民間人口之教育程度... 16
表 6 歷年勞動力之年齡... 22
表 7 歷年勞動力之教育程度... 30
表 8 歷年年齡組別勞動力參與率... 36
表 9 歷年教育程度別勞動力參與率... 40
表 10 歷年婚姻狀況別勞動力參與率... 43
表 11 歷年就業者之年齡... 44
表12 歷年就業者之教育程度... 52
表13 歷年就業者之行業... 58
表 14 歷年就業者之職業... 82
表 15 歷年就業者之從業身分... 90
表16 歷年就業者之服務場所員工人數... 94
表17 歷年失業者按初次尋職者與非初次尋職者分... 100
表 18 歷年失業者之年齡... 102
表 19 歷年年齡組別失業率... 106
( 6)
表 20 歷年失業者之教育程度 ... 110
表 21 歷年教育程度別失業率 ... 113
表22 歷年失業者之平均失業週數 ... 116
表 23 歷年非勞動力之未參與勞動原因 ... 118
乙、當年交叉分類統計 一、地區別統計 表24 人力資源調查重要結果 ... 120
表 25 人力資源調查重要指標 ... 122
表 26 15歲以上民間人口之教育程度與年齡 ... 124
表 27 勞動力之教育程度與年齡 ... 128
表28 年齡組別勞動力參與率 ... 132
表 29 教育程度別勞動力參與率 ... 136
表 30 婚姻狀況別勞動力參與率 ... 139
表 31 就業者之教育程度與年齡 ... 140
表32 就業者之行業 ... 144
表33 就業者之職業 ... 156
表 34 就業者之從業身分 ... 160
表 35 失業者之教育程度與年齡 ... 164
表36 年齡組別失業率 ... 166
表37 教育程度別失業率 ... 170
表 38 非勞動力之未參與勞動原因 ... 174
二、勞動力 表 39 15歲以上民間人口之勞動力狀況與年齡-按教育程度分 ... 178
表 40 15歲以上民間人口之勞動力狀況-按婚姻狀況分 ... 180
表 41 婚姻狀況別勞動力參與率-按年齡分 ... 181
表42 婚姻狀況別勞動力參與率-按教育程度分 ... 182
表 43 教育程度別勞動力參與率-按年齡分 ... 183
表 20 歷年失業者之教育程度... 110
表 21 歷年教育程度別失業率... 113
表22 歷年失業者之平均失業週數... 116
表 23 歷年非勞動力之未參與勞動原因... 118
乙、當年交叉分類統計 一、地區別統計 表24 人力資源調查重要結果... 120
表 25 人力資源調查重要指標... 122
表 26 15歲以上民間人口之教育程度與年齡... 124
表 27 勞動力之教育程度與年齡... 128
表28 年齡組別勞動力參與率... 132
表 29 教育程度別勞動力參與率... 136
表 30 婚姻狀況別勞動力參與率... 139
表 31 就業者之教育程度與年齡... 140
表32 就業者之行業... 144
表 33 就業者之職業... 156
表 34 就業者之從業身分... 160
表 35 失業者之教育程度與年齡... 164
表36 年齡組別失業率... 166
表 37 教育程度別失業率... 170
表 38 非勞動力之未參與勞動原因... 174
二、勞動力 表 39 15歲以上民間人口之勞動力狀況與年齡-按教育程度分... 178
表 40 15歲以上民間人口之勞動力狀況-按婚姻狀況分... 180
表 41 婚姻狀況別勞動力參與率-按年齡分... 181
表42 婚姻狀況別勞動力參與率-按教育程度分... 182
表 43 教育程度別勞動力參與率-按年齡分... 183
( 6)
表 20 歷年失業者之教育程度 ... 110
表 21 歷年教育程度別失業率 ... 113
表22 歷年失業者之平均失業週數 ... 116
表 23 歷年非勞動力之未參與勞動原因 ... 118
乙、當年交叉分類統計 一、地區別統計 表24 人力資源調查重要結果 ... 120
表 25 人力資源調查重要指標 ... 122
表 26 15歲以上民間人口之教育程度與年齡 ... 124
表 27 勞動力之教育程度與年齡 ... 128
表28 年齡組別勞動力參與率 ... 132
表 29 教育程度別勞動力參與率 ... 136
表 30 婚姻狀況別勞動力參與率 ... 139
表 31 就業者之教育程度與年齡 ... 140
表32 就業者之行業 ... 144
表33 就業者之職業 ... 156
表 34 就業者之從業身分 ... 160
表 35 失業者之教育程度與年齡 ... 164
表36 年齡組別失業率 ... 166
表37 教育程度別失業率 ... 170
表 38 非勞動力之未參與勞動原因 ... 174
二、勞動力 表 39 15歲以上民間人口之勞動力狀況與年齡-按教育程度分 ... 178
表 40 15歲以上民間人口之勞動力狀況-按婚姻狀況分 ... 180
表 41 婚姻狀況別勞動力參與率-按年齡分 ... 181
表42 婚姻狀況別勞動力參與率-按教育程度分 ... 182
表 43 教育程度別勞動力參與率-按年齡分 ... 183
( 7) 表 44 15歲以上女性民間人口之年齡-按勞動力狀況、從業身分與婚姻 狀況分 ... 184
三、就業 表 45 就業者之教育程度與年齡-按行業分 ... 186
表46 就業者之教育程度與年齡-按職業分 ... 192
表 47 就業者之教育程度與年齡-按從業身分分 ... 194
表48 就業者之職業-按行業分 ... 196
表 49 就業者之教育程度-按年齡分 ... 202
表 50 就業者之從業身分-按中分類行業分 ... 203
表51 就業者之從業身分-按中分類職業分 ... 207
表 52 就業者之平均每週主要工作時數-按中分類行業與從業身分分 ... 210
表53 就業者之每週工作時數-按年齡分 ... 214
表 54 就業者之主要工作每週工作時數-按年齡分 ... 216
表 55 就業者之主要工作每週工作時數-按行業分 ... 218
表56 就業者之主要工作每週工作時數-按從業身分分 ... 222
表 57 就業者之平均每週主要工作時數-按行業與職業分 ... 224
四、失業 表 58 失業者之教育程度-按年齡分 ... 228
表 59 教育程度別失業率-按年齡分 ... 229
表 60 失業者之失業原因-按年齡分 ... 230
表61 婚姻狀況別失業率-按年齡分 ... 232
表 62 婚姻狀況別失業率-按教育程度分 ... 233
表 63 失業者之失業週數-按性別、年齡與教育程度分 ... 234
表 64 失業者之失業週數-按失業原因與找尋工作方法分 ... 235
表 65 尋職者之找尋工作方法-按希望找尋工作之時間性質分 ... 236
表66 尋職者之找尋工作方法-按年齡與教育程度分 ... 237
表 67 尋職者希望找尋工作之時間性質-按年齡與教育程度分 ... 238
表68 非初次尋職失業者之失業前從業身分-按失業前行業與職業分 ... 239
表 44 15歲以上女性民間人口之年齡-按勞動力狀況、從業身分與婚姻 狀況分 ... 184
三、就業 表 45 就業者之教育程度與年齡-按行業分... 186
表46 就業者之教育程度與年齡-按職業分... 192
表 47 就業者之教育程度與年齡-按從業身分分... 194
表48 就業者之職業-按行業分... 196
表 49 就業者之教育程度-按年齡分... 202
表 50 就業者之從業身分-按中分類行業分... 203
表51 就業者之從業身分-按中分類職業分... 207
表 52 就業者之平均每週主要工作時數-按中分類行業與從業身分分... 210
表53 就業者之每週工作時數-按年齡分... 214
表 54 就業者之主要工作每週工作時數-按年齡分... 216
表 55 就業者之主要工作每週工作時數-按行業分... 218
表56 就業者之主要工作每週工作時數-按從業身分分... 222
表 57 就業者之平均每週主要工作時數-按行業與職業分... 224
四、失業 表 58 失業者之教育程度-按年齡分... 228
表 59 教育程度別失業率-按年齡分... 229
表 60 失業者之失業原因-按年齡分... 230
表61 婚姻狀況別失業率-按年齡分... 232
表 62 婚姻狀況別失業率-按教育程度分... 233
表 63 失業者之失業週數-按性別、年齡與教育程度分... 234
表 64 失業者之失業週數-按失業原因與找尋工作方法分... 235
表 65 尋職者之找尋工作方法-按希望找尋工作之時間性質分... 236
表66 尋職者之找尋工作方法-按年齡與教育程度分... 237
表 67 尋職者希望找尋工作之時間性質-按年齡與教育程度分... 238
表68 非初次尋職失業者之失業前從業身分-按失業前行業與職業分... 239
( 8)
表 69 非初次尋職失業者之失業前行業、職業與從業身分-按年齡分 ... 240
表70 非初次尋職失業者之失業前行業、職業與從業身分-按失業原因分 244 五、非勞動力 表 71 非勞動力之教育程度與年齡-按未參與勞動原因分 ... 248
丙、追溯估計與調整銜接結果 表 72 歷年人力資源調查重要結果 ... 250
表 73 歷年人力資源調查重要指標 ... 252
表 74 歷年15歲以上民間人口之年齡 ... 254
表 75 歷年15歲以上民間人口之教育程度 ... 258
表76 歷年就業者之從業身分 ... 260
參、轉載國際資料 表 77 歷年世界主要國家(地區)勞動力參與率 ... 262
表78 歷年世界主要國家(地區)失業率 ... 263
肆、性別專題分析 ... 264
伍、人力資源調查統計編製方法概述 ... 272
陸、名詞與定義 ... 285
柒、訪問表 ... 292
表 69 非初次尋職失業者之失業前行業、職業與從業身分-按年齡分... 240
表70 非初次尋職失業者之失業前行業、職業與從業身分-按失業原因分 244 五、非勞動力 表 71 非勞動力之教育程度與年齡-按未參與勞動原因分... 248
丙、追溯估計與調整銜接結果 表 72 歷年人力資源調查重要結果... 250
表 73 歷年人力資源調查重要指標... 252
表 74 歷年15歲以上民間人口之年齡... 254
表 75 歷年15歲以上民間人口之教育程度... 258
表76 歷年就業者之從業身分... 260
參、轉載國際資料 表 77 歷年世界主要國家(地區)勞動力參與率... 262
表78 歷年世界主要國家(地區)失業率... 263
肆、性別專題分析 ... 264
伍、人力資源調查統計編製方法概述 ... 272
陸、名詞與定義 ... 285
柒、訪問表... 292
( 8)
表 69 非初次尋職失業者之失業前行業、職業與從業身分-按年齡分 ... 240
表70 非初次尋職失業者之失業前行業、職業與從業身分-按失業原因分 244 五、非勞動力 表 71 非勞動力之教育程度與年齡-按未參與勞動原因分 ... 248
丙、追溯估計與調整銜接結果 表 72 歷年人力資源調查重要結果 ... 250
表 73 歷年人力資源調查重要指標 ... 252
表 74 歷年15歲以上民間人口之年齡 ... 254
表 75 歷年15歲以上民間人口之教育程度 ... 258
表76 歷年就業者之從業身分 ... 260
參、轉載國際資料 表 77 歷年世界主要國家(地區)勞動力參與率 ... 262
表78 歷年世界主要國家(地區)失業率 ... 263
肆、性別專題分析 ... 264
伍、人力資源調查統計編製方法概述 ... 272
陸、名詞與定義 ... 285
柒、訪問表 ... 292
( 9) CONTENTS Preface ... ( 1)
Explanatory Notes ... ( 4)
Ⅰ .Summary Analysis ... (14)
Ⅱ .Statistical Tabulation for Manpower Survey 1.Yearly and Monthly Data Table 1. Important Results of Manpower Survey, 1978 to date ... 2
Table 2. Important Indicators Based on Manpower Survey Results, 1978 to date ... 4
Table 3. Important Indexes Based on Manpower Survey Results, 1978 to date ... 6
Table 4. Civilian Population Aged 15 Years and Over by Age, 1978 to date ... 8
Table 5. Civilian Population Aged 15 Years and Over by Educational Attainment, 1978 to date ... 16
Table 6. Labor Force by Age, 1978 to date ... 22
Table 7. Labor Force by Educational Attainment, 1978 to date... 30
Table 8. Labor Force Participation Rates by Age, 1978 to date ... 36
Table 9. Labor Force Participation Rates by Educational Attainment, 1978 to date ... 40
Table 10. Labor Force Participation Rates by Marital Status, 1978 to date ... 43
Table 11. Employed Persons by Age, 1978 to date ... 44
Table 12. Employed Persons by Educational Attainment, 1978 to date ... 52
Table 13. Employed Persons by Industry, 1978 to date ... 58
Table 14. Employed Persons by Occupation, 1978 to date ... 82
Table 15. Employed Persons by Class of Worker, 1978 to date ... 90
Table 16. Employed Persons by Number of Employees in Workplace, 1978 to date ... 94
CONTENTS Preface ... ( 1)
Explanatory Notes... ( 4)
Ⅰ .Summary Analysis... (14)
Ⅱ .Statistical Tabulation for Manpower Survey 1.Yearly and Monthly Data Table 1. Important Results of Manpower Survey, tant Results of Manpower Survey, tant Results of Manpower Survey 1978 to date... 2
Table 2. Important Indicators Based on Manpower Survey Results, 1978 to date ... 4
Table 3. Important Indexes Based on Manpower Survey Results, 1978 to date ... 6
Table 4. Civilian Population Aged 15 Years and Over by Age, 1978 to date ... 8
Table 5. Civilian Population Aged 15 Years and Over by Educational Attainment, 1978 to date ... 16
Table 6. Labor Force by Age, 1978 to date... 22
Table 7. Labor Force by Educational Attainment, 1978 to date... 30
Table 8. Labor Force Participation Rates by Age, 1978 to date... 36
Table 9. Labor Force Participation Rates by Educational Attainment, 1978 to date ... 40
Table 10. Labor Force Participation Rates by Marital Status, 1978 to date... 43
Table 11. Employed Persons by Age, 1978 to date... 44
Table 12. Employed Persons by Educational Attainment, 1978 to date ... 52
Table 13. Employed Persons by Industry, Industry, Industry 1978 to date ... 58
Table 14. Employed Persons by Occupation, 1978 to date... 82
Table 15. Employed Persons by Class of Worker, 1978 to date... 90
Table 16. Employed Persons by Number of Employees in Workplace Workplace W ,
1978 to date ... 94
Table 17. Unemployed Persons by New/Experienced Jobseekers,
1978 to date ... 100
Table 18. Unemployed Persons by Age, 1978 to date... 102
Table 19. Unemployment Rates by Age, 1978 to date... 106
Table 20. Unemployed Persons by Educational Attainment, 1978 to date ... 110
Table 21. Unemployment Rates by Educational Attainment, 1978 to date ... 113
Table 22. Unemployed Persons by Duration of Unemployment, 1978 to date ... 116
Table 23. Persons Not in Labor Force by Reason for Not in Labor Force, 1978 to date ... 118
2.Current Year Data (1)District (or Region) Table 24. Important Results of Manpower Survey ... 120
Table 25. Important Indicators Based on Manpower Survey Results... 122
Table 26. Civilian Population Aged 15 Years and Over by Educational Attainment and Age... 124
Table 27. Labor Force by Educational Attainment and Age ... 128
Table 28. Labor Force Participation Rates by Age ... 132
Table 29. Labor Force Participation Rates by Educational Attainment... 136
Table 30. Labor Force Participation Rates by Marital Status ... 139
Table 31. Employed Persons by Educational Attainment and Age... 140
Table 32. Employed Persons by Industry... 144
Table 33. Employed Persons by Occupation... 156
Table 34. Employed Persons by Class of Worker ... 160
Table 35. Unemployed Persons by Educational Attainment and Age... 164
Table 36. Unemployment Rates by Age... 166
Table 37. Unemployment Rates by Educational Attainment ... 170
Table 38. Persons Not in Labor Force by Reason for Not in Labor Force ... 174
Table 17. Unemployed Persons by New/Experienced Jobseekers, 1978 to date ... 100
Table 18. Unemployed Persons by Age, 1978 to date... 102
Table 19. Unemployment Rates by Age, 1978 to date... 106
Table 20. Unemployed Persons by Educational Attainment, 1978 to date ... 110
Table 21. Unemployment Rates by Educational Attainment, 1978 to date ... 113
Table 22. Unemployed Persons by Duration of Unemployment, 1978 to date ... 116
Table 23. Persons Not in Labor Force by Reason for Not in Labor Force, 1978 to date ... 118
2.Current Year Data (1)District (or Region) Table 24. Important Results of Manpower Survey ... 120
Table 25. Important Indicators Based on Manpower Survey Results... 122
Table 26. Civilian Population Aged 15 Years and Over by Educational Attainment and Age... 124
Table 27. Labor Force by Educational Attainment and Age ... 128
Table 28. Labor Force Participation Rates by Age ... 132
Table 29. Labor Force Participation Rates by Educational Attainment... 136
Table 30. Labor Force Participation Rates by Marital Status ... 139
Table 31. Employed Persons by Educational Attainment and Age... 140
Table 3 Table 3 Ta 2. Employed Persons by Industry... 144
Table 33. Employed Persons by Occupation... 156
Table 34. Employed Persons by Class of Worker ... 160
Table 35. Unemployed Persons by Educational Attainment and Age... 164
Table 36. Unemployment Rates by Age... 166
Table 37. Unemployment Rates by Educational Attainment ... 170
Table 38. Persons Not in Labor Force by Reason for Not in Labor Force ... 174
Table 17. Unemployed Persons by New/Experienced Jobseekers,
1978 to date ... 100
Table 18. Unemployed Persons by Age, 1978 to date... 102
Table 19. Unemployment Rates by Age, 1978 to date... 106
Table 20. Unemployed Persons by Educational Attainment, 1978 to date ... 110
Table 21. Unemployment Rates by Educational Attainment, 1978 to date ... 113
Table 22. Unemployed Persons by Duration of Unemployment, 1978 to date ... 116
Table 23. Persons Not in Labor Force by Reason for Not in Labor Force, 1978 to date ... 118
2.Current Year Data (1)District (or Region) Table 24. Important Results of Manpower Survey ... 120
Table 25. Important Indicators Based on Manpower Survey Results... 122
Table 26. Civilian Population Aged 15 Years and Over by Educational Attainment and Age... 124
Table 27. Labor Force by Educational Attainment and Age ... 128
Table 28. Labor Force Participation Rates by Age ... 132
Table 29. Labor Force Participation Rates by Educational Attainment... 136
Table 30. Labor Force Participation Rates by Marital Status ... 139
Table 31. Employed Persons by Educational Attainment and Age... 140
Table 32. Employed Persons by Industry... 144
Table 33. Employed Persons by Occupation... 156
Table 34. Employed Persons by Class of Worker ... 160
Table 35. Unemployed Persons by Educational Attainment and Age... 164
Table 36. Unemployment Rates by Age... 166
Table 37. Unemployment Rates by Educational Attainment ... 170
Table 38. Persons Not in Labor Force by Reason for Not in Labor Force ... 174
(2)Labor Force Table 39. Civilian Population Aged 15 Years and Over by Educational Attainment, Labor Force Status, and Age ... 178
Table 40. Civilian Population Aged 15 Years and Over by Marital Status and Labor Force Status... 180
Table 41. Labor Force Participation Rates by Age and Marital Status ... 181
Table 42. Labor Force Participation Rates by Educational Attainment and Marital Status ... 182
Table 43. Labor Force Participation Rates by Age and Educational Attainment 183 Table 44. Civilian Female Population Aged 15 Years and Over by Age, Labor Force Status, Class of Worker, and Marital Status... 184
(3)Employment Table 45. Employed Persons by Educational Attainment, Age, and Industry... 186
Table 46. Employed Persons by Educational Attainment, Age, and Occupation 192 Table 47. Employed Persons by Educational Attainment, Age, and Class of Worker... 194
Table 48. Employed Persons by Industry and Occupation ... 196
Table 49. Employed Persons by Educational Attainment and Age... 202
Table 50. Employed Persons by Class of Worker and Industry Division ... 203
Table 51. Employed Persons by Class of Worker and Occupation Division ... 207
Table 52. Employed Persons by Average Weekly Work Hours for Major Jobs, Industry Division, and Class of Worker ... 210
Table 53. Employed Persons by Weekly Work Hours and Age ... 214
Table 54. Employed Persons by Weekly Work Hours for Major Jobs and Age.. 216
Table 55. Employed Persons by Weekly Work Hours for Major Jobs and Industry... 218
Table 56. Employed Persons by Weekly Work Hours for Major Jobs and Class of Worker ... 222
(2)Labor Force Table 3 Table 3 T 9. Civilian Population Aged 15 Years and Over by Educational Attainment, Labor Force Status, and Age ... 178
Table 40. Civilian Population Aged 15 Years and Over by Marital Status and Labor Force Status... 180
Table 41. Labor Force Participation Rates by Age and Marital Status ... 181
Table 42. Labor Force Participation Rates by Educational Attainment and Marital Status ... 182
Table 43. Labor Force Participation Rates by Age and Educational Attainment 183 Table 44. Civilian Female Population Aged 15 Years and Over by Age, Labor Force Status, Class of Worker, and Marital Status... 184
(3)Employment Table 45. Employed Persons by Educational Attainment, Age, and Industry... 186
Table 46. Employed Persons by Educational Attainment, Age, and Occupation 192 Table 47. Employed Persons by Educational Attainment, Age, and Class of Worker... 194
Table 48. Employed Persons by Industry and Occupation ... 196
Table 49. Employed Persons by Educational Attainment and Age... 202
Table 50. Employed Persons by Class of Worker and Industr Industr Ind y Division ... 203
Table 51. Employed Persons by Class of Worker and Occupation Division ... 207
Table 52. Employed Persons by Average Weekly Work Hours for Major Jobs, Industry Division, and Class of Worker ... 210
Table 53. Employed Persons by Weekly Work Hours and Age ... 214
Table 54. Employed Persons by Weekly Work Hours for Major Jobs and Age.. 216
Table 55. Employed Persons by Weekly Work Hours for Major Jobs and Industry... 218
Table 56. Employed Persons by Weekly Work Hours for Major Jobs and
Class of Worker ... 222
Table 57. Employed Persons by Average Weekly Work Hours for Major Jobs,
Industry, and Occupation... 224
(4)Unemployment Table 58. Unemployed Persons by Educational Attainment and Age... 228
Table 59. Unemployment Rates by Educational Attainment and Age... 229
Table 60. Unemployed Persons by Reason for Unemployment and Age ... 230
Table 61. Unemployment Rates by Marital Status and Age ... 232
Table 62. Unemployment Rates by Marital Status and Educational Attainment 233 Table 63. Unemployed Persons by Duration of Unemployment, Sex, Age, and Educational Attainment ... 234
Table 64. Unemployed Persons by Duration of Unemployment, Reason for Unemployment, and Job Seeking Method ... 235
Table 65. Jobseekers by Job Seeking Method and Type ... 236
Table 66. Jobseekers by Job Seeking Method, Age, and Educational Attainment... 237
Table 67. Jobseekers by Expected Job Type, Age, and Educational Attainment 238 Table 68. Unemployed Persons with Work Experience by Previous Job's Class of Worker, Industry, and Occupation... 239
Table 69. Unemployed Persons with Work Experience by Previous Job's Industry, Occupation, Class of Worker, and Age ... 240
Table 70. Unemployed Persons with Work Experience by Previous Job's Industry, Occupation, Class of Worker, and Reason for Unemployment ... 244
(5)Not in Labor Force Table 71. Persons Not in Labor Force by Educational Attainment, Age, and Reason for Not in Labor Force... 248
3. Backward Estimates and Linkingly Adjusted Results Table 72. Important Results of Manpower Survey, 1951 to 1977 ... 250
Table 73. Important Indicators Based on Manpower Survey Results, 1951 to 1977 ... 252
Table 57. Employed Persons by Average Weekly Work Hours for Major Jobs, Industry, and Occupation... 224
(4)Unemployment Table 58. Unemployed Persons by Educational Attainment and Age... 228
Table 59. Unemployment Rates by Educational Attainment and Age... 229
Table 60. Unemployed Persons by Reason for Unemployment and Age ... 230
Table 61. Unemployment Rates by Marital Status and Age ... 232
Table 62. Unemployment Rates by Marital Status and Educational Attainment 233 Table 63. Unemployed Persons by Duration of Unemployment, Sex, Age, and Educational Attainment ... 234
Table 6 Table 6 Ta 4. Unemployed Persons by Duration of Unemployment, Reason for Unemployment, and Job Seeking Method ... 235
Table 65. Jobseekers by Job Seeking Method and Type ... 236
Table 66. Jobseekers by Job Seeking Method, Age, and Educational Attainment... 237
Table 67. Jobseekers by Expected Job Type, Age, and Educational Attainment 238 Table 68. Unemployed Persons with Work Experience by Previous Job's Class of Worker, Industry, and Occupation... 239
Table 69. Unemployed Persons with Work Experience by Previous Job's Industry, Occupation, Class of Worker, and Age ... 240
Table 70. Unemployed Persons with Work Experience by Previous Job's Industry, Occupation, Class of Worker, and Reason for Unemployment ... 244
(5)Not in Labor Force Table 71. Persons Not in Labor Force by Educational Attainment, Age, and Reason for Not in Labor Force... 248
3. Backward Estimates and Linkingly Adjusted Results Table 72. Important Results of Manpower Survey, 19 tant Results of Manpower Survey, 19 tant Results of Manpower Survey 51 to 1977 ... 250
Table 73. Important Indicators Based on Manpower Survey Results,
1951 to 1977 ... 252
Table 57. Employed Persons by Average Weekly Work Hours for Major Jobs,
Industry, and Occupation... 224
(4)Unemployment Table 58. Unemployed Persons by Educational Attainment and Age... 228
Table 59. Unemployment Rates by Educational Attainment and Age... 229
Table 60. Unemployed Persons by Reason for Unemployment and Age ... 230
Table 61. Unemployment Rates by Marital Status and Age ... 232
Table 62. Unemployment Rates by Marital Status and Educational Attainment 233 Table 63. Unemployed Persons by Duration of Unemployment, Sex, Age, and Educational Attainment ... 234
Table 64. Unemployed Persons by Duration of Unemployment, Reason for Unemployment, and Job Seeking Method ... 235
Table 65. Jobseekers by Job Seeking Method and Type ... 236
Table 66. Jobseekers by Job Seeking Method, Age, and Educational Attainment... 237
Table 67. Jobseekers by Expected Job Type, Age, and Educational Attainment 238 Table 68. Unemployed Persons with Work Experience by Previous Job's Class of Worker, Industry, and Occupation... 239
Table 69. Unemployed Persons with Work Experience by Previous Job's Industry, Occupation, Class of Worker, and Age ... 240
Table 70. Unemployed Persons with Work Experience by Previous Job's Industry, Occupation, Class of Worker, and Reason for Unemployment ... 244
(5)Not in Labor Force Table 71. Persons Not in Labor Force by Educational Attainment, Age, and Reason for Not in Labor Force... 248
3. Backward Estimates and Linkingly Adjusted Results Table 72. Important Results of Manpower Survey, 1951 to 1977 ... 250
Table 73. Important Indicators Based on Manpower Survey Results, 1951 to 1977 ... 252
Table 74. Civilian Population Aged 15 Years and Over by Age, 1951 to 1977 ... 254
Table 75. Civilian Population Aged 15 Years and Over by Educational Attainment, 1951 to 1977 ... 258
Table 76. Employed Persons by Class of Worker, 1951 to 1977... 260
Ⅲ .International Data Table 77. Labor Force Participation Rates in Major Countries/Territories, 1982 to date... 262
Table 78. Unemployment Rates in Major Countries/Territories, 1978 to date... 263
Ⅳ .Gender Statistics... 264
Ⅴ .General Description of Statistical Methods for Manpower Survey... 278
Ⅵ .Terms and Definitions... 288
Ⅶ .Questionnaire... 293
(14)
壹、人力資源調查提要分析 民國 104 年
一、經濟情勢
受全球成長動能微弱,農工原料、原油價格續跌,加以中 國大陸供應鏈自主化排擠效應及國際競爭等因素交互影響, 104 年我國經濟成長率為 0.75 %。勞動市場方面, 104 年就業人數平 均為 1,119 萬 8 千人,較上(103)年增加 1.08%;失業率平均 為 3.78%,較上年續降 0.18 個百分點 ,整體勞動市場尚呈穩定。
表 1 近年重要經濟指標
經 濟 成長率
(%)
對 外 貿 易 年增率(%)
生 產 指 數 年增率(%)
物 價 指 數
年增率(%) 就 業
人 數 年增率
(%)
失業率
(%)
出口 進口
工 業 生 產 指 數
製造業 生 產 指 數
消費者 物 價 指 數
躉 售 物 價 指 數
100 年 3.80 12.56 12.40 4.44 4.69 1.42 4.32 2.06 4.39 101 年 2.06 -2.08 -3.73 -0.25 -0.32 1.93 -1.16 1.41 4.24 102 年 2.20 1.64 0.25 0.65 0.56 0.79 -2.43 0.99 4.18 103 年 3.92 2.78 1.38 6.37 6.63 1.20 -0.57 1.02 3.96 104 年 0.75 -10.86 -15.83 -1.75 -1.49 -0.31 -8.84 1.08 3.78
註: 104 年經濟成長率為初步統計數。
壹、人力資源調查提要分析 民國 104 年
一、經濟情勢
受全球成長動能微弱,農工原料、原油價格續跌,加以中 國大陸供應鏈自主化排擠效應及國際競爭等因素交互影響, 104 年我國經濟成長率為 0.75 %。勞動市場方面, 104 年就業人數平 均為 1,119 萬 8 千人,較上(103)年增加 1.08%;失業率平均 為 3.78%,較上年續降 0.18 個百分點 ,整體勞動市場尚呈穩定。
表 1 近年重要經濟指標
經 經 經 濟 成長率
(%)
對 外 貿 易 年增率(%)
生 產 指 數 年增率(%)
物 價 指 數
年增率(%) 就 業 人 數 年增率
(%)
失業率
(%)
出口 進口
工 業 生 產 指 數
製造業 生 產 指 數
消費者 物 價 指 數
躉 售 物 價 指 數
100 年 3.80 12.56 12.40 4.44 4.69 1.42 4.32 2.06 4.39 101 年 2.06 -2.08 -3.73 -0.25 -0.32 1.93 -1.16 1.41 4.24 102 年 2.20 1.64 0.25 0.65 0.56 0.79 -2.43 0.99 4.18 103 年 3.92 2.78 1.38 6.37 6.63 1.20 -0.57 1.02 3.96 104 年 0.75 -10.86 -15.83 -1.75 -1.49 -0.31 -8.84 1.08 3.78
註: 104 年經濟成長率為初步統計數。
(14)
壹、人力資源調查提要分析 民國 104 年
一、經濟情勢
受全球成長動能微弱,農工原料、原油價格續跌,加以中 國大陸供應鏈自主化排擠效應及國際競爭等因素交互影響, 104 年我國經濟成長率為 0.75 %。勞動市場方面, 104 年就業人數平 均為 1,119 萬 8 千人,較上(103)年增加 1.08%;失業率平均 為 3.78%,較上年續降 0.18 個百分點 ,整體勞動市場尚呈穩定。
表 1 近年重要經濟指標
經 濟 成長率
(%)
對 外 貿 易 年增率(%)
生 產 指 數 年增率(%)
物 價 指 數
年增率(%) 就 業
人 數 年增率
(%)
失業率
(%)
出口 進口
工 業 生 產 指 數
製造業 生 產 指 數
消費者 物 價 指 數
躉 售 物 價 指 數
100 年 3.80 12.56 12.40 4.44 4.69 1.42 4.32 2.06 4.39 101 年 2.06 -2.08 -3.73 -0.25 -0.32 1.93 -1.16 1.41 4.24 102 年 2.20 1.64 0.25 0.65 0.56 0.79 -2.43 0.99 4.18 103 年 3.92 2.78 1.38 6.37 6.63 1.20 -0.57 1.02 3.96 104 年 0.75 -10.86 -15.83 -1.75 -1.49 -0.31 -8.84 1.08 3.78
註: 104 年經濟成長率為初步統計數。
(15)
二、勞動力狀況
▲104 年勞動力平均較上年增加 0.89%;勞動力參與率平均上升 0.11 個百分點;女性勞動力參與率續升至 50.74%。
(一)勞動力
104 年臺灣地區勞動力平均為 1,163 萬 8 千人,較上年 增加 10 萬 3 千人或 0.89%,其中女性勞動力增加 0.92%;
男性亦增 0.86%。
表 2 人力資源調查結果主要指標
單位:千人 1 5 歲
以上民 間人口
勞 動 力
非 勞 合 計 男 女 就 業 者 失 業 者 動 力
小 計 男 女 小 計 男 女
100 年 19 253 11 200 6 304 4 896 10 709 6 006 4 702 491 297 194 8 053
101 年 19 436 11 341 6 369 4 972 10 860 6 083 4 777 481 286 195 8 096
102 年 19 587 11 445 6 402 5 043 10 967 6 116 4 851 478 286 192 8 142
103 年 19 705 11 535 6 441 5 094 11 079 6 166 4 913 457 275 182 8 170
104 年 19 842 11 638 6 497 5 141 11 198 6 234 4 964 440 263 177 8 204
(二)勞動力參與率
104 年勞動力參與率平均為 58.65%,較上年續升 0.11 個百分點,已連續 6 年呈上升趨勢,其中男性為 66.91%,
較上年上升 0.13 個百分點;女性為 50.74%,亦上升 0.10 個 百分點。按年齡結構觀察,以 25~34 歲年齡者上升 1.04 個百 分點最多, 15~24 歲年齡者亦升 0.88 個百分點次之。
二、勞動力狀況
▲104 年勞動力平均較上年增加 0.89%;勞動力參與率平均上升 0.11 個百分點;女性勞動力參與率續升至 50.74%。
(一)勞動力
104 年臺灣地區勞動力平均為 1,163 萬 8 千人,較上年 增加 10 萬 3 千人或 0.89%,其中女性勞動力增加 0.92%;
男性亦增 0.86%。
表 2 人力資源調查結果主要指標
單位:千人 1 5 歲
以上民 間人口
勞 動 力
非 勞
合 計 男 女 就 業 者 失 業 者 動 力
小 計 男 女 小 計 男 女
100 年 19 253 11 200 6 304 4 896 10 709 6 006 4 702 491 297 194 8 053
101 年 19 436 11 341 6 369 4 972 10 860 6 083 4 777 481 286 195 8 096
102 年 19 587 11 445 6 402 5 043 10 967 6 116 4 851 478 286 192 8 142
103 年 19 705 11 535 6 441 5 094 11 079 6 166 4 913 457 275 182 8 170
104 年 19 842 11 638 6 497 5 141 11 198 6 234 4 964 440 263 177 8 204
(二)勞動力參與率
104 年勞動力參與率平均為 58.65%,較上年續升 0.11 個百分點,已連續 6 年呈上升趨勢,其中男性為 66.91%,
較上年上升 0.13 個百分點;女性為 50.74%,亦上升 0.10 個
百分點。按年齡結構觀察,以 25~34 歲年齡者上升 1.04 個百
分點最多, 15~24 歲年齡者亦升 0.88 個百分點次之。
表 3 性別及年齡別之勞動力參與率
單位:%
總計
性 別 年 齡 別
男 女 15~24
歲
25~44 歲 45~64 歲 65 歲
以上 計 25~34
歲
35~44
歲 計 45~54
歲
55~64 歲
100 年 58.17 66.67 49.97 28.56 85.56 87.53 83.52 60.36 72.65 43.60 7.93 101 年 58.35 66.83 50.19 29.08 86.33 88.89 83.78 60.48 73.31 43.88 8.10 102 年 58.43 66.74 50.46 29.58 86.64 89.28 84.06 60.73 73.92 44.36 8.34 103 年 58.54 66.78 50.64 29.36 86.85 89.73 84.11 61.65 74.88 45.87 8.68 104 年 58.65 66.91 50.74 30.24 87.40 90.77 84.34 61.89 75.58 46.12 8.78
三、就業狀況
▲104 年就業人數平均較上年增加 11 萬 9 千人或 1.08%,以大專 及以上程度者、服務業部門、專業人員與生產操作及勞力工增 加較多。
(一)就業人數
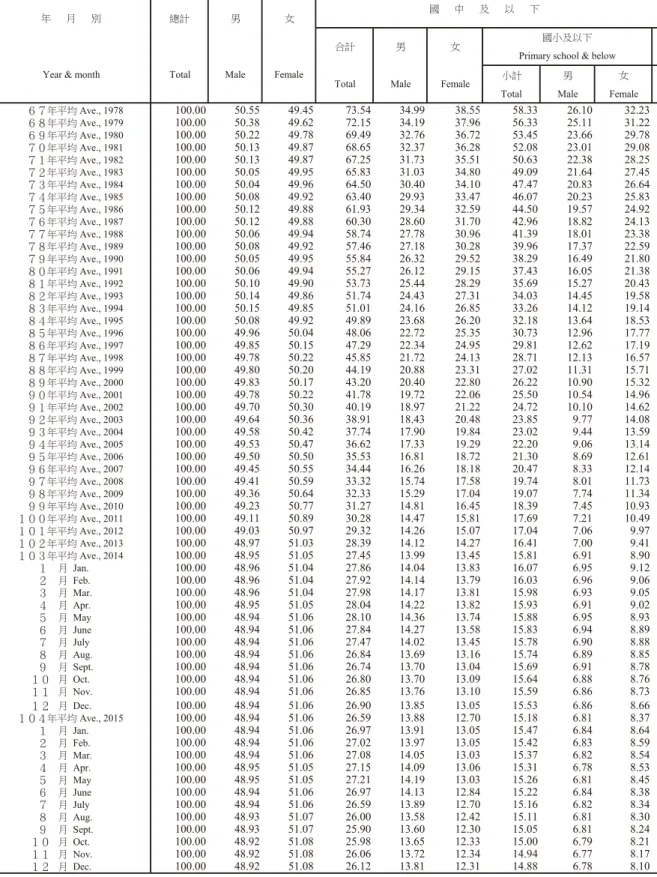
104 年就業人數平均為 1,119 萬 8 千人,較上年增加 11 萬 9 千人或 1.08%。由就業人口之教育結構觀察,近年來國 中及以下與高中(職)程度者占總就業之比率逐年下降至 18.40%與 32.97%,大專及以上程度者比率則逐年上升至 48.63%,就業人力教育程度持續提升。
圖 1 就業者之教育程度分配結構
100年 3,645(34.04%)
高中(職) 3,674(33.83%)
4,752(44.37%) 大專及以上 4,917(45.28%) 101年
102年 2,226(20.30%) 3,661(33.38%) 5,080(46.32%)
103年 2,124(19.17%) 3,675(33.17%) 5,280(47.66%)
104年 2,061(18.40%) 3,692(32.97%) 5,445(48.63%)
千人
0 1,000 2,000 3,000 4,000 5,000 6,000 7,000 8,000 9,000 10,000 11,000
2,312(21.59%) 國中及以下 2,268(20.89%)
表 3 性別及年齡別之勞動力參與率
單位:%
總計
性 別 年 齡 別
男 女 15~24 歲
25~44 歲 45~64 歲 65 歲 以上 計 25~34
歲
35~44
歲 計 45~54 歲
55~64 歲
100 年 58.17 66.67 49.97 28.56 85.56 87.53 83.52 60.36 72.65 43.60 7.93 101 年 58.35 66.83 50.19 29.08 86.33 88.89 83.78 60.48 73.31 43.88 8.10 102 年 58.43 66.74 50.46 29.58 86.64 89.28 84.06 60.73 73.92 44.36 8.34 103 年 58.54 66.78 50.64 29.36 86.85 89.73 84.11 61.65 74.88 45.87 8.68 104 年 58.65 66.91 50.74 30.24 87.40 90.77 84.34 61.89 75.58 46.12 8.78
三、就業狀況
▲104 年就業人數平均較上年增加 11 萬 9 千人或 1.08%,以大專 及以上程度者、服務業部門、專業人員與生產操作及勞力工增 加較多。
(一)就業人數
104 年就業人數平均為 1,119 萬 8 千人,較上年增加 11 萬 9 千人或 1.08%。由就業人口之教育結構觀察,近年來國 中及以下與高中(職)程度者占總就業之比率逐年下降至 18.40%與 32.97%,大專及以上程度者比率則逐年上升至 48.63%,就業人力教育程度持續提升。
圖 1 就業者之教育程度分配結構
100年 3,645(34.04%)
高中(職) 3,674(33.83%)
4,752(44.37%) 大專及以上 4,917(45.28%) 101年
102年 2,226(20.30%) 3,661(33.38%) 5,080(46.32%)
103年 2,124(19.17%) 3,675(33.17%) 5,280(47.66%)
104年 2,061(18.40%) 3,692(32.97%) 5,445(48.63%)
千人
0 1,000 2,000 3,000 4,000 5,000 6,000 7,000 8,000 9,000 10,000 11,000
2,312(21.59%) 國中及以下 2,268(20.89%)