國立臺灣大學獸醫專業學院獸醫學研究所 碩士論文
Graduate Institute of Veterinary Medicine School of Veterinary Medicine
National Taiwan University Master Thesis
氧化鐵奈米粒子對脂多醣活化小鼠微膠細胞功能之作用
The Effect of Iron Oxide Nanoparticles on the Functionality of Murine Microglia Stimulated with
Lipopolysaccharide
Min-Chun Chung
指導教授:詹東榮 博士 Advisor: Tong-Rong Jan, Ph.D.
中華民國一百零一年六月
June, 2012
I
口試委員審定書
II
致謝
這兩年的研究生涯因為有許多人的協助、支持與鼓勵才能讓我完成這份碩士 論文。首先我想要感謝我的指導老師-詹東榮老師。老師教導我有效率做實驗與 如何充分利用時間,同時您也鼓勵我們發展獨立思考與安排實驗的能力,讓我在 實驗邏輯與構思上有很大的進步。感謝這兩年因為我的研究而犧牲的小鼠們。
感謝梁弘人、林俊宏、簡茂盛與林辰栖老師在學生口試的時候提供的意見與 指導,拓展學生的思考範疇。謝謝一直很有活力的家琪學姐,看到你八爪章魚似 的忙碌奔波,讓我從你身上學到如何正向且樂在其中的面對生活;感謝我的小老 闆欣穎學姐,學姐不僅教我如何嚴謹的做實驗,有耐心地協助我解決實驗上的瓶 頸,善解人意的學姐也給予我很多鼓勵和支持;工作研究兩頭忙的建璋學長,仍
舊是堅定著朝向自己的目標前進,令人欽佩;總是有效率且努力的Bug;有你在實
驗室就很歡樂的慶齡學姐,你和季芳學姐都是我韓劇好夥伴;謝謝安琪學姐親切
的帶我做細胞實驗與操作flow;萬事通的玉茹學姐,謝謝你常常耐著性子聽我抱
怨;天性樂觀的芷華,你為實驗室創造很多小巧思,而且也為實驗室增添不少的 活力;感謝林宜萱這兩年碩士生涯的幫助,一起熟悉新環境與度過修課做實驗的 忙碌。
感謝林晨栖老師實驗室常常借儀器讓我使用;共儀中心曾亭育小姐,不厭其
煩地解決我使用confocal 上的問題;感謝鄭穹翔老師大方出借解剖顯微鏡;感謝
嬿琇常在我來不及準備實驗器材時,當我的的救火隊;小鼠實驗好夥伴董彥君,
和你一起聊天或討論實驗都讓我很開心;謝謝徐麗雪在我最低潮的時候給予我支 持;阿蔡、小羅和小朋友,透過你們我看到不同的世界,希望我們可以一直這樣。
最後我要感謝我的家人,爸爸、媽媽、奶奶和弟弟,給予我最大的支持和信 任,你們無私的包容,讓我心無旁騖地完成碩士學業。在這兩年的訓練,我學到 與大學截然不同的東西,在這當中感謝所有曾經鼓勵、協助與陪伴過我的人。
III
中文摘要
氧化鐵奈米粒子普遍應用於中樞核磁共振成像的對比劑。微膠細胞為中樞神 經系統中主要的免疫細胞,具有監督外來抗原入侵及引起適當炎症反應以消滅外 來病原之功能。本研究的主旨在於探討當中樞感染與小鼠初代微膠細胞大量活化 下,氧化鐵奈米粒子對其免疫功能是否造成影響。實驗結果顯示氧化鐵奈米粒子
濃度低於每毫升100 微克的鐵(100 μg of Fe/mL)時,對小鼠微膠細胞並無細胞
毒性,微膠細胞會快速將氧化鐵奈米粒子吞入細胞內,同時抑制微膠細胞的活化、
吞噬能力、interleukin-1β (IL-1β) 的分泌與 IL-1β converting enzyme (ICE) 的活性,
但tumor necrosis factor-α (TNF-α) 與 TNF-α converting enzyme (TACE) 卻不受影 響。此外,被攝入的氧化鐵奈米粒子會進入微膠細胞內的溶體,同時造成溶體鹼
化與膜通透性上升,並抑制溶體分解蛋白質的能力及cathepsin B 酵素的活性。進
一步探討氧化鐵奈米粒子抑制免疫功能與溶體受損間的關係,顯示氧化鐵奈米粒
子抑制cathepsin B 的活性而減少 ICE 活性與 IL-1β的分泌。綜合上述,本研究結果
指出氧化鐵奈米粒子會抑制微膠細胞防禦性免疫功能,且傷害溶體正常功能,顯 示氧化鐵奈米粒子抑制微膠細胞對抗病原感染能力。
關鍵字: 介白素,氧化鐵奈米粒子,脂多醣,溶體,微膠細胞
IV
Abstract
Superparamagnetic iron oxide nanoparticles have been employed as magnetic resonance imaging contrast agents for a variety of diagnostic applications, including the imaging of the central nervous system (CNS). As the central resident immune cells with macrophage-like functions, microglia are the dominant cells responsible for managing foreign materials invading the CNS. The objective of this study was to investigate the potential effect of iron oxide nanoparticles on functional activities of primary murine microglia stimulated with lipopolysaccharide (LPS). The results showed that iron oxide nanoparticles at concentrations < 100 μg of Fe/mL did not cause cytotoxicity. Confocal imaging revealed that iron oxide nanoparticles were rapidly and markedly engulfed by microglia. Iron oxide nanoparticles inhibited the expression of the activation marker ionized calcium-binding adaptor molecule-1 and the phagocytic activity of LPS-stimulated microglia. In addition, iron oxide nanoparticles inhibited secretion of interleukin (IL)-1β and IL-1β converting enzyme (ICE) activity, whereas tumor necrosis factor (TNF)-α secretion and TNF-α converting enzyme (TACE) activity were unaltered. Furthermore, internalized iron oxide nanoparticles were accumulated in lysosomes. Iron oxide nanoparticles also impaired lysosome proteolytic and cathepsin B activity, and increased lysosomal membrane permeability and alkalinization. These results suggest that the iron oxide nanoparticles may inhibit the cathepsin B activity, which subsequently suppress the activation of ICE and the secretion of IL-1β. Collectively, the present study demonstrated that iron oxide nanoparticles markedly attenuated the activation and functional activities of LPS-stimulated microglia, suggesting an impaired defense capacity of microglia against gram-negative bacteria.
Keywords: interleukin, iron oxide nanoparticles, lipopolysaccharide, lysosome, microglia
V
Content
口試委員審定書 ... I 致謝 ... II 中文摘要 ... III Abstract ... IV Content ... V Figures ... VIII Abbreviation ... IX
Chapter 1 Introduction ... 1
1.1 Background of nanoparticles and iron oxide nanoparticles ... 1
1.2 Toxicity of nanoparticles ... 2
1.3 Effects of nanoparticles on immune cells ... 3
1.4 The potential toxicity of nanoparticles to the central nervous system (CNS) ... 4
1.5 Microglia ... 6
1.6 Immunological impacts of nanoparticles on microglia ... 7
1.7 Objective of the study ... 8
Chapter 2 Materials and Methods ... 10
2.1 Chemicals and reagents ... 10
2.2 Culture of primary murine microglial cells ... 11
2.3 Internalization of iron oxide nanoparticles and colocalized with lysosome ... 12
2.4 Measurement of cell viability by MTT assay ... 12
2.5 Detection of microglial activation marker expression... 13
2.6 Analysis of phagocytic activity ... 13
2.7 Measurement of cytokines by ELISA ... 14
2.8 Measurement of IL-1β converting enzyme activity using enzymatic assay ... 15
2.9 Measurement of TNF-α converting enzyme activity using enzymatic assay ... 15
VI
2.10 Analysis of amount of lysosomes ... 16
2.11 Measurement of lysosomal membrane permeability ... 16
2.12 Measurement of lysosomal pH ... 17
2.13 Measurement of proteolytic activity ... 17
2.14 Measurement of cathepsin B activity ... 17
2.15 Statistical analysis ... 18
Chapter 3 Results ... 19
3.1 Uptake of iron oxide nanoparticles by LPS-stimulated microglia ... 19
3.2 No cytotoxic effect of iron oxide nanoparticles on LPS-stimulated microglia . 21 3.3 Iron oxide nanoparticles inhibited the activation of LPS-stimulated microglia 22 3.4 Iron oxide nanoparticles inhibited the phagocytic activity of LPS-stimulated microglia ... 24
3.5 Iron oxide nanoparticles differentially affected the secretion of proinflammatory cytokines in LPS-stimulated microglia ... 26
3.6 Iron oxide nanoparticles differentially affected the activity of ICE and TACE in LPS-stimulated microglia ... 27
3.7 The distribution of iron oxide nanoparticles in lysosomes of LPS-stimulated microglia ... 28
3.8 Iron oxide nanoparticles increased the amount of lysosomes in LPS-stimulated microglia ... 29
3.9 Iron oxide nanoparticles increased lysosomal membrane permeability in LPS-stimulated microglia ... 31
3.10 Iron oxide nanoparticles induced lysosomal alkalinization in LPS-stimulated microglia ... 33
3.11 Iron oxide nanoparticles inhibited lysosomal degradation capacity in LPS-stimulated microglia ... 35
VII
3.12 Iron oxide nanoparticles inhibited cathepsin B activity in LPS-stimulated microglia ... 37 Chapter 4 Discussion ... 39 References ... 46
VIII
Figures
Figure 1. Uptake of iron oxide nanoparticles by LPS-stimulated microglia measured by fluorescence confocal microscopy... 20 Figure 2. No effect of iron oxide nanoparticles on the viability of LPS-stimulated
microglia. ... 21 Figure 3. Suppression by iron oxide nanoparticles of Iba-1 expression in LPS-stimulated
microglia. ... 23 Figure 4. Suppression by iron oxide nanoparticles of the phagocytic activity of
LPS-stimulated microglia. ... 25 Figure 5. Differential effects of iron oxide nanoparticles on the production of
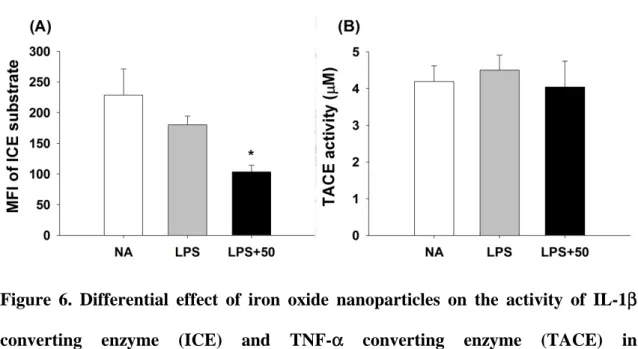
proinflammatory cytokines by LPS-stimulated microglia... 26 Figure 6. Differential effect of iron oxide nanoparticles on the activity of IL-1β
converting enzyme (ICE) and TNF-α converting enzyme (TACE) in
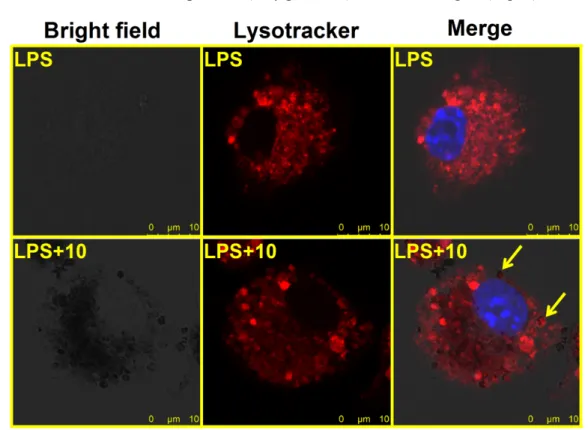
LPS-stimulated microglia. ... 27 Figure 7. The distribution of iron oxide nanoparticles in lysosomes of LPS-stimulated
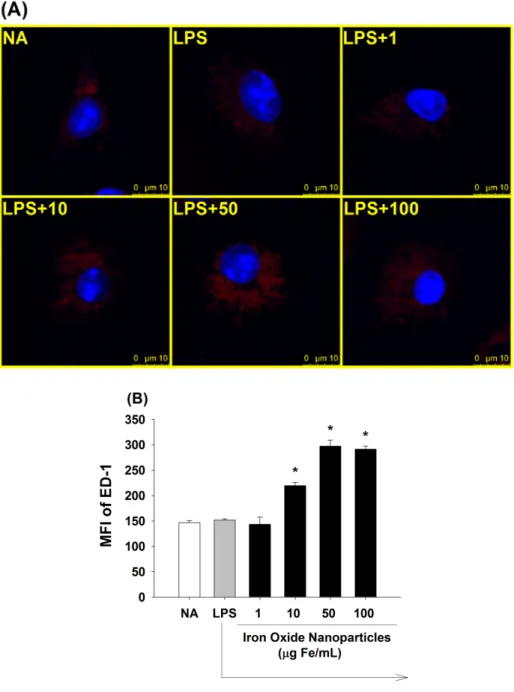
microglia. ... 28 Figure 8. Effect of iron oxide nanoparticles on the amount of lysosomes in
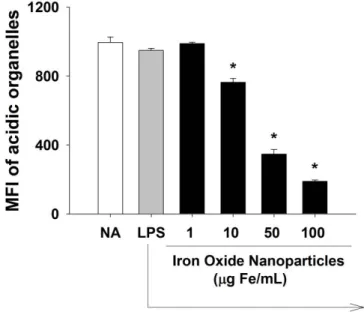
LPS-stimulated microglia. ... 30 Figure 9. Effect of iron oxide nanoparticles on lysosomal membrane permeability in
LPS-stimulated microglia. ... 32 Figure 10. Induction by iron oxide nanoparticles of lysosomal alkalinization in
LPS-stimulated microglia. ... 34 Figure 11. Attenuation by iron oxide nanoparticles of lysosomal degradation capacity in
LPS-stimulated microglia. ... 36 Figure 12. Suppression by iron oxide nanoparticles of the cathepsin B activity in
LPS-stimulated microglia. ... 38
IX
Abbreviation
Abbreviation Term
AO Acridine orange
APC Allophycocyanin
BBB Blood-brain barrier
BSA Bovine serum albumin
CD Cluster of differentiation
CNS Central nervous system
DC Dendritic cells
ED-1 Ectodermal dysplasia-1
ELISA Enzyme-linked immunosorbent assay
ER Endoplasmic reticulum
FBS Fetal bovine serum
FITC Fluorescein isothiocyanate
GSH Glutathione
Iba-1 Ionized calcium-binding adaptor molecule-1
ICE IL-1β converting enzyme
IFN-γ Interferon-γ
IL Interleukin LAMP Lysosome associated membrane protein LPS Lipopolysaccharide MHC Major histocompatibility complex
MRI Magnetic resonance imaging
NA Naïve
NO Nitric oxide
OVA Ovalbumin
X
Abbreviation Term
PBS Phosphate buffered saline
ROS Reactive oxygen species
SiNP Silica nanoparticle
TACE TNF-α converting enzyme
Th T help
TiO2 Titanium dioxide
TLR Toll-like receptor
TNF-α Tissue necrosis factor-α
1
Chapter 1 Introduction
1.1 Background of nanoparticles and iron oxide nanoparticles
Nanoparticles can be engineered or found naturally in the environment. In recent years, the rapid development of nanotechnology has attracted global attention. The structure of nanoparticles is on the nanometer scale, with size of 1-100 nm. Due to the nanoscale dimensions, nanoparticles possess extremely high surface to volume ratio compared with bulky forms of the same materials. Therefore, nanoparticles exhibit unique properties, such as greater strength, stability and biological activity (Boverhof et al., 2010). Nanotechnology has been widely used in biological, environmental, material and medical fields.Engineered nanoparticles, due to their specific physicochemical properties, are increasingly used for biological and medical purpose, including diagnostic and therapeutic applications (Liu et al., 2012; Schladt et al., 2011). In particular, iron oxide nanoparticles has been used as contrast agents for magnetic resonance imaging (MRI), intracellular labeling, drug delivery and cancer therapy (Chouly et al., 1996; Liong et al., 2008; Xie et al., 2009; Yu et al., 2008). The commercial iron oxide nanoparticles, Resovist® contains a crystalline core composed of Fe3O4 (magnetite) and γ-Fe2O3 (maghemite) coated with carboxydextran. The superparamagnetic property of iron oxide nanoparticles can generate heat in an alternating magnetic field and guide specific targeting by an external magnetic field.
The property is very crucial for the development of contrast enhancement, targeted delivery of drugs or genes, tissue engineering, cancer thermal therapy, magnetic transfections, iron detection, chelation therapy and tissue engineering (Bulte et al., 2001;
Gupta et al., 2005; Hamm et al., 1994; Hautot et al., 2007; Huber, 2005; Ito et al., 2005;
Liu et al., 2006). Iron oxide nanoparticles were rapidly taken up by phagocytes, and
2
mainly accumulated in the liver with approximately 80% of the injected dose, the spleen with 8-10%, bone marrow, and lymph nodes with 10 % within few minutes post systemic administration (Grazioli et al., 2009; Hamm et al., 1994). Hence, iron oxide nanoparticles are an organ-specific MRI contrast agent, using for the diagnosis of organs of reticuloendothelial system associated organs. Malignant tumors typically lack of a substantial number of phagocytic cells, they appear hyperintense or bright images compared with the hypointense or black images of normal tissues. Because of this property, iron oxide nanoparticles are employed as a diagnostic tool for distinguishing between tumor and normal tissues.
1.2 Toxicity of nanoparticles
Due to several characteristics of nanoparticles such as extremely small size and high surface to volume ratio, nanomaterials can enter the human body easily and have the potential to alter cellular responses. The toxicity of nanoparticles is dependent on many factors, including the bulk forms, shape, surface structure, surface charge, size, chemical composition, aggregation and solubility (Oberdörster et al., 2007). Previous studies have shown that engineered carbon nanoparticles can activate platelets and cause vascular thrombosis (Radomski et al., 2005). Respiratory exposure of titanium dioxide (TiO2), carbon, diesel exhaust particles and iron oxide nanoparticles causes lung inflammation, including the stimulation of proinflammatory cytokines production, cellular proliferation, fibro-proliferative effects and development of lung tumors (Cho et al., 2009; Gustafsson et al., 2011; Li et al., 2010; Warheit et al., 2006). Mechanistic studies reported that nanoparticles impaired mitochondrial functions, and induced formation of apoptosis bodies, leakage of lactate dehydrogenase, chromosome condensation, generation of reactive oxygen species (ROS) and DNA damage (Singh et al., 2010).
3
1.3 Effects of nanoparticles on immune cells
Because nanoparticles are rapidly taken up by phagocytes of the immune system, understanding the interaction between nanoparticles and the immune system is important. Accumulating evidence suggests that nanoparticles possess a wide spectrum of immunomodulatory effects. For example, poly-hydroxylated metallofullerenol ([Gd@C82(OH)22]n) nanoparticles induced the maturation and affected the phenotype of dendritic cells (DC) to activate T help 1 (Th 1) immune responses (Yang et al., 2010a).
As to T cell-immunity, [Gd@C82(OH)22]n nanoparticlespossess anti-tumor ability by promoting T cells to differentiate into Th1 cells, shifting the Th1/Th2 balance to the Th1 direction and activating tumor necrosis factor α (TNF-α) mediated cellular immunity (Liu et al., 2009). Gold nanoparticles have been reported accumulated in DC and inhibited the production of TNF-α after lipopolysaccharide (LPS) stimulation, but did not alter the cell phenotype (Villiers et al., 2010). Gold nanoparticles induced proinflammatory responses and oxidative stress, and inhibited toll-like receptor 9 (TLR-9) signaling in macrophages (Abdelhalim et al., 2011; Ma et al., 2010; Nishanth et al., 2011; Tsai et al., 2012; Yen et al., 2009). Notably, iron oxide nanoparticles have been shown to modulate the functionality of various immune cells, including macrophages, DC and T lymphocytes. Exposure to iron oxide nanoparticles inhibited the phagocytic activity of Raw 264.7 cells, a murine macrophage line and increased the production of TNF-α and nitric oxide (NO) (Hsiao et al., 2008). Iron oxide nanoparticles induced apoptosis in primary macrophages and murine macrophage cell line J774 via oxidative stress (Lunov et al., 2010a; Naqvi et al., 2010). A single intratracheal exposure to iron oxide nanoparticles elicited inflammatory and pro-oxidative responses in mice (Park et al., 2010). In addition, iron oxide nanoparticles suppressed the functions of DC, such as antigen presentation and stimulation of cluster
4
of differentiation 4+ (CD 4+) T cells (Blank et al., 2011). As to the effect on T cells, mice intravenously administered with iron oxide nanoparticles showed an increased cellularity of CD4+ and CD8+ T cells, and an enhanced production of interleukin 2 (IL-2) and interferon γ (IFN-γ) by T cells (Blank et al., 2011). Recently, our laboratory reported that iron oxide nanoparticles compromised antigen-specific immune responses in ovalbumin (OVA)-sensitized mice. A single intravenous administration of iron oxide nanoparticles markedly inhibited antigen-specific antibodies, including OVA-specific IgG1 and IgG2a. The cell viability and IFN-γ production by splenocytes re-stimulated with the sensitized antigen OVA were attenuated by iron oxide nanoparticles (Shen et al., 2011b). In contrast, IL-4 was unaffected, indicating that iron oxide nanoparticles switched the Th1/Th2 balance toward Th2-dominant immune responses. In addition, iron oxide nanoparticle-mediated inhibition of IFN-γ was associated with diminished intracellular levels of glutathione (GSH) (Shen et al., 2011a). Collectively, these results clearly demonstrated that iron oxide nanoparticles exhibited a broad spectrum of immunomodulatory effects.
1.4 The potential toxicity of nanoparticles to the central nervous system (CNS) Nanoparticles may enter the CNS via several pathways, one of which is the nose-to-brain transport through olfactory epithelium, trigeminal nerve (Mistry et al., 2009; Oberdorster et al., 2004). Previous studies have shown that nanoparticles can transfer from olfactory epithelium and trigeminal nerve into CNS, including manganese oxide, gold, carbon, iron oxide nanoparticle and TiO2. Hence, intranasal exposure is a potential health concern. The other concern on the nose-to-brain transport is due to the potential of nanoparticles as delivering vehicles for mucosal immunization via the intranasal route (Hutter et al., 2010; Mistry et al., 2009; Sayin et al., 2009). The other pathway is penetrating the blood-brain barrier (BBB). The capability of nanoparticles
5
across BBB dependent on its physicochemical properties. For example, the lipophilic nanoparticles can pass directly from blood capillaries into BBB and charge-bearing and hydrophilic nanoparticles require gated channels and receptors to across BBB. The application of nanoparticles in CNS, such as imaging, or therapeutics in nano-oncology and neurodegenerative diseases, is achieved via systemic administration, and implantation of nano-enabled drug delivery system (Nunes et al., 2012; Yang et al., 2010d). Several lines of evidence has indicated that exposure to nanoparticles caused neurotoxicity in the CNS (Hu et al., 2010; Nunes et al., 2012; Yang et al., 2010d). For example, quantum dots were internalized by macrophages and microglia within glioma cells and altered in the responsiveness of glia and neurons after intravenous administration (Jackson et al., 2007). Quantum dots induced apoptosis in neuroblastoma cell lines, which was mediated by mitochondrial-dependent pathways, oxidative stress and inhibited survival signals, such as Ras, Raf-1 and ERK (Chan et al., 2006; Jan et al., 2008). The intracerebral injection of quantum dots caused the activation of astrocytes (Maysinger et al., 2007). Collectively, these studies clearly demonstrated that quantum dot nanoparticles affected the CNS.
Iron oxide nanoparticles have various diagnostic and potential therapeutic applications in the CNS, including tumor imaging and molecular imaging to evaluate the efficacy of therapy and hyperthermal therapy in glioma treatment (Engberink et al., 2010; Weinstein et al., 2010). Several lines of evidence has indicated that exposure to iron oxide nanoparticles may induce neurotoxicity. For example, intranasal administration of iron oxide nanoparticles accumulated in the olfactory bulb and hippocampus, and induced cell morphological changes, including endoplasmic reticulum (ER) dilation and an increased amount of lysosomes (Wang et al., 2011c).
Furthermore, iron oxide nanoparticles induced neuron damage via oxidative stress, as evidenced by an increased activity of antioxidants and a decreased level of the total
6
GSH (Wang et al., 2007; Wang et al., 2009). As to in vitro studies, iron oxide nanoparticles inhibited cell viability and the neurite generation induced by nerve growth factor stimulation in rat pheochromocytoma cell line, PC12 cells (Pisanic et al., 2007).
In addition to neurons, iron oxide nanoparticles caused microglial proliferation, activation and recruitment in the olfactory bulb after intranasal instillation. Iron oxide nanoparticles induce cell proliferation, phagocytosis and oxidative stress in BV-2 cells, a murine microglial cell line (Wang et al., 2011c). However, the study pertaining to the effect of iron oxide nanoparticles on the immune in the CNS is limited.
1.5 Microglia
Microglia are the resident immune cells in the CNS and considered to serve as a guardian of the brain. In the adult brain and under physiological conditions, resting microglia have low expression of surface antigens and ramified morphology, including a small cellular body and ramified processes. Resting microglia possess a variety of ability to support neurogenesis, including the secretion of neurotrophic factor and phagocytosis (Saijo et al., 2011). The morphological changes from resting ramified form to activated amoeboid form, including rod-cell shaped and hypertrophy cellular body. The earliest responses of activated microglia are proliferation, recruitment peripheral macrophages and migration to the injury and inflammatory sites. Microglia are also the predominant phagocyte in the CNS. They engulfed pathogens and removed the apoptotic cells and cellular debris to maintain homeostasis in the CNS. In response to pathogen infection, injury and foreign particle invasion, microglia are activated and enhance the expression of surface receptors, including major histocompatibility complex (MHC) and complement receptors. Activated microglia are capable of generating several cytotoxic factors, such as NO, ROS, proteases, and other inflammatory mediators. The cytokines produced by activated microglia play an
7
essential role in regulating the inflammatory responses in the CNS. The proinflammatory cytokines, such as IL-1β, IL-6, IL-8 and TNF-α, are produced by activated microglia to promote inflammatory responses (Kim et al., 2005). The antigen presentation of microglia is to serve as a link between the innate and adaptive immune systems. After engulfing antigen-containing pathogens and infected cells, microglia have abilities to process antigen and present peptides on the cell surface to stimulate T cells. MHC class-II and co-stimulatory molecules such as B7 are expressed together with the processed antigens (Garden et al., 2006). Though microglia serve as the main immune effector cells in the CNS, over-activation of microglia is participated in a variety of neurologic diseases including multiple sclerosis, Parkinson's disease, Alzheimer's disease, human immunodeficiency virus dementia and stroke. For example, the amyloid-β protein that is considered as a possible etiologic factor in Alzheimer's disease recruits and activates microglia. The activation of microglia plays a role in the initiation stage of disease progression and neuronal death (Garden et al., 2006; Kim et al., 2005; Minagar et al., 2002).
1.6 Immunological impacts of nanoparticles on microglia
Nanoparticles can enter into the CNS and alter the function of microglia, including gold, silica, TiO2 and iron oxide nanoparticles. For example, gold nanoparticles were internalized into the lysosomes of murine microglial N9 cells and enhanced IL-1α and granulocyte/macrophage colony stimulating factor (GM-CSF) secretion. In addition, intranasal administration of gold nanoparticles elicited the activation of microglia and up-regulation of TLR-2 in the olfactory bulb (Hutter et al., 2010). Silica nanoparticles (SiNP) can be internalized and accumulated in the cytoplasm and phagocytic vacuoles of microglia. Microglia exposed to SiNP did not affect cell viability and the phagocytic activity, but elicited oxidative stress and the production of IL-1β. SiNP increased the
8
gene expression of cyclooxygenase-2 and inhibited TNF-α expression (Choi et al., 2010). Exposure of BV-2 microglial cells to TiO2 nanoparticles elicited ROS production within few minutes followed by an increase in the mitochondrial membrane potential and apoptotic cell death. TiO2 nanoparticles also enhanced the expression of the inflammation-associated genes in microglia (Long et al., 2006; Long et al., 2007).
Likewise, iron oxide nanoparticles have been demonstrated to alter the functionality of microglia. Iron oxide nanoparticles can be engulfed by BV-2 microglial cells and caused the disappearance of mitochondrial cristae and swelling of ER. The internalized iron oxide nanoparticles elicited proliferation and the production of ROS and NO. In addition, intranasal administration of iron oxide nanoparticles to mice resulted in neuron loss and microglial activation in the olfactory bulb, hippocampus and striatum (Wang et al., 2011c).
1.7 Objective of the study
Iron oxide nanoparticles have been used for biomedical research and clinical diagnosis. Numerous reports have demonstrated that iron oxide nanoparticles affect various immune functions. (Blank et al., 2011; Hsiao et al., 2008; Wang et al., 2011a).
Recently, our laboratory reported that iron oxide nanoparticles inhibited the antigen-specific antibody production and T lymphocytes responses in OVA-sensitized mice (Shen et al., 2011b). In addition, iron oxide nanoparticles inhibited the IFN-γ production in antigen-primed splenocytes associated with a diminished intracellular level of GSH (Shen et al., 2011a). These results suggest that iron oxide nanoparticles alter antigen-specific immunity and T cell functionality.
Iron oxide nanoparticles are employed for various diagnostic and potential therapeutic applications in the CNS, including imaging, targeted cancer therapy and hyperthermal therapy in glioma treatment (Engberink et al., 2010; Nunes et al., 2012;
9
Silva et al., 2011; Silva, 2008; Spuch et al., 2012). Iron oxide nanoparticles have been shown to induce oxidative stress and neuron damage in mouse brain (Wang et al., 2009).
Iron oxide nanoparticles also induced cell proliferation and caused oxidative stress in microglia (Wang et al., 2011c). These results suggest that iron oxide nanoparticles could activate microglia and induce neurotoxicity. To date, most of studies investigate the effect of nanoparticles on resting microglia. Studies pertaining to the effect of nanoparticles on the defense capacity of microglia against pathogens are scarce.
Therefore, the objective of the study was to investigate the effect of iron oxide nanoparticles on the functionality of LPS-stimulated microglia. LPS is the major outer membrane component of gram-negative bacteria cell wall, which can activate microglia, thus serve as standard agents in mimicking bacterial infections (Draheim et al., 1999;
Prinz et al., 1999).
10
Chapter 2 Materials and Methods
2.1 Chemicals and reagents
Resovist® (Ferucarbotran; Schering AG, Berlin, Germany) was the commercial prepared carboxydextran-coated iron oxide nanoparticles that exhibited a monodisperse population of particles with an average diameter to be 58.7 nm, using a particle size analyzer(Shen et al., 2011a). The crystalline core of Resovist® is composed of Fe3O4
and γ-Fe2O3. Resovist® is a solution containing 28 mg Fe/mL and stored at 4°C. For cell culture experiments, Resovist® was diluted to 1, 10, 50, 100 μg Fe/mL with cultured medium.
Anaspec (San Jose, CA): TNF-α converting enzyme (TACE) activity assay kit
Amresco (Solon, OH, USA): ethylene diamine tetraacetic acid (EDTA), sodium chloride (NaCl), sodium phosphate (Na2HPO4)
BD Biosciences (San Jose, California USA): all the antibodies for ELISA assay.
BioLegend (San Diego, CA, USA): anti-mouse CD11b-PE/Cy5, anti-mouse ED-1-APC BioShop (Ontario, Canada): sodium dodecyl sulfate (SDS)
Bio West (Miami, FL, USA): potassium dihydrogen phosphate (KH2PO4), trypan blue Chemicon (Temecula, CA): Hoechst 33258, IL-1β converting enzyme (ICE) protease assay kit
GeneTex (San Antonio, TX): anti-mouse Iba-1 Hayashi (Osaka, Japan): potassium chloride (KCl)
Hyclone (Logan, UT, USA): horse serum, penicillin-streptomycin
Immunochemistry Technologies (Bloomington, MN): Magic Red™ Cathepsin B Assay Kit
Invitrogen (Carlsbad, CA, USA): DQ™ Ovalbumin, E. coli BioParticles-pHrodo, fetal
11
bovine serum (FBS), LysoSensor™ Green DND-189, LysoTracker™ Red DND-99, ProLong Gold antifade reagent
Merck (Darmstadt, Germany): acetone, ethanol absolute, paraformaldehyde, sodium azide, sulfuric acid (H2SO4)
Millipore (Billerica, MA,): poly-D-lysine
MP biomedicals (Solon, OH, USA): dimethyl sulfoxide (DMSO)
Serotech (Oxford, UK): FITC- conjugated anti-rabbit IgG secondary antibody
Sigma (St. Louis, MO, USA): 3-(4,5-dimethylthiazol-2-yl)-2,5-diphenyl-tetrazolium bromide (MTT), acridine orange (AO), albumin bovine serum (BSA), LPS (Escherichia coli O55:B5), sodium bicarbonate (NaHCO3), sodium carbonate (Na2CO3), Triton X-100, Tween 20
Tocris bioscience (Ellisville, MO, USA): Ac-YVAD-AFC
2.2 Culture of primary murine microglial cells
Primary microglia were prepared from cerebral cortices of 1-3 days old BALB/c mice obtained from the Animal Center of National Taiwan University Hospital. After removing meninges aseptically, neocortical tissues were plated onto 75 cm2 cell culture flasks coated with 25 μg/mL poly-D-lysine. Mixed glial cultures were maintained in DMEM containing 10% heat inactivated FBS, 10% horse serum, 4 mM L-glutamine, 100 U/mL penicillin and 100 μg/mL streptomycin. Cells were cultured at 37°C and 5%
CO2 for 12-14 days. Microglia were obtained from the mixed glia cultures by shaking at 165 rpm for 3 h at 37°C. The cell concentration of floating cells was counted using a hemacytometer with trypan blue staining. The floating cells concentration was adjusted to 4×10⁵ cells/mL. According to experimental design, microglia were reseeded onto 24-well (0.5 mL), 48-well (0.3 mL), 96-well culture plate (0.1 mL), 3.5-cm dish (2 mL) and 6-cm dish (5.5 mL) followed by cultured at 37˚C and 5% CO2. After 2 h,
12
unattached cells were removed by replacing the medium with DMEM containing 1%
horse serum, 4 mM L-glutamine, 100 U/mL penicillin and 100 μg/mL streptomycin.
Adherent cells were incubated for 1 h before being used for experiments. More than 85% of the adherent cells were positive for microglia-specific marker CD11b.
2.3 Internalization of iron oxide nanoparticles and colocalized with lysosome Microglia (4 x 10⁵ cells/mL) were cultured on 10-mm coverslips coated with 25 μg/mL poly-D-lysine (0.25 mL/well) and treated with iron oxide nanoparticles (1-100 μg Fe/mL) for 30 min followed by stimulation with LPS (Escherichia coli O55:B5, 100 ng/mL) for 24 h. At the end of incubation, microglia were stained with 1 μM LysoTracker™ Red DND-99 for 2 h at 37°C. After washing twice with PBS (phosphate buffered saline, pH 7.4), cells were fixed with 4% paraformaldehyde for 15 min at room temperature followed by washing with PBS twice. For detection of nuclei, the fixed cells were stained with 5 μg/mL of Hoechst 33258 at room temperature for 5 min. After washing, the cells were mounted in ProLong Gold antifade reagent. Fluorescence confocal images were taken using laser-confocal scanning microscope (Leica TCS SP5 II, Wetzlar, Germany) at emission of 450 nm (Hoechst) and 519 nm (LysoTracker).
2.4 Measurement of cell viability by MTT assay
The viability was evaluated by the 3-(4,5-dimethylthiazol-2-yl)-2,5-diphenyl-tetrazolium bromide (MTT) assay. Microglia
(4 x 10⁵ cells/mL) were cultured in triplicate in 96-well plates (0.1 mL/well) and treated with iron oxide nanoparticles (1-100 μg Fe/mL) for 30 min followed by stimulation with LPS (100 ng/mL) for 24 h. An MTT stock solution (5 mg/mL) was added to the culture (10 μL/well) and incubated for 4 h. The formed formazan was dissolved with a lysis buffer (10% SDS in N,N-dimethylformamide). The absorbance of the formazan product was measured at 570 nm and at 630 nm as background using a microplate
13
reader (Dynatech Laboratories, Chantilly, VA, USA).
2.5 Detection of microglial activation marker expression
Microglial cells (4 x 10⁵ cells/mL) were pretreated with iron oxide nanoparticles (1-100 μg Fe/mL) in triplicate for 30 min followed by stimulated with 100 ng/mL LPS for 24 h. The expression of the activation marker of microglia, ionized calcium-binding adaptor molecule-1 (Iba-1) was measured using confocal microscopy and flow cytometry. For confocal imaging, cells were washed with PBS and then fixed in 80%
acetone for 15 min at -20°C. After washing twice, cells were incubated in blocking buffer containing 2.5 % horse serum in PBS for 30 min at 4°C. Cells were stained with rabbit anti-Iba-1 (1:20) in blocking buffer for 1 h at 4°C. After washing twice, the Iba-1 stained cells were incubated with fluorescein isothiocyanate (FITC)-conjugated goat anti-rabbit IgG secondary antibody (1:1000) for 30 min at 4°C in the dark. For detection of the nuclei, the cells were stained with Hoechst 33258 (5 μg/mL). After washing, the cells were mounted in ProLong Gold antifade reagent. Fluorescence confocal images were taken using laser-confocal scanning microscope (Leica TCS SP5 II, Wetzlar, Germany) at emission of 450 nm (Hoechst) and 525 nm (FITC).
For flow cytometry, microglia (4 x 10⁵ cells/mL) were cultured in triplicate in a 24-well plate (0.5 mL/well) and treated with iron oxide nanoparticles followed by stimulation with LPS for 24 h as described above. The cells were fixed with 70%
ethanol overnight and stained for the activation marker as described above. After washing, the single cell fluorescence of each sample was measured using a flow cytometry at emission of 525 nm (BD LSRFortessa, San Jose, CA). The data were analyzed using the software Flowjo 5.7.
2.6 Analysis of phagocytic activity
The phagocytic activity of microglia was evaluated by using E. coli BioParticles
14
conjugated with pHrodo dye following the manufacturer's instructions. Microglial cells were treated with iron oxide nanoparticles as described above in section 2.5. Two hours before the end of incubation, pHrodo E. coli BioParticles (25 μg/μL) were added into each sample. For confocal imaging, cells were fixed and stained with Hoechst 33258 as described above. Fluorescence confocal images were taken using laser-confocal scanning microscope (Leica TCS SP5 II, Wetzlar, Germany) at emission of 450 nm (Hoechst) and 578 nm (pHrodo dye). For flow cytometry, cells were washed twice and single cell fluorescence of each sample was measured using a flow cytometry at emission of 578 nm (BD LSRFortessa, San Jose, CA). The data were analyzed using the software Flowjo 5.7.
2.7 Measurement of cytokines by ELISA
Microglial cells (4 x 10⁵ cells/mL) were cultured in triplicate in a 48-well plate (0.3 mL/well) and treated with iron oxide nanoparticles followed by stimulation with LPS for 24 h as described above in section 2.5. The supernatants were collected and quantified for TNF-α and IL-1β by standard sandwich enzyme-linked immunosorbent assay (ELISA). ELISA plates were coated overnight at 4°C with 50 μL per well of anti-mouse TNF-α or IL-1β monoclonal antibody (1:500 dilution in coating buffer; pH 9.5). The wells were washed three times with Tween 20 (0.1%) in PBS and blocked with 200 μL blocking buffer (1 % bovine serum albumin (BSA) in PBS) at room temperature for 1 h. After washing, 50 μL of samples and standards diluted with blocking buffer were added and incubated at room temperature for 2 hrs. After washing, biotinylated anti-mouse TNF-α or IL-1β monoclonal antibody (TNF-α: 1:500;
IL-1β: 1:2000 in blocking buffer) was added (50 μL/well) and incubated at room temperature for 1 h. After washing, streptavidin-HRP conjugate (TNF-α: 1:250; IL-1β:
1:125 in blocking buffer) was added (50 μL/well) and incubated at room temperature
15
for 30 min. After washing, the 3,3',5,5'-tetramethylbenzidine (TMB) substrate solution was added (50 μL/well) to detect bound peroxidase conjugate. Finally, 150 μL stop solution (3N H2SO4) were added into each well to terminate the reaction. The optical density (O.D.) was measured at 450 nm using a microplate reader (Dynatech Laboratories, Chantilly, VA, USA).
2.8 Measurement of IL-1β converting enzyme activity using enzymatic assay
The IL-1β converting enzyme (ICE) activity was measured spectrophotometrically with a commercial ICE protease assay kit using ICE fluorogenic substrates Ac-YVAD-AFC. Microglial cells (4 x 10⁵ cells/mL) were cultured in a 6-cm dish (5.5 mL/dish) and treated with iron oxide nanoparticles followed by stimulation with LPS for 24 h as described above. After washing twice, the cells were scraped and dissolved with 25 μL lysis buffer for 10 min at 4°C. After centrifugation (10,000 x g, 1 min, 4°C) the supernatants were collected. For measurement ICE activity, 25μL of sample dissolved with lysis buffer was incubated with 25 μL of diluted ICE substrates (200 μM in lysis buffer) and DTT (5 mM in lysis buffer) in a 96-well black plate for 1 h at 37°C in the dark. The absorbance in the wells was detected at 505 nm after excited by 400 nm, using a fluorescence microplate reader (Dynatech Laboratories, Chantilly, VA, USA).
2.9 Measurement of TNF-α converting enzyme activity using enzymatic assay
The TNF-α converting enzyme (TACE) activity was measured spectrophotometrically with a commercial TACE activity assay kit. Microglial cells (4 x 10⁵ cells/mL) were cultured in a 3.5-cm dish (2 mL/dish) and treated with iron oxide nanoparticles followed by stimulation with LPS for 24 h as described above. After washing twice, the cells were scraped and dissolved with 50 μL lysis buffer (0.1%
Triton X-100 in assay buffer). After centrifugation (2,500 x g, 10 min, 4°C) the supernatants were collected. For measurement TACE activity, 25 μL of sample or
16
standards diluted with lysis buffer was incubated with 25 μL of diluted TACE substrates (40 μM in assay buffer) in a 96-well black plate for 1 h at 37°C in the dark, and then 25 μL of stop solutions were added into each well to terminate the reaction. The absorbance in the wells was detected at 520 nm after excited by 490 nm, using a fluorescence microplate reader (Dynatech Laboratories, Chantilly, VA, USA).
2.10 Analysis of amount of lysosomes
The total lysosomal number of microglia was evaluated by ectodermal dysplasia-1 (ED-1) expression that was determined using confocal microscopy and flow cytometry.
Microglial cells were treated with iron oxide nanoparticles, fixed and blocked as described above in section 2.5. The cells were stained with allophycocyanin (APC)-labeled rat anti-ED-1 antibody (1 μg/106 cells ) in blocking buffer for 1 h at 4°C in the dark. For confocal imaging, cells were also stained with Hoechst 33258 for imaging nuclei. Fluorescence confocal images were taken using a laser-confocal scanning microscope (Leica TCS SP5 II, Wetzlar, Germany) at emission of 450 nm (Hoechst 33258) and 670 nm (APC). For flow cytometry, the single cell fluorescence of each sample was measured using a flow cytometry at emission of 670 nm (BD LSRFortessa, San Jose, CA). The data were analyzed using the software Flowjo 5.7.
2.11 Measurement of lysosomal membrane permeability
The lysosomal permeability of microglia was measured with acridine orange (AO) staining by flow cytometry. In brief, microglial cells were treated with iron oxide nanoparticles as described above. At the end of incubation, the cells were stained with 5 μg/mL AO for 10 min at 37°C. After washing, the single cell fluorescence of each sample was measured using a flow cytometry at emission of 617 nm (BD LSRFortessa, San Jose, CA). The data were analyzed using the software Flowjo 5.7.
17
2.12 Measurement of lysosomal pH
The lysosomal pH of microglia was measured with LysoSensor™ Green DND-189 staining by confocal microscopy and flow cytometry. Microglial cells were treated with iron oxide nanoparticles as described above. At the end of incubation, the cells were stained with 1 μM LysoSensor for 2 h at 37°C. For confocal imaging, cells were also stained with Hoechst 33258. Fluorescence confocal images were taken using a laser-confocal scanning microscope (Leica TCS SP5 II, Wetzlar, Germany) at emission of 450 nm (Hoechst 33258) and 519 nm (LysoSensor). For flow cytometry, the single cell fluorescence of each sample was measured using a flow cytometry at emission of 519 nm (BD LSRFortessa, San Jose, CA). The data were analyzed using the software Flowjo 5.7.
2.13 Measurement of proteolytic activity
The proteolytic activity of microglia was determined using DQ™ Ovalbumin (DQ-OVA) by confocal microscopy and flow cytometry. Microglial cells were treated with iron oxide nanoparticles as described above. At the end of incubation, the cells were stained with 50 μg/mL DQ-OVA for 1 h at 37°C. For confocal imaging, cells were fixed and stained with Hoechst 33258. Fluorescence confocal images were taken using a laser-confocal scanning microscope (Leica TCS SP5 II, Wetzlar, Germany) at emission of 450 nm (Hoechst 33258) and 510 nm (DQ-OVA). For flow cytometry, the single cell fluorescence of each sample was measured using a flow cytometry at emission of 519 nm (BD LSRFortessa, San Jose, CA). The data were analyzed using the software Flowjo 5.7.
2.14 Measurement of cathepsin B activity
The cathepsin B activity of microglia was measured using Magic Red™ cathepsin B assay kit by flow cytometry following the supplier’s instructions. In brief, microglial
18
cells were treated with iron oxide nanoparticles as described above. At the end of incubation, the cells were stained with cell-permeable cathepsin B substrate for 1 h at 37°C. After washing, the single cell fluorescence of each sample was measured using a flow cytometry at emission of 617 nm (BD LSRFortessa, San Jose, CA). The data were analyzed using the software Flowjo 5.7.
2.15 Statistical analysis
The data were expressed as mean ± standard error (SE) for each treatment group in the individual experiments. Statistical differences between groups were evaluated by one-way ANOVA and Student’s t-test was used to compare treatment groups to the vehicle control when significant differences were observed. *, p < 0.05 was defined as statistically significant.
19
Chapter 3 Results
3.1 Uptake of iron oxide nanoparticles by LPS-stimulated microglia
The concentration range (1-100 μg Fe/mL) of iron oxide nanoparticles used in the present study corresponded to 0.11-11 times of the estimated plasma concentration after intravenous administration of the clinically recommended dose of Resovist® (Hsiao et al., 2008; Metz et al., 2004). Murine microglial cells were either left untreated (naïve;
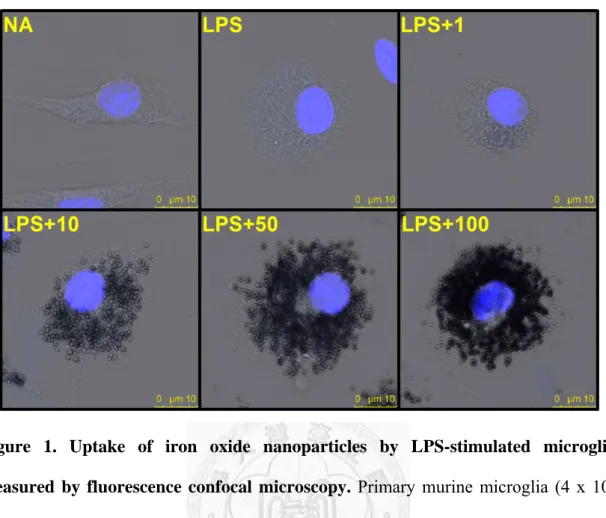
NA), or treated with iron oxide nanoparticles (1-100 μg Fe/mL) for 30 min followed by stimulation with LPS (100 ng/mL) for 24 h. Confocal microscopy was employed to visualize the uptake of iron oxide nanoparticles by microglia. As expected, the resting microglial cell (the NA group) exhibited spindle-shaped morphology (Fig. 1). Upon LPS stimulation, the morphology of activated microglia became hypertrophied and amoeboid (the LPS group). In addition, iron oxide nanoparticles were engulfed by microglia in a concentration-related manner, as evidenced by the accumulation of dark vesicles accumulated in the cytoplasm. The cell exposed to the highest concentration (100 μg Fe/mL) of iron oxide nanoparticles showed that almost the entire cytoplasm was filled with dark vesicles (Fig. 1).
20
Figure 1. Uptake of iron oxide nanoparticles by LPS-stimulated microglia measured by fluorescence confocal microscopy. Primary murine microglia (4 x 10⁵ cells/mL) were either left untreated (naïve; NA), or treated with iron oxide nanoparticles (1-100 μg Fe/mL) for 30 min followed by stimulation with LPS (100 ng/mL) for 24 h.
Representative confocal microscopic images of microglial cells stained with Hoechst (blue) are shown. Lower panels show that the cytoplasm of microglial cells treated with iron oxide nanoparticle (10, 50 and 100 μg Fe/mL) was filled with an increasing density of dark vesicles. Similar results were observed in three independent experiments.
21
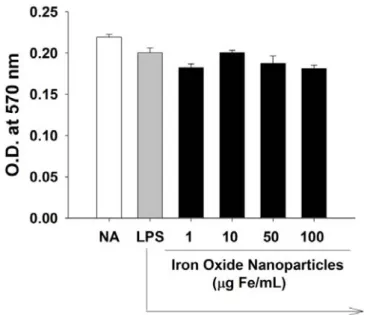
3.2 No cytotoxic effect of iron oxide nanoparticles on LPS-stimulated microglia The potential cytotoxic effects of iron oxide nanoparticles on LPS-stimulated microglia were examined using the MTT assay. Cells were treated with iron oxide nanoparticles and LPS as described above in Fig. 1, the MTT activity of cells was comparable among different groups (Fig. 2). Moreover, Hoechst staining also showed that the morphology of nuclei of microglia treated with iron oxide nanoparticles remained round and homogeneously stained, suggesting no induction of apoptosis (Fig.
1). These results demonstrated that a 24 hrs-exposure to iron oxide nanoparticles did not induce cytotoxic effects in LPS-stimulated microglia under the employed experimental conditions.
Figure 2. No effect of iron oxide nanoparticles on the viability of LPS-stimulated microglia. Primary murine microglia (4 x 10⁵ cells/mL) were either left untreated (NA), or treated with iron oxide nanoparticles (1-100 μg Fe/mL) for 30 min followed by stimulation with LPS (100 ng/mL) for 24 h. At the end of incubation, the viability of microglia was determined by the MTT assay. Data are expressed as the mean ± SE of triplicate samples per group. Results are a representative of three independent experiments.
22
3.3 Iron oxide nanoparticles inhibited the activation of LPS-stimulated microglia To evaluate the effect of iron oxide nanoparticles on the activation of microglia, the expression of Iba-1 was examined by confocal microscopy and flow cytometry. In activated microglia, Iba-1 is associated with actin in the membrane ruffling and phagocytic cups, which is involved in cytoskeleton rearrangement (Imai et al., 2002;
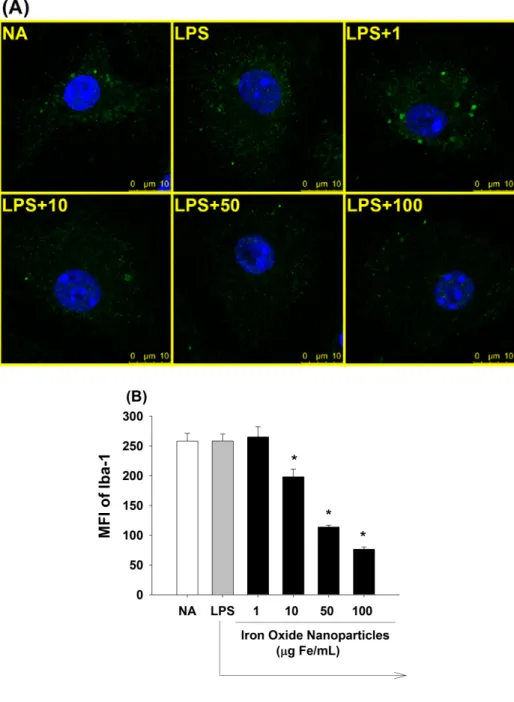
Ohsawa et al., 2000). As shown in Fig. 3A, the low concentration of iron oxide nanoparticles (1 μg Fe/mL) did not influence the expression of Iba-1, as compared to the LPS-stimulated control. However, the expression of Iba-1 was significantly inhibited by treatment with iron oxide nanoparticles at greater concentrations (10, 50, and 100 μg Fe/mL) in a concentration-dependent manner. Similar results were confirmed with the quantified data from flow cytometric analyses (Fig. 3B).
23
Figure 3. Suppression by iron oxide nanoparticles of Iba-1 expression in LPS-stimulated microglia. Microglia were either left untreated (NA), or treated with iron oxide nanoparticles (1-100 μg Fe/mL) for 30 min followed by stimulation with LPS (100 ng/mL) for 24 h. (A) The expression of Iba-1 (green) and the nucleus (blue) was visualized by fluorescence confocal microscopy. (B) The single cell fluorescence of Iba-1 was measured by flow cytometry. Results were expressed as the mean ± SE of samples pooled from three independent experiments. *, p < 0.05 as compared to the LPS group.
24
3.4 Iron oxide nanoparticles inhibited the phagocytic activity of LPS-stimulated microglia
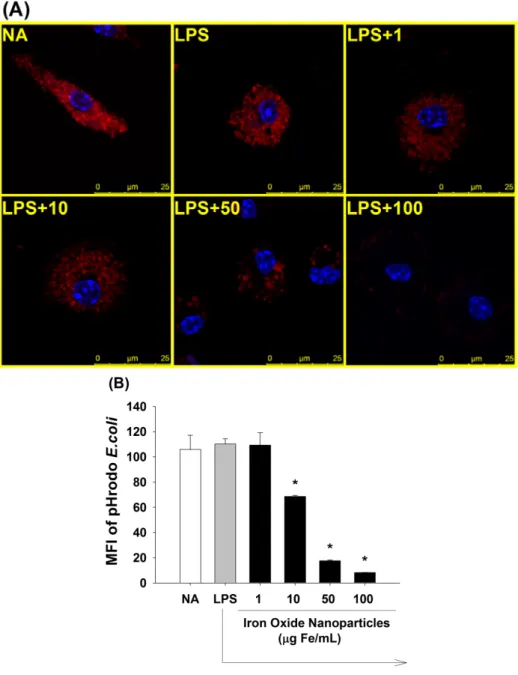
Phagocytosis is a crucial function for microglia to engulf invading pathogens, as well as for managing CNS injury and maintaining homeostasis. To examine the effect of iron oxide nanoparticles on the phagocytic activity of LPS-stimulated microglia, pHrodo E. coli particles were used. Upon the ingestion of the pHrodo E. coli particles by microglia, the pH-sensitive dye emits red fluorescence in the acidic environment inside lysosomes. Exposure of microglia to iron oxide nanoparticles (10-100 μg Fe/mL), in a concentration-dependent fashion, attenuated the phagocytic activity of microglia, as evidenced by a marked decrease in the red fluorescence (Fig. 4A). Similar results were confirmed with the quantified data from flow cytometric analyses (Fig. 4B).
25
Figure 4. Suppression by iron oxide nanoparticles of the phagocytic activity of LPS-stimulated microglia. Microglia (4 x 10⁵ cells/mL) were either left untreated (NA) or treated with iron oxide nanoparticles for 30 min followed by stimulation with LPS (100 ng/mL) for 24 h. Two hours before the end of incubation, pHrodo E. coli BioParticles (25 μg/μL) were added into each sample. (A) Fluorescent images were obtained by confocal microscopy. The merged images of pHrodo E. coli particles (red) and nuclei (blue) were shown. (B) The single cell fluorescence of pHrodo E. coli particles was measured by flow cytometry. Data are expressed as the mean ± SE of triplicate samples per group. *, p < 0.05 as compared to the LPS group. Results are a
26
representative of three independent experiments.
3.5 Iron oxide nanoparticles differentially affected the secretion of proinflammatory cytokines in LPS-stimulated microglia
To further investigate the potential impact of iron oxide nanoparticles on the functional activities of microglia, the production of two proinflammatory cytokines, namely IL-1β and TNF-α, by LPS-stimulated microglia was examined. As shown in Fig.
5, the level of cytokines without LPS stimulation was not detectable and LPS stimulation markedly induced the production of both proinflammatory cytokines (ΝΑ vs. LPS). Notably, the production of IL-1β in LPS-stimulated microglia was significantly suppressed by iron oxide nanoparticles (10-100 μg Fe/mL) in a concentration-dependent manner (Fig. 5A), whereas TNF-α was unaltered (Fig. 5B).
Figure 5. Differential effects of iron oxide nanoparticles on the production of proinflammatory cytokines by LPS-stimulated microglia. Microglia were either left untreated (NA), or treated with iron oxide nanoparticles (1-100 μg Fe/mL) for 30 min followed by stimulation with LPS (100 ng/mL) for 24 h. The level of (A) IL-β and (B) TNF-α in the culture supernatants was measured by ELISA. Data are expressed as the mean ± SE of triplicate samples per group. *, p < 0.05 as compared to the LPS group.
Results are a representative of three independent experiments.
27
3.6 Iron oxide nanoparticles differentially affected the activity of ICE and TACE in LPS-stimulated microglia
The proteolytic activity of ICE and TACE was required for maturation of IL-1β and TNF-α, respectively (Black, 2002; Chauvet et al., 2001). As iron oxide nanoparticles induced a differential effect on the production of IL-1β and TNF-α, the activity of ICE and TACE were therefore measured by employing specific fluorescent substrates. Upon proteolytic cleavage, products of Ac-YVAD-AFC (ICE substrate) and 5-FAM (TACE substrate) emitted fluorescence at 505 and 520 nm, respectively. The results demonstrated that iron oxide nanoparticle (50 μg Fe/mL) significantly inhibited the activity of ICE in LPS-stimulated microglia (Fig. 6A), but not TACE (Fig. 6B).
Figure 6. Differential effect of iron oxide nanoparticles on the activity of IL-1β converting enzyme (ICE) and TNF-α converting enzyme (TACE) in LPS-stimulated microglia. Microglia were either left untreated (NA), or treated with iron oxide nanoparticles (50 μg Fe/mL) for 30 min followed by stimulation with LPS (100 ng/mL) for 24 h. (A) The activity of (A) ICE and (B) TACE of cell lysates were measured using specific substrates as described in the materials and methods. Data are expressed as the mean ± SE of triplicate samples per group. *, p < 0.05, as compared to the LPS group. Results are a representative of three independent experiments.
28
3.7 The distribution of iron oxide nanoparticles in lysosomes of LPS-stimulated microglia
Previous studies reported that iron oxide nanoparticles were accumulated in lysosomes of macrophages (Lunov et al., 2010b). To investigate if iron oxide nanoparticles were distributed to lysosomes, nanoparticle-treated microglia were stained with the lysosomal marker LysoTracker™ Red DND-99. Confocal microscopic images showed that some of the dark vesicles were co-localized with the red fluorescence of lysosomes in iron oxide nanoparticle (10 μg Fe/mL)-treated microglia (Fig. 7).
Figure 7. The distribution of iron oxide nanoparticles in lysosomes of LPS-stimulated microglia. Microglia (4 x 10⁵ cells/mL) were treated with iron oxide nanoparticles (10 μg Fe/mL) for 30 min followed by stimulation with LPS (100 ng/mL) for 24 h. Representative images were obtained by confocal microscopy. Bright field and merged images of LysoTracker (red) and nuclei (blue) were shown. Arrows indicate the co-localization of black vesicles and lysosomes in the cell treated with iron oxide nanoparticles. Similar results were observed in three independent experiments.
29
3.8 Iron oxide nanoparticles increased the amount of lysosomes in LPS-stimulated microglia
The above results demonstrated that iron oxide nanoparticles were engulfed and distributed into lysosomes. The lysosome is an acidic organelle containing hydrolytic enzymes capable of digesting intracellular components and extracellular materials that have been endocytosed (Saftig et al., 2009). ED-1, a member of the lysosome associated with membrane protein (LAMP)-1 family expressed by phagocytes (Song et al., 2011), was used to investigate the effect of iron oxide nanoparticles on the amount of lysosomes. As shown in Fig. 8A, the expression of ED-1 was markedly increased in the microglia which was treated with greater concentrations of iron oxide nanoparticles (10-100 μg Fe/mL) compared to the LPS control. At concentrations of 50 and 100 μg Fe/mL, the effect of iron oxide nanoparticles on ED-1 expression was comparable reaching a plateau. The results were confirmed by the quantified data from flow cytometric analyses (Fig. 8B).
30
Figure 8. Effect of iron oxide nanoparticles on the amount of lysosomes in LPS-stimulated microglia. Microglia (4 x 10⁵ cells/mL) were either left untreated (NA), or treated with iron oxide nanoparticles (1-100 μg Fe/mL) for 30 min followed by stimulation with LPS (100 ng/mL) for 24 h. (A) The expression of ED-1 (red) and the nucleus (blue) werevisualized by fluorescence confocal microscopy. (B) The single cell fluorescence of ED-1 was measured by flow cytometry. Results are expressed as the mean ± SE of samples pooled from three independent experiments. *, p < 0.05 as compared to the LPS group.
31
3.9 Iron oxide nanoparticles increased lysosomal membrane permeability in LPS-stimulated microglia
The lysosomal membrane is essential to maintain the acidic component, resist digestion, and prevent the leakage of acid hydrolases into the cytosol. The induction of lysosomal membrane permeability provokes the translocation of lysosomal contents to the cytosol, which may causes cell death (Boya et al., 2008). To examine the effect of iron oxide nanoparticles on lysosomal permeability, acridine orange (AO), a lysosomotropic dye emitting red fluorescence at acidic compartments, was employed.
An increase in lysosomal membrane permeability leads to a decrease in the red fluorescence intensity due to the translocation of AO out of lysosomes (Zdolsek et al., 1990). Compared to the LPS control, the AO fluorescence of microglial cells treated with iron oxide nanoparticles (10-100 μg Fe/mL) was significantly attenuated in a concentration-dependent manner (Fig. 9). These data showed that exposure to iron oxide nanoparticles markedly increased the lysosomal membrane permeability.
32
Figure 9. Effect of iron oxide nanoparticles on lysosomal membrane permeability in LPS-stimulated microglia. Microglia (4 x 10⁵ cells/mL) were either left untreated (NA), or treated with iron oxide nanoparticles for 30 min followed by stimulation with LPS (100 ng/mL) for 24 h. The lysosomal membrane permeability was determined by flow cytometry using acridine orange (AO). The single cell fluorescence of AO was measured by flow cytometry. Data are expressed as the mean ± SE of triplicate samples per group. *, p < 0.05 as compared to LPS group. Results are a representative of three independent experiments.
33
3.10 Iron oxide nanoparticles induced lysosomal alkalinization in LPS-stimulated microglia
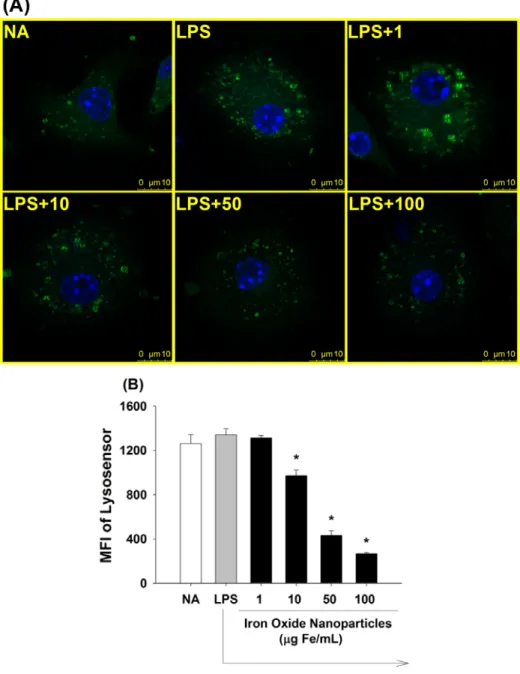
Most lysosomal enzymes require an optimal pH of 4.5-5 to maintain their degradation capacity (Trombetta et al., 2003). To investigate the effect of iron oxide nanoparticles on lysosome acidity, LysoSensor Green DND-189, an acidotropic probe that emits fluorescence upon acidification, was used. As shown in Fig. 10, results from confocal microscopy and flow cytometry showed that the green fluorescence of LysoSensor was attenuated in iron oxide nanoparticle (10-100 μg Fe/mL)-treated groups in a dose-dependent manner, as compared to the LPS group.
34
Figure 10. Induction by iron oxide nanoparticles of lysosomal alkalinization in LPS-stimulated microglia. Microglia (4 x 10⁵ cells/mL) were either left untreated (NA), or treated with iron oxide nanoparticles (1-100 μg Fe/mL) for 30 min followed by stimulation with LPS (100 ng/mL) for 24 h. To evaluate lysosomal pH, the cells were stained with LysoSensor. (A) Representative images were obtained by confocal microscopy showing the LysoSensor signal (green) and nuclei (blue). (B) The single cell fluorescence of LysoSensor was measured by flow cytometry. Data are expressed as the mean ± SE of triplicate samples per group. *, p < 0.05 as compared to the LPS group. Results are a representative of three independent experiments.
35
3.11 Iron oxide nanoparticles inhibited lysosomal degradation capacity in LPS-stimulated microglia
The above results showed that iron oxide nanoparticles increased lysosomal pH and membrane permeability, suggesting a potential impairment of the lysosomal functions. To further examine the effect of iron oxide nanoparticles on lysosomal proteolytic activity, microglial cells were labeled with DQ™ Ovalbumin (DQ-OVA), a self-quenched indicator that emits green fluorescence upon proteolytic degradation. As shown in Fig. 11A, the green fluorescence of DQ-OVA was markedly attenuated in iron oxide nanoparticle (10-100 μg Fe/mL)-treat groups compared to the LPS control. The results were confirmed by the quantified data from flow cytometric analyses (Fig. 11B).
36
Figure 11. Attenuation by iron oxide nanoparticles of lysosomal degradation capacity in LPS-stimulated microglia. Microglia (4 x 10⁵ cells/mL) were either left untreated (NA), or treated with iron oxide nanoparticles (1-100 μg Fe/mL) for 30 min followed by stimulation with LPS (100 ng/mL) for 24 h. To evaluate the lysosomal degradation capacity, the cells were co-cultured with DQ-OVA. (A) Representative images were obtained by fluorescence confocal microscopy showing the signal of proteolytic DQ-OVA (green) and nuclei (blue). (B) The single cell fluorescence of DQ-OVA was determined by flow cytometry. Data are expressed as the mean ± SE of triplicate samples per group. *, p < 0.05 as compared to the LPS group. Results are a
37
representative of three independent experiments.
3.12 Iron oxide nanoparticles inhibited cathepsin B activity in LPS-stimulated microglia
The above results showed that iron oxide nanoparticles attenuated the functionality of LPS-stimulated microglia, including lysosomal alkalinization and differentially affected the secretion of proinflammatory cytokines. Previous studies showed that cathepsin B, a cysteine lysosomal protease, plays an essential role in IL-1β maturation.
Cathepsin B can activate ICE in cell-free and THP-1 monocytic cells at an acidic pH condition (Hentze et al., 2003; Morishige et al., 2010; Terada et al., 2010;
Vancompernolle et al., 1998). To investigate the effect of iron oxide nanoparticles on cathepsin B activity, a cell-permeable fluorogenic substrate for cathepsin B was employed. The substrate emits red fluorescence upon cleavage by cathepsin B. As shown in Fig. 12, the activity of cathepsin B was significant inhibited at iron oxide nanoparticle (10-100 μg Fe/mL)-treat groups compared to the LPS control.
38
Figure 12. Suppression by iron oxide nanoparticles of the cathepsin B activity in LPS-stimulated microglia. Microglia (4 x 10⁵ cells/mL) were either left untreated (NA), or treated with iron oxide nanoparticles (1-100 μg Fe/mL) for 30 min followed by stimulation with LPS (100 ng/mL) for 24 h. The cathepsin B activity was determined by flow cytometry using Magic Red™ cathepsin B assay kit. Data are expressed as the mean ± SE of triplicate samples per group. *, p < 0.05 as compared to the LPS group.
Results are a representative of three independent experiments.
39
Chapter 4 Discussion
Iron oxide nanoparticles have been used clinically as contrast agents to enhance MRI for a variety of diagnostic applications, as well as for potential hyperthermal therapy of glioma. (Engberink et al., 2010; Nunes et al., 2012; Silva et al., 2011; Silva, 2008; Spuch et al., 2012). Several studies demonstrated that intranasal exposure to iron oxide nanoparticles elicited oxidative stress, neurotoxicity, microglial activation and recruitment in the olfactory bulb, hippocampus and striatum (Wang et al., 2009; Wang et al., 2011c). To date, the majority of literature reports focus on the effect of nanoparticles on functional alterations in resting microglia. Evidence pertaining to the impact of nanoparticles on the defense ability of microglia against invading pathogens is scarce. Therefore, the objective of the present study was to investigate the effect of iron oxide nanoparticles on the activation and functionality of LPS-stimulated microglia.
Our results revealed that iron oxide nanoparticles at concentrations < 100 μg of Fe/mL, which was devoid of cytotoxicity (Fig. 2), attenuated the activation and phagocytic activity of LPS-stimulated microglia (Fig. 3 and 4). Interestingly, iron oxide nanoparticles affected the expression of proinflammatory cytokines differentially, in which IL-1β was down-regulated, whereas TNF-α was unaffected (Fig. 5). In addition, iron oxide nanoparticles were internalized into lysosomes (Fig. 7), increased the lysosome amount (Fig. 8) and impaired lysosomal functions (Fig. 9 and 10). Iron oxide nanoparticles also attenuated lysosomal proteolytic capacity and cathepsin B activity (Fig. 11 and 12). Previous studies showed that cathepsin B plays an important role in IL-1β maturation, as it possesses the ability to activate ICE, the protease responsible for pro-IL-1β maturation (Hentze et al., 2003; Terada et al., 2010). In line with the down-regulated cathepsin B activity, the ICE activity and IL-1β secretion was suppressed by iron oxide nanoparticles (Fig. 5A and 6A). These results clearly
40
demonstrated that iron oxide nanoparticles suppressed the functionality of LPS-stimulated microglia, implicating an impaired defense capacity of microglia against gram-negative bacteria.
Considerable evidence indicated that fullerene, gold, iron oxide, quantum dot, and TiO2 nanoparticles affected cytoskeleton remodeling and phagocytic activity in various cells, including microglia (Buyukhatipoglu et al., 2011; Chen et al., 2011;
Johnson-Lyles et al., 2010; Qu et al., 2012; Soenen et al., 2010; Wang et al., 2011b; Wu et al., 2010; Yang et al., 2010b; Yang et al., 2010c). On the contrary, Choi et al. (2010) reported that SiNP did not affect phagocytic activity in microglia (Choi et al., 2010).
Notably, the present study showed that the expression of Iba-1 and the phagocytic activity of microglia were inhibited by iron oxide nanoparticles (Fig. 3 & 4). Iba-1 is a macrophage/microglia-specific actin-binding protein involved in the rearrangement of the membrane cytoskeleton, membrane ruffling and phagocytosis (Imai et al., 2002;
Kanazawa et al., 2002; Kirik et al., 2010; Kohler, 2007; Mishima et al., 2008; Ohsawa et al., 2000). In activated microglia, the expression of Iba-1 is up-regulated, which is positively correlated to the phagocytic ability of microglia (Ji et al., 2007; Levesque et al., 2011; Patro et al., 2010). Collectively, the present results demonstrated that iron oxide nanoparticles inhibited the activation and phagocytic activity of LPS-stimulated microglia, possibly by affecting Iba-1-mediated cytoskeleton rearrangement.
In line with previous results showing the uptake of iron oxide nanoparticles by phagocytic cells (Hsiao et al., 2008; Mou et al., 2011; Yang et al., 2011; Yeh et al., 2010), the results from confocal imaging revealed that iron oxide nanoparticles were engulfed into the cytosol of microglia (Fig. 1). Hsiao et al. (2008) reported that the intracellular iron content reached 23-46.65 pg/cell in Raw 264.7 cells incubated with iron oxide nanoparticles at 10-100 μg Fe/mL for 24 h. Furthermore, iron oxide nanoparticles were engulfed by BV-2 microglial cells and localized in phagocytic