Measuring the Client Performance and Energy Consumption in Mobile Cloud Gaming
Chun-Ying Huang1, Po-Han Chen1, Yu-Ling Huang1, Kuan-Ta Chen2, and Cheng-Hsin Hsu3
1Department of Computer Science and Engineering, National Taiwan Ocean University
2Institute of Information Science, Academia Sinica
3Department of Computer Science, National Tsing Hua University Abstract—Mobile cloud gaming allows gamers to play games
on resource-constrained mobile devices, and a measurement study to quality the client performance and energy consumption is crucial to attract and retain the gamers. In this paper, we adopt an open source cloud gaming platform to conduct extensive experiments on real mobile clients. Our experiment results show two major findings that are of interests to researchers, developers, and gamers. First, compared to mobile native games, mobile cloud games save energy by up to 30%. Second, the frame rate, bit rate, and resolution all affect the decoders’ resource consumption, while frame rate imposes the highest impact. These findings shed some light on the further enhancements of the emerging mobile cloud gaming platforms.
I. INTRODUCTION
Increasingly more companies, such as OnLive, GaiKai, and Ubitus, offer on-demand cloud games to users. These games run on powerful cloud servers, and the game scenes are captured, encoded, and streamed to thin clients running on desktops, laptops, and TV set-top boxes. Each client renders the game scenes and takes the inputs from a gamer. The inputs are sent back to cloud servers, in order to allow gamers to interact with games. Cloud gaming has attracted a lot of attentions [6] and is predicted to be a major growing sector of the game industry in the next few years [1]. Recently, we start to see mobile cloud gaming services, for example in the U.S. [3] and Japan [2], that target the staggering number of mobile device users. With the wide deployment of 4G cellular networks, mobile cloud gaming enables gamers to play their favorite games anywhere and anytime.
Mobile devices, such as tablets and smartphones, have limited computation power and are battery-powered. There- fore, running mobile clients on these resource-constrained devices may lead to inferior performance and high energy consumption. For example, the gaming frame rate may become too low for smooth game play due to insufficient CPU power to execute software video decoders. This results in degraded gaming quality and may drive the gamers away. On the other hand, when gamers play cloud games, the communication, computing, and display components on mobile devices all consume nontrivial energy, which may quickly drain the bat- tery and prevent gamers from using their mobile devices for other purposes, such as making phone calls. Hence, carefully measuring the performance and energy consumption of mobile clients is critical to the success of the new mobile cloud gaming ecosystem.
In this paper, we adopt an open source cloud gaming platform [4], [5], called GamingAnywhere (GA), to setup a real mobile cloud gaming testbed. We conduct extensive experiments on the testbed to answer the two questions: 1) Does running cloud games save energy compared to native mobile games? and 2) How does the server configuration affect the client performance? Our extensive experiments and in-depth analysis depict several insights that lead to design suggestions for future developments of mobile cloud gaming platforms. To the best of our knowledge, similar measurement studies have not been rigorously done in the literature.
II. METHODOLOGY
A. Environment Setup
Figure 1 shows the GA testbed used in our experiments.
The testbed consists of a PC server and a mobile client connected via a wireless access (a campus WiFi or a 3G cellular network). We install five games from different genres on the GA server: Super Smash Bros, Limbo, Batman, Mario Kart, and Zelda. Super Smash Bros is a fighting game, Limbo is a 2D scrolled adventure game, Batman is a 3D adventure game, Mario Kart is a 3D racing game, and Zelda is an RPG.
We study the GA mobile client’s performance and energy consumption using these five games, and report the sample results from Super Smash Bros if not otherwise specified. For comparing cloud and native games, we adopt a cross-platform OpenGL game: GLTron, which runs on both the PC server and Android devices. GLTron is a 3D snake-like game.
The PC server has an Intel Q6600 2.4 Ghz quad-core CPU and runs Windows 7. We consider two mobile devices: an ASUS Nexus 7 tablet and a Sony Xperia Z smartphone. The tablet has a Tegra 3 1.2 quad-core process with 1 GB ram, and the smartphone has an S4 1.5 GHz quad-core processor wth 2 GB ram. Both mobile devices run Android 4.4.2. We adopt two tools, UseMon and CurrentWidget, to collect measurement results. The former is used to collect the CPU utilization of each CPU core. The latter is used to measure the current and voltage of the device, which allows us to calculate the energy consumption. During the experiments, we set the screen brightness to medium, and always keep the battery level above 70% to avoid noises due to battery’s nonlinear discharging characteristics (details are given in Section II-C).
B. Controlled Parameters
Table I lists the controlled parameters during the exper- iments. First our mobile client supports both software and
978-1-4799-6882-4/14/$31.00 c⃝ 2014 IEEE
Wireless AP
(or 3G base station) GamingAnywhere Server Mobile User
Fig. 1. The GA experiment testbed used throughout this paper.
TABLE I. CONTROLLEDPARAMETERS
Parameter Value
Decoder hardware, software
Controller disabled, enabled Video codec parameter‡
Resolution 640x480, 960x720, 1280x720
Bitrate 1Mbps,3Mbps, 5Mbps
Frame rate 10fps,30fps, 50fps
‡Default values are highlighted in boldface.
hardware video decoders. The software decoder is provided by the ffmpeg project, and the hardware decoder is accessed via Android’s MediaCodec framework. We use the popular H.264 coding standard, which is supported by ffmpeg and both mobile devices’ hardware codecs. Second, we selectively disable and enable the controller on mobile devices, which is a transparent overlay over the video surface. When the controller is disabled, we play the games on the PC server.
This is to isolate the additional energy consumption due to:
(i) activating touch screens and (ii) handling the user input events. The remaining three parameters, resolution, bitrate, and frame rate, are for video codecs. In each experiment, we fix two video codec parameters, and vary the other one. We let 640x480, 30 fps (frame per second), and 3 Mbps be the default settings, if not otherwise specified. The goal is to quantify the impacts of different parameters on client performance and energy consumptions.
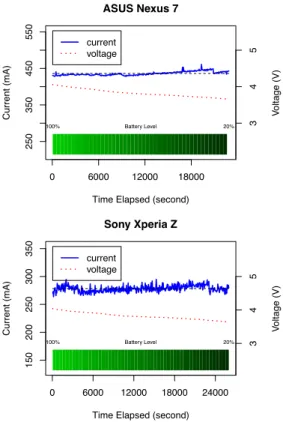
C. Baseline Energy Measurement
We measure the baseline energy consumptions before con- ducting the experiments. We close all irrelevant applications and services, turn on the display, and set brightness to medium.
We find that the CPU utilization is close to zero. We measure the current and voltage for each mobile device, sampled at 1 Hz. The results are shown in Figure 2. On both devices, we observe that when the battery level reduces, the voltage gets lower and the current gets higher. When the battery level is lower than 60%, the current exceeds the average. For fair comparisons, we only conduct experiments when battery level is higher than 70%. Based on the measurements, the baseline power consumption for Nexus 7 and Xperia Z are 1.7 W and 1.1 W, respectively.
III. MEASUREMENTRESULTS
A. Video Codec Parameters
We next present the CPU utilization and power consump- tion under different video codec parameters. We repeat the 3-minute experiment 5 times, collect samples at 1 Hz, and give the average results with minimum and maximum in Figure 3. This figure reports average CPU utilization, i.e., 25% CPU utilization is equivalent to a fully-loaded CPU core.
We make two observations: (i) higher bitrates, frame rates,
250350450550
ASUS Nexus 7
Time Elapsed (second)
Current (mA)
0 6000 12000 18000
345 Voltage (V)
100% Battery Level 20%
current voltage
150200250300350
Sony Xperia Z
Time Elapsed (second)
Current (mA)
0 6000 12000 18000 24000
345 Voltage (V)
100% Battery Level 20%
current voltage
Fig. 2. The voltage and current levels measured under the baseline configuration.
TABLE II. THE PARAMETER IMPACT FACTORS FOR HARDWARE DECODERS
Nexus 7 Xperia Z
Param. Change† a→b b→c a→c a→b b→c a→c
Bitrate +0.14 +0.02 +0.13 +0.07 +0.03 +0.07 Frame rate +0.06 +0.10 +0.10 +0.11 +0.09 +0.14 Resolution +0.07 -0.17 -0.01 +0.01 -0.03 -0.01
†a, b, and c are the minimal, median, and maximal values of each parameter.
and resolutions consume more resources and (ii) the software decoders consume more resources. Next, we take a closer look at how each codec parameter affects the performance of the hardware decoders. We do not consider the software decoders, because neither of the considered mobile devices can keep up with the high frame rate. We define the parameter impact factor as follows. Given a parameter p and a function fp that quantifies the load of p based on its parameters. Suppose p is altered from ci to cj, we write the increased load Lp as
fp(cj)−fp(ci)
fp(ci) . We also measure the battery level differences miand mj for ciand cj, respectively. The increased overhead Op for p is defined as mjm−mi i. Last, the impact factor for parameter p is written as OLpp. Note that we measure the battery level difference to define the parameter impact factor because CPU utilization does not fully reflect system loads, as some workload is offloaded to the hardware decoders. Table II gives the parameter impact factors. This table shows that the frame rate has the highest impact, and the resolution has the lowest.
Hardware Software Bitrate−CPU (Nexus 7)
CPU Utilization (%) 051015202530
7.5 8.9
10.6 16.2
18.6 23.1 1 Mbps 3 Mbps 5 Mbps
Hardware Software
Bitrate−CPU (Xperia Z)
CPU Utilization (%) 051015202530 12.9 13.7
19.4 21.2
24 24.5
1 Mbps 3 Mbps 5 Mbps
Hardware Software
Bitrate−Power (Nexus 7)
Power Consumption (W) 012345
2.9 3.2 3.2
4.2 4.3 4.4
baseline 1 Mbps 3 Mbps 5 Mbps
Hardware Software
Bitrate−Power (Xperia Z)
Power Consumption (W) 01234
2.3 2.4 2.4
2.9 3 3.1
baseline 1 Mbps 3 Mbps 5 Mbps
Hardware Software
Resolution−CPU (Nexus 7)
CPU Utilization (%) 051015202530 8.9
12.9 13.7 18.6
26.4 24.8 640x480 960x720 1280x720
Hardware Software
Resolution−CPU (Xperia Z)
CPU Utilization (%) 05101520253035
13.7 14.2 14
24 27.4 27.9 640x480 960x720 1280x720
Hardware Software
Resolution−Power (Nexus 7)
Power Consumption (W) 0123456
3.2 3.3 3.2
4.3 4.9 4.7
baseline 640x480 960x720 1280x720
Hardware Software
Resolution−Power (Xperia Z)
Power Consumption (W) 01234
2.4 2.4 2.3
3 3.2 3.3
baseline 640x480 960x720 1280x720
Hardware Software
Framerate−CPU (Nexus 7)
CPU Utilization (%) 051015202530
9.5 8.9
11.2 10
18.6 25.5 10 fps 30 fps 50 fps
Hardware Software
Framerate−CPU (Xperia Z)
CPU Utilization (%) 051015202530 12.2 13.7
23.1
14 24
26.1 10 fps 30 fps 50 fps
Hardware Software
Framerate−Power (Nexus 7)
Power Consumption (W) 0123456
3.1 3.2 3.3 3.4
4.3 4.8
baseline 10 fps 30 fps 50 fps
Hardware Software
Framerate−Power (Xperia Z)
Power Consumption (W) 01234
2.2 2.4 2.4 2.5
3 3.3
baseline 10 fps 30 fps 50 fps
Fig. 3. Measured CPU utilization and power consumption under various codec parameters.
B. Cloud versus Native Games
Next, we play Super Smash Bros and GLTron as cloud games and GLTron as a native game. Cloud games are config- ured to stream at 1280x720. The results are shown in Figure 4.
In the figure, “Cloud#1” and “Cloud#2” correspond to Super Smash Bros and GLTron, respectively. “Native” is the Android version of GLTron. It is clear that the native game consumes much more resources than cloud games: the CPU consumption is doubled and the power consumption is also increased by more than 30%. We emphasize that the GLTron game is not very visually-rich, and yet running it natively incurs nontrivial resource consumption. The resource consumption gap between the cloud and native games will be even larger for modern 3D games.
IV. CONCLUSION
In this paper, we implement a testbed using a real mobile cloud gaming platform [4], [5] developed by us. We conduct extensive experiments to measure the client performance and energy consumption. Our measurement results lead to the following main findings. First, running mobile cloud games is more energy efficient than native mobile games. Our ex- periments indicate that mobile cloud games reduce the CPU utilization by half, and save energy by 30%. Second, the video codec parameters (bitrate, frame rate, and resolution) impose different degrees of impacts on CPU utilization and energy consumption. The frame rate affects the most, while the resolution affects the least. These insights lead to design recommendations for future researchers and developers of the emerging mobile cloud gaming platforms.
REFERENCES
[1] Distribution and monetization strategies to increase revenues from cloud gaming. http://www.cgconfusa.com/report/documents/
Content-5minCloudGamingReportHighlights.pdf.
Nexus 7 Xperia Z
Cloud VS Native − CPU
CPU Utilization (%) 0204060
8.9 9.9 10.3 11.6 26.9 28.9
13.7 15.6 15.918 31.1
39.5 Cloud#1
Cloud#1+Ctrl Cloud#2 Cloud#2+Ctrl
Native Native+Ctrl
Nexus 7 Xperia Z
Cloud VS Native − Power
Power Consumption (W) 02468
3.2 3.4 3.3 3.5 4.4 4.8
2.4 2.6 2.5 2.7 3.3 3.7 Cloud#1
Cloud#1+Ctrl Cloud#2 Cloud#2+Ctrl
Native Native+Ctrl
Fig. 4. CPU utilization and power consumption for cloud and native games.
[2] Dragon Quest 10 going mobile in Japan with cloud- streaming service. http://www.shacknews.com/article/81351/
dragon-quest-10-going-mobile-in-japan-with-cloud-streaming.
[3] Enhance your mobile gaming experience with the cloud.
http://www.verizonwireless.com/insiders-guide/entertainment/
mobile-cloud-gaming/.
[4] C.-Y. Huang, C.-H. Hsu, Y.-C. Chang, and K.-T. Chen. Gaminganywhere:
An open cloud gaming system. In Proc. of the ACM Multimedia Systems Conference (MMSys’13), pages 36–47, Oslo, Norway, February 2013.
[5] C.-Y. Huang, C.-H. Hsu, D.-Y. Chen, and K.-T. Chen. Quantifying user satisfaction in mobile cloud games. In Proceedings of ACM Workshop on Mobile Video Delivery (MoVid’13), pages 4:1–4:6, 2014.
[6] P. Ross. Cloud computing’s killer app: Gaming. IEEE Spectrum, 46(3):14, March 2009.