行政院國家科學委員會專題研究計畫 成果報告
光觸媒催化技術於磷化氫氣體降解與量測之研究 研究成果報告(精簡版)
計 畫 類 別 : 個別型
計 畫 編 號 : NSC 99-2221-E-011-082-
執 行 期 間 : 99 年 08 月 01 日至 100 年 07 月 31 日 執 行 單 位 : 國立臺灣科技大學化學工程系
計 畫 主 持 人 : 曾堯宣
計畫參與人員: 碩士班研究生-兼任助理人員:李俞瑩 碩士班研究生-兼任助理人員:李陵杰
報 告 附 件 : 出席國際會議研究心得報告及發表論文
處 理 方 式 : 本計畫涉及專利或其他智慧財產權,2 年後可公開查詢
中 華 民 國 100 年 10 月 25 日
■
□
■ □
NSC 99 2221 E 011 082
99 08 01 100 07 31
( ) ■ □
□
□
■
□
■ □ □
1
( )
IC ICP FTIR XPS
UVA UVC
Langmuir -
Hinshelwood model Power Law
FTIR
XPS
IC
ICP
1.1 1.1.1
(1) (2) (10 × 4.9
cm 2 ) 65~70 2 (3) 70~80
1.1.2 ( )
(1) (2) 0.045 cm/s (3)
100 (4) 300 (5)
(6) UVC (7)
1.1.3 ( )
(1) (2)
STS-01 (3)
(4) 0.028 cm/s (5) 100
(6) 300
1.2
1
FTIR
1.3
1.3.1 (IC, ICP-AES)
(1) 50mL
50mL (2) (1) (3)
1.3.2 X-ray (XPS, X-ray photoelectron spectroscopy)
(1) 1 7
1 (2) 1x1 cm 2 XPS
1.3.3 (FTIR, Fourier transform infrared)
(1) IR
1 3 1
(2) (3) FTIR KBr
KBr
( ) FTIR
FTIR 2
FTIR (100ppmv/N 2 ) IR
2200~2500 cm -1 600~1500cm -1 2200~3000 cm -1
Peak IR
2320~2380cm -1 2340~2360cm -1
IR 2399.01~2392.26cm -1
PH 3
2399.01~2392.26cm -1
FTIR ( 3) 0.5 10.0ppmv
R 2 0.999 FTIR ( )
2.1
40
3
UVA 40
25
UVA 78 kcal/mol
85 kcal/mol UVA
2.2
5 10 ppmv
30 20
30 4
20 80 5.0 10.0ppmv 2.0ppmv
20
(2ppmv) 2.3
5
0.1 0.1
0.1
0.1 ( 0.1
)
2.4
(retention time (R.T))
2.0ppmv 6
20 1000(9.7 )
(Mass transfer)
(Surface reaction) 20 1000(9.7 )
20 1000(9.7 )
2.5
7
0.5 2.0ppmv
2.7
HO2 HO O
8 0 (
) 0
0.01
0.1g 0.01
2 FTIR 3
5
0 100 200 300 400 500
0 1 2 3 4 5 6 7 8 9 10
light off light on
2.0 ppmv 5.0 ppmv 10.0 pp mv
Concentration (ppmv)
Time (s)
0.00 0.05 0.10 0.15 0.20
0 5 10 15 20 25 30 35 40
Conversion (%)
Catalyst Amount (g)
4 5
0 10 20 30 40 50
30 40 50 60 70 80 90
100 y = 0.0145x + 0.256 R2 = 0.9976
Conversion (%)
Retention Time (s)
0 500 1000 1500 2000
0.0 0.2 0.4 0.6 0.8 1.0
2.0 ppmv
0.5 ppmv
Removal (umol)
Intensity (uW/cm2)
6 7
0.00 0.05 0.10 0.15 0.20
0 5 10 15 20 25 30 35 40
Conversion (%)
O2 Fraction (%)
0 10 20 30 40 50 60
0 20 40 60 80 100
2.0ppmv 0.5ppmv
Conversion (%)
Relative Humidity (%)
8 9
2.8
9 0.5 2.0ppmv
0.5ppmv 0% 69% 3.5±1%
100% 11.5±1%
2.0ppmv 0% 37%
7.8±1% 93% 93%
VOC
0.5ppmv 2.0ppmv 0.5ppmv
2.0ppmv 0.5ppmv
3.5±1% 7.8±1%
( )
Langmuir-Hinshelwood model (L-H model)
) KC A kKC A n ( A I
r = +
1
r A (molL -1 sec -1 ) k L-H model
(m 2 ppmvW -1 sec -1 ) K (ppmv -1 ) C A (ppmv) I
UVA UVC (Wm -2 ) n
(PFR) (1)
(2)
7
(3)
R A Z
C A C A
r r C A r r AB r Z D
C A r r
C A v r t
C +
∂ + ∂
∂ + ∂
∂
∂
∂
= ∂
∂ + ∂
∂ + ∂
∂
∂
2 2 2 2 2 1 1
A 1
θ θ υ
(1) (2) PFR
V r =0 V
θ=0 V z =V/ (3)Z
PFR
∫
−
=
= Cout
Cin r A dC A υ
τ V 0
(s) V (m 3 ) 0
(m 3 s -1 ) C out (ppmv) C in (ppmv) PFR L-H
model
K
n kKτ I in ) out C K(C ) C in C out
( + − = −
⇒ ln
( ) 3.1
10
7×10 -7 7×10 -12 M 7
×10 -8 M
7×10 -7 M
3.2
300% 200% 100% 50% 0% 25% 25%
25%
25% 25%
300% 0
0% 25% 50% 100% 200% 300%
0.0 0.1 0.2 0.3 0.4 0.5 0.6 0.7
Conversion
Content 0 7E-7M 7E-8M 7E-9M 7E-10M 7E-11M 7E-12M
0.00 0.05 0.10 0.15 0.20 0.25 0.30 0.35 0.40 0.45 0.50 0.55 0.60 0.65 0.70 0.75
Conversion
Ag Concentration
10 11
( )
4.1 FTIR
FTIR FTIR Gas-cell
IR
FTIR
12
1000cm -1 1200~980 cm -1 P-O
980~1000cm -1
FTIR
9
4.2 FTIR
IR
13
( )
1400cm -1
1600cm -1 1400~1450cm -1
1600cm -1 1400~1450cm -1 1600cm -1
1600 cm -1 ST01
1623 cm -1 3700~2800 cm -1 ( -OH )
1623cm -1 ( -OH )
1400cm -1 523K
FTIR 1400cm -1
1450cm -1
(P 2 O 5 ) (H 3 PO 4 )
IC
96.7372 103.381
98 100 102
997.907 995 990 985 981.21
%T
W avenumber [cm-1]
Pure phosphine
Pre-test
Photodegradation for 3hr and off light
Dark adsorption Pure air
1000 1500 2000 2500 3000 3500
40 60 80 100 120 140
Pure TiO
2
H3PO
4
After washed
Photodegradation
Transmittance (%)
Wavelength (cm-1)
12 FTIR 13 FTIR
4.3 (ICP-AES)
ICP-AES 14 15 5.0
10.0ppmv ICP-AES FTIR
5.0ppmv FTIR 17.60µmol ICP-AES
10.95µmol 10.0ppmv FTIR 19.96µmol
ICP-AES 17.43µmol
ICP-AES
FTIR
IC ICP-AES IC
FTIR ICP-AES
FTIR FTIR
4 6 8 10 12 14 16 18 20 22
0 2 4 6 8 10 12 14 16
18 y = 1.059x - 4.528 R2 = 0.991
P Content (umol)
FTIR Removal (umol)
2 4 6 8 10 12 14 16 18
0 2 4 6 8 10 12
y = 0.737x - 2.428 R2 = 0.973
P Content (umol)
FTIR Removal (umol)
14 5ppm 15 10ppm
L-H model 1.453 ppmv -1
UVA
0.5ppm 0.409 3.78 ×
10 -2 (m 2 ppmvW -1 sec -1 ) 2.0ppmv 0.689
2.00×10 -2 (m 2 ppmvW -1 sec -1 )
7×10 -8 M
25%
FTIR XPS
IC ICP-AES FTIR
FTIR XPS
ICP-AES ICP-AES
FTIR ICP-AES
FTIR
2010
NSC 99 2221 E 011 082
100 10 30 11 04
101 08
2010
Effect of Au content and TiO 2 size for Au/TiO 2 composite on surface plasmon resonance and photocatalytic activity under UV/Visible illumination
/
/ NO x
Nanoscience & Nanotechnology
2010 5 th Asian Conference on Nanoscience & Nanotechnology
RIKEN Advanced Science Institute
Miraikan (National Museum of Emerging Science and Innovation)(
)
Nov 01 – Nov 03, 2010
2
-2010 2010
11 01 2010 11 03
RIKEN Advanced Science Institute 1
2010 1
234
65
1.Nanomaterials: novel chemical and physical characteristics of nanostructures. nanoparticles, nanowires, nanotubes, functionalized polymers, etc.
2.Nanofabrication: recent progress of fabrication and measurements.
nanoimprinting, microcontact printing, nanolithography, interfacial reactions, etc.
3.Application of nanostructures: various new applications including energy and environmental ones.nanoelectronic devices, OTFTs, OLEDs, nanophotonics
4.Nanocharacterization: single molecular detection, nanodynamic spectroscopy, nonlinear dynamics,nanofluidics
5. Self-organizing systems: SAMs LB films, layer-by-layer deposition,
etc.
6.Fusion Nano: bio-inspired or bio-oriented nanotechnology and nanostructures, and those combined with information technology.
7.Post Nano: next generation processes and applications beyond nano.
6 3
Tuesday, Nov. 01, 2010
17:30 –Nanomaterials, Oral Session, Section 1C
Yao-Hsuan Tseng*, I-Guo Chang," Effect of Au content and TiO2
size for Au/TiO2 composite on surface plasmon resonance and
photocatalytic activity under UV/Visible illumination"
4
6
IACSIT Senior Member
SCI ” Journal of Nanoscience and Nanotechnology ”
(NSC99 2221 E 011 082)
2010
8
Manuscript Title: Effect of surface plasmon resonance on the photocatalytic activity of Au/TiO2 under UV/Visible illumination
Manuscript Number: JNNRK_076A (P019)
Author(s): Yao-Hsuan Tseng, I-Guo Chang, Yian Tai, and Kung-Wei Wu Manuscript Type: Article
Receiving Date: November 25th, 2010 Accepting Date: January 23rd, 2011
Dear Prof. Yao-Hsuan Tseng
I am pleased to inform you that your paper has been accepted for publication in Journal of Nanoscience and Nanotechnology, special issue, AsiaNano 2010.
(1) Kindly insert Date of Submission, Date of Acceptance, and Email address on the FIRST page of your manuscript.
(2) Please send your manuscript including (i) One hardcopy, (ii) CD with manuscript in Word Format, and (iii) a signed "Copyright Transfer Agreement" (please print from
www.aspbs.com/jnn) by courier/registered mail to the Editorial Office for the Special Issue at:
Katsuhiko ARIGA, Dr.
World Premier International (WPI) Research Center for Materials Nanoarchitectonics (MANA) National Institute for Materials Science
1-1 Namiki, Tsukuba, Ibaraki 305-0044, Japan
Phone: +81-29-860-4597 +81-29-860-4597 Fax: +81-29-860-4832
E-mail: [email protected]
Thank you very much for publishing your research work in JNN.
With my best regards,
Sincerely yours,
Katsuhiko ARIGA, Ph.D.
Issue Editor
Journal of Nanoscience and Nanotechnology, special issue, AsiaNano 2010
Effect of surface plasmon resonance on the photocatalytic activity of Au/TiO 2 under UV/Visible illumination
Yao-Hsuan Tseng
*, I-Guo Chang, Yian Tai, and Kung-Wei Wu
Affiliation:
Department of Chemical Engineering, National Taiwan University of Science and Technology, Taiwan
Mailing Address: Department of Chemical Engineering, National Taiwan University of Science and Technology, #43, Sec.4, Keelung Rd., Taipei, 106, Taiwan, R.O.C Phone: +886-2-27376765
Fax: +886-2-27376644
E-mail: [email protected]
Received 01 November 2010; accepted 23 January 2011
論文全文
10
Abstract
In this study, gold-loaded titanium dioxide was prepared by an impregnation method to investigate the effect of surface plasmon resonance (SPR) on photoactivity. The deposited gold nanoparticles (NPs) absorb visible light because of SPR. The effects of both the gold content and the TiO 2 size of Au/TiO 2 on SPR and the photocatalytic efficiency were investigated. The morphology, crystal structure, light absorption, emission from the recombination of a photoexcited electron and hole, and the degree of aggregation were investigated using transmission electron microscopy (TEM), X-ray diffraction (XRD), UV-visible-diffuse reflectance spectra (UV-VIS-DRS), photoluminescence (PL) spectroscopy, and turbidimetry, respectively. Photocatalytic activity was evaluated by the decolorization of methyl orange solution over modified titania under UV and UV/GLED (green light emitting diode) illumination. Au/TiO 2 NPs exhibited an absorption peak (530-570 nm) because of SPR. The results of our photocatalytic experiments indicated that the UV-inducedly photocatalytic reaction rate was improved by simultaneously using UV and green light illumination; this corresponds to the adsorption region of SPR. Au/TiO 2 could use the enhanced electric field amplitude on the surface of the Au particle in the spectral vicinity of its plasmon resonance and thus improve the photoactivity. Experimental results show that the synergistic effect between UV and green light for the improvement of photoactivity increases with increasing the SPR absorption, which in turn is affected by the Au content and TiO 2 size.
Keyword: Au/TiO 2 , surface plasma resonance, photocatalytic efficiency, UV/visible
illumination.
1. INTRODUCTION
Since the discovery of the photoelectrochemical splitting of water using titanium dioxide electrodes 1 , semiconductor-based photocatalysis has been extensively
invetigated. Titanium dioxide (TiO 2 ) is currently the most studied photocatalyst owing to its strong redox ability and numerous practical applications, e.g., air purification, water treatment, deodorization, as a self-cleaning materials, and as an antibacterial coating 1-4 . With regard to environmental applications, TiO 2 exhibits photocatalytic activity in the mineralization of nitrogen oxide (NO x ), sulfur oxide (SO x ), and volatile organic compounds (VOCs) under solar irradiation. TiO 2 absorbs photons and
generates highly active oxygen species, such as OH radicals and O 2 - ions through reactions with H 2 O and O 2 adsorbed on its surface; the high oxidation potential of such reactive oxygen species is responsible for the decomposition of many pollutants 3 . With an energy gap of 3.2 eV, the TiO 2 photocatalyst can be activated by a light
source with a wavelength of less than 388 nm. However, the use of TiO 2
photocatalysts in the photocatalytic oxidation of various pollutants is uncommon, owing to its low photodegradation efficiency 5 . The photocatalytic efficiency of TiO 2 powder depends heavily on its microstructure and physical properties, which in turn are determined by the preparation conditions 6 . Several attempts have been made to increase the photodegradation efficiency of TiO 2 through either noble metal
deposition or ion doping 7-9 . For example, CdS, TaON, InVO 4 , Pt-doped, N-doped,
C-doped, and S-doped TiO 2 are applied as visible-light-responsive photocatalysts 3,4,10 .
Co-catalysts and co-adsorbents, such as Ni, Ag, Au, activated carbon, and carbon
nanotubes (CNTs) 11-15 are used for the improvement of photocatalytic acitivity under
UV illumination. However, the UV-induced photoactivity enhanced by the concurrent
irradiation of visible light has not been investigated extensively.
12
Bulk Au has long been regarded as a highly inert metal with little chemical and catalytic activity 16,17 . In recent studies, Au NPs have been shown to exhibit good catalytic reactivity when they are highly dispersed on selective metal oxides
(Au/oxides) 18,19 . In recent years, Au/oxide catalysts have emerged as one of the most popular systems in catalysis research, being widely applied to many important processes, including oxidations of CO and propene, the reduction of NO x , and photocatalytic oxidations used for environmental purification 20,21 . Numerous studies have confirmed that the catalytic properties of Au/oxide catalysts depend significantly on the size of the Au particles, the interaction between the Au and the supporting oxide, as well as the nanostructure of the active sites 19,22 .
Au and Ag NPs each show very intense surface plasmon resonance (SPR) absorption bands in the visible-light and near-UV region, respectively 23 . This is associated with a considerable enhancement of the electric near-field in the vicinity of the Au and Ag nanoparticles 24 . We hypothesized that this enhanced electric near-field could boost the excitation of electron-hole pairs in TiO 2 and increase the
photocatalytic activity. Similar ideas have been outlined in previous reports 25,26 . Awazu et al. 24 reported the photocatalytic acitivity of Ag/SiO 2 /TiO 2 composite is to be higher than that of SiO 2 /TiO 2 because of the SPR absorption band of Ag nanoparticles, particularly for the near-UV region. The effects of the shape and size of Ag on the photocatalytic activity of Ag/TiO 2 composite under UV illumination was investigated in Christopher’s work 27 . These optical nanoparticles and related composites
(M/semiconductor) are known as plasmonic photocatalysts 24 . Nevertheless, the
photoactivity of modified TiO 2 under visible-light illumination is still significantly
less than that exhibited under UV irradiation 7,10 , although pure TiO 2 displays
reasonable photoactivity under near-UV irradiation 10,24,28 . Thus, the reasons for the
enhancement of near-UV-induced activity of Ag/TiO 2 could be the SPR effect of Ag
or the retardation of the recombination of the electron-hole pair caused by Ag 24 . While the Ag NPs are a major research topic in plasmonic photocatalysis 24-26,29-31
, literatures on Au/TiO 2 as a plasmonic photocatalyst is limited 32,33 . In this study, we show that the composites of TiO 2 and optically active Au nanoparticles represent a promising alternative to conventional photocatalysts. The UV-responsive activity of Au/TiO 2 was enhanced significantly when it was irradiated by visible light. Our work shows that this enhanced photoactivity is a result of the efficient creation of resonant Au surface plasmons in response to the visible photo flux. Controlling the content of Au particles and size of TiO 2 allows control of the SPR properties of Au/TiO 2 composites, making it possible to tailor a particular nanocomposite to maximize its photoactivity under UV/visible illuminations. This synergistic effect between UV and visible light for the improvement of the photoactivity of Au/TiO 2 is due to the SPR-absorption of the Au particles.
2. EXPERIMENTAL SECTION
2.1. Materials and Syntheses
Preparation of TiO
2particles. Nanocrystalline TiO 2 samples were prepared in a
sol-gel process by using tetraisopropyl orthotitanate and nitric acid as a precursor and
a catalyst, respectively, followed by thermal treatment. Tetrapropyl orthotitanate was
first dissolved in 50 mL of anhydrate ethanol and then added dropwise to a solution of
nitric acid. The resulting mixture was then stirred for 3 h. The liquid contents were
drawn out by using a vacuum evaporator, and the residual powder was further dried at
110 °C. The collected powder was calcined at a controlled temperature for 3 h, and
then ground to fineness. TiO 2 particles with anatase crystal sizes of 11, 21, and 31 nm,
14
determined from XRD patterns using the Scherrer formula, were obtained by heating at 573, 673, and 773 K, respectively.
Preparation of Au colloidal suspension. Gold nanoparticles (0.3 mM) in water were synthesized using the Turkevich method 34 . In order to phase transfer the particles into ethanol, they were first functionalized by the addition of mercaptoundecanoic acid at pH7. The mercaptan was allowed to adsorb for over half an hour, then the pH was lowered to pH3 with 0.5N HCl. The particles were allowed to sediment overnight and then centrifuged and washed to remove all unreacted salts and spectator ions. Finally, the black precipitate was repeptized into 10 mL of water. All solutions used were freshly prepared and kept stirring in a closed vessel until used.
Preparation of Au/TiO
2composites. Variant Au/TiO 2 particles were prepared by adding differing amounts and sizes of TiO 2 particles into an Au colloidal suspension.
The resulting mixture was then stirred for 30 min and then heated at 473 K for 3 h.
Two experimental groups of Au/TiO 2 particles were designed for the purpose of comparison. The [Au]/[TiO 2 ] ratios (TiO 2 crystal size = 11 nm) were controlled at 0, 0.1, 0.3, and 0.5% for the first group (all concentrations are based on molecular concentrations). In the second group, three types of 0.5% Au/TiO 2 samples with different TiO 2 diameter (11, 21, and 31 nm) were prepared. Sample nomenclature is defined as follows: x% Au/d-TiO 2 , where x% and d are the content of Au and crystal size (nm) of TiO 2 , respectively.
2.2. Photocatalytic activity.
Methyl orange (MO, C 14 H 14 N 3 NaO 3 S) was used to investigate the photocatalytic activity of the Au/TiO 2 samples. The photocatalyst (0.1 g) was
dispersed in methyl orange aqueous solution (10 ppm) by means of ultrasonic waves
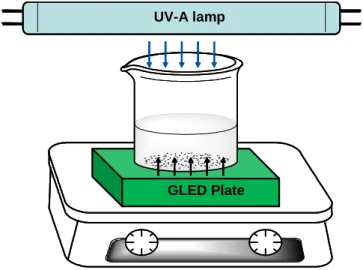
for 20 min. A Pyrex photo-reactor was used in the experiments as shown in Figure 1.
The suspension was then stirred and samples were drawn at intervals. The reaction temperature was 25 o C controlled by a water bath. After stirring at 300 rpm for 30 min in dark, the adsorption equilibrium was reached, and the selected light sources turned on and samples drawn at intervals for analysis, measuring the concentration of methyl orange. The light sources were provided using a green LED and black lamp, with intensities of 1.2 and 1.7 mW/cm 2 on the surface of reaction solution, respectively. As shown in Figure 2, the spectra of the light sources were measured using a
spectrophotometer (Ocean Optics USB2000), on the basis of which the intensity could be calculated. The absorbance of the methylene orange solution at 465 nm was
measured using a UV/VIS spectrometer (Metertech SP-880) to determine the residual concentration. No detectable degradation of the dyes was observed in the absence of catalyst or from irradiation with light alone. The photocatalytic decolorization reaction follows a pseudo-first order rate law, which is consistent with published literatures 24,27,35,36
. The reaction rate law can be expressed as ln (1–X) = –k t, where k and X are the reaction rate constant and conversion of methyl orange, respectively.
The suffix to k, UV or UV/vis, indicates the illumination type used in the reaction.
2.3. Characterization
The photoactalyst crystal phase was identified using X-ray diffractometry with Cu Kα (λ = 0.154 nm) radiation (Shimadzu Rigaku D/Max RCXRD 6000). Average
particle size and morphology was obtained by transmission electron microscopy
(TEM, Hitachi S600-100KV). A diffuse-reflectance scanning spectrophotometer
(Shimadzu, UV-2450) was employed to obtain the UV-visible absorption spectra of
the powders. The reflectance data were converted to the absorbance values, F(R),
based on the Kubelka-Munk theory. The photoluminescence spectroscopy (PL) data
16
were obtained on a luminescence spectrometer (Jasco FP-6500LE) under excitation with 325 nm irradiation. The degree of dispersion for photocatalyst particles in the aqueous solution was measured by a turbidimeter (Hach 2100P).
3. RESULTS AND DISCUSSION
3.1. Characterization of Au/TiO
2Figure 3 shows the X-ray diffraction patterns of the Au/TiO 2 samples. The peaks for 2 θ = 38.2 o , 44.4 o , 65.6 o , and 77.6 o reflections characteristic of Au were not
observed for these samples because of its low content. Only the anatase phase of TiO 2 , with characteristic peaks at 25.3 o (101), 37.8 o (004), 40.0 o (200), 53.9 o (105), 55.1 o (211), and 62.7 o (204), was observed for all the samples. The unit cell of anatase TiO 2 is a body-centered tetragonal structure with space group I41/amd (141). The
crystallite sizes of the prepared photocatalysts were determined from the full width at half maximum (FWHM) of the (101) peak using the Scherrer formula (d = 0.9
λ/βcosθ). The peak intensity of the anatase phase increased reasonably with the
calcination temperature in the preparation of TiO 2 particle. The impregnation step
used for the preparation of Au/TiO 2 did not have a significant effect on the TiO 2
crystal size because of mild calcination. The morphology of the Au/TiO 2 samples as
captured by HR-TEM, is shown in Figure 4. The deposited Au NPs measuring
approximately 14–17 nm were uniformly dispersed on the TiO 2 surface. The size of
TiO 2 seen in the TEM images is larger than the crystallite dimensions determined
from XRD patterns, as a result of the aggregation of TiO 2 particles during the
impregnation and heating procedures. The stability of Au/TiO 2 was confirmed by
checking their TEM images after the photocatalytic decolorization reaction. Au
particles did not dissociate from the TiO 2 surfaces after reaction. The optical
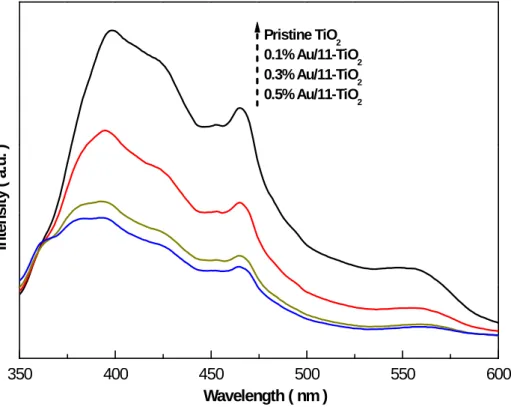
absorption spectra of Au/TiO 2 NPs exhibit a strong absorption in the visible region, as shown in Figure 5. The plasmon absorption band of the Au colloidal suspension is around 512 nm (not shown here). The plasmon absorption band of Au/TiO 2 particles was significantly red-shifted. As shown earlier 25 , the high dielectric constant of the TiO 2 causes a red shift in the plasmon absorption of the Au and Ag particles. The peak shift is caused by the refractive index of the surrounding medium. According to the Mie theory 37 , the SPR peak position λ is related to the refractive index n of the surrounding medium by the following equation (1).
λ 2 = λ p 2 (ε
∞+ 2n 2 ) (1)
where λ p is the bulk plasma wavelength and ε
∞is the high frequency dielectric
constant due to interband and core transitions. The effect of Au particle concentration on SPR is shown in Figure 5(a). The plasmon peak position (536nm) does not change with the Au content of Au/TiO 2 because of the low gold volume fraction 34 . This absorption peak is very close to the photon energy distribution profiles of GLED (peaked at 530 nm as shown in Figure 1). The peak absorption is directly proportional to gold content, indicating that the SPR is enhanced by increasing Au content. As shown in Figure 5(b), the red-shift of the plasmon peak increases with the crystal size of TiO 2 . The peaks of plasmon absorption are at 536, 553, and 570 nm for 0.5% Au/11, 21, and 31-TiO 2 samples, respectively. Thus, the refractive index increased with
crystal size (degree of crystallization) 34 , and the SPR peak position of 0.5%
Au/31-TiO 2 is observed at a significant distance from the emission region of GLED.
3.2. Photoactivity of Au/TiO
2under different irradiation
18
3.2.1 Effect of Au content
The degradation of MO over Au/TiO 2 samples under visible illumination was not very pronounced and considerably less than that under UV illumination. This can be attributed to the absence of a suitable hole-trapper on the Au NPs, such as Cl – and Br – anions 29-31 . As a consequence, the visible-light-responsive activity was not
investigated in this study. However, the UV-induced photocatalytic activity of
Au/TiO 2 was enhanced significantly by use of the GLED. Figure 6 shows the
degradation rate constants using various Au content photocatalysts under UV and
UV/visible irradiations. Under UV illumination, the MO degradation rates for all
Au-containing TiO 2 samples showed no improvement over that for pristine TiO 2 . In
general, the noble metal gold is typically used to produce the highest Schotty barrier
among metals to facilitate electron capture 38,39 . Thus, the presence of Au on TiO 2
favors the migration of photo-produced electrons to gold, improving the electron-hole
separation. This phenomenon is evidenced in the photoluminescence (PL) intensity, as
shown in Figure 7. It can be seen that pristine TiO 2 and Au/TiO 2 particles exhibit
similar curve shapes in their PL spectra, demonstrating that Au particles do not give
rise to a new PL phenomena. However, the PL intensities of Au/TiO 2 catalysts are
considerably less than that for TiO 2 . The quenching effect increases with the gold
content. If we assume that the PL emission results mainly from the recombination of
excited electrons and holes, the Au/TiO 2 sample with lower PL intensity should
exhibit better activity than pristine TiO 2 under UV irradiation. However, the
aggregation effect, leading to an increase in the secondary particle size of the
photocatalyst, is also important in determining the photocatalytic rate 35,40 . The
turbidity values of 0%, 0.1%, 0.3%, and 0.5% Au/11-TiO 2 were 250, 181, 175, and
157 NTU, respectively, indicating that aggregation of TiO 2 particles occurred during
the impregnation process of Au/TiO 2 . The lowest activity for 0.5% Au/11-TiO 2 is probably because of excess Au particles covering some active sites on the TiO 2
surface.
Figure 6 also shows how the photocatalytic activity of all Au/TiO 2 samples under UV/visible illumination is better than that for samples under only UV
illumination. The irradiation of GLED did not have a significant effect on the activity of pristine TiO 2 . This indicates a synergistic effect between UV and green light, which enhances the degradation rate of dye over Au/TiO 2 samples. This synergistic effect is improved by increasing the Au content (i.e., SPR peak intensity). The degradation rate of the dye on the 0.5% Au/11-TiO 2 with an additional illumination of GLED was 1.25 times faster than that in the absence of visible light. However, the
visible-light-responsive photocatalytic activity of these Au/TiO 2 samples is not obvious, so the enhancement of photocatalytic activity is not a result of the visible-light-excited electrons at the gold NPs being injected into TiO 2 . The electromagnetic field of the incident light couples with the oscillations of the conduction electrons in Au NPs, resulting in strong enhancement of the local
electromagnetic fields near the surface of Au NPs. Thus, it is suggested that when the wavelength of the incident light matches the SPR band of Au/TiO 2 , it acts as an additional electron magnetic field, thus increasing the generation rate of photoexcited holes and electrons at TiO 2 . This is depicted in Figure 8. Thus, the photocatalytic behavior of Au/TiO 2 is remarkably boosted as it is assisted by the enhanced electric near-field amplitudes of SPR 32,33 . The plasmonic photocatalysis under UV/visible illuminations for Au/TiO 2 is observed in this work. This composite photocatalyst can be applied practically in an indoor environment as the ordinary fluorescent tubes used indoors emit both UV and visible light 41 .
3.2.2 Effect of TiO
2size
20
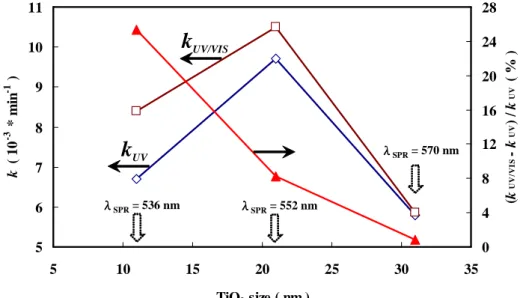
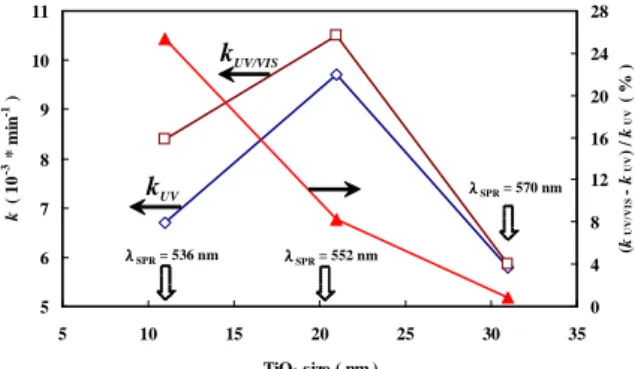
The photocatalytic activity for Au/TiO 2 samples with different TiO 2 size under UV and UV/visible illumination is shown in Figure 9. The activities of these
photocatalysts under UV irradiation were of the order: 0.5%Au/21-TiO 2 >
0.5%Au/11-TiO 2 > 0.5%Au/31-TiO 2 . The highest UV-induced photoactivity of 0.5%
Au/21-TiO 2 is a consequence of its proper crystallization. The significant decrease in specific surface area results in a low photoactivity of 0.5% Au/31-TiO 2 under UV irradiation 42 .
The plasmonic photocatalysis under UV/visible illuminations decreased with increasing TiO 2 crystal size, as shown in Figure 9. The previously mentioned
synergistic effect was not observed in the use of 0.5%Au/31-TiO 2 . The intensities of the SPR absorptions of these photocatalysts were not very different, but the red-shift of the SPR peak was enhanced as the TiO 2 crystal size increased due to the change in refractive index. The illumination of GLED peaked at 524 nm, hence its irradiation will not be absorbed by 0.5%Au/31-TiO 2 ( λ SPR = 570 nm) to result in the electric near-field amplitudes of SPR. Figure 8 also illustrates the effect of TiO 2 size on the SPR of Au/TiO 2 . The result indicates that the plasmon resonance of Au/TiO 2 and Ag/TiO 2 should be adjusted properly to be consistent with the light source for the enhancement of photoactivity 23 . Tian et al. also report that the largest incident photon to current conversion efficiency (IPCE) of Au/TiO 2 film is generated when the wavelength of incident light matches the SPR absorption region 32 . Our results of photocatalytic activity are consistent with the previous report 32 . Thus, both the proper optical metal content and semiconductor size for the plasmonic photocatalysis depend on the irradiation source and reaction conditions.
4. CONCLUSION
In the study, Au/TiO 2 is proposed as a new type of photocatalyst that uses the
enhanced electric field amplitude on the surface of Au particles in the spectral vicinity of its plasmon resonance. The UV-responsive photoactivity of Au/TiO 2 was
significantly enhanced by under illumination of GLED, which emitted
SPR-corresponding irradiation. The plasmonic photocatalysis under UV/visible illumination for Au/TiO 2 increases with the increase in Au content and SPR
adsorption. Furthermore, as the wavelength of the SPR is shifted toward the emission region of GLED with a proper refractive index of TiO 2 , the synergistic effect is enhanced. Results indicate that the absorption intensity and peak position of SPR are both important for the plasmonic photocatalytic activity of Au/TiO 2 .
Acknowledgements
The authors wish to acknowledge our two anonymous reviewers for their excellent comments. The authors would like to thank the National Science Council of Taiwan, for financial support of this research under contracts NSC-98-2218-E-011-005.
References
1. A. Fujishima and K. Honda, Nature 238, 37 (1972).
2. T. Ibusuki and K. Takeuchi, J. Mol. Catal. 88, 102 (1994).
3. M. R. Hoffmann, S. T. Martin, W. Choi, and D. W. Bahnemann, Chem. Rev. 95, 69 (1995).
4. A. Fujishima, N. R. Tata, and A. T. Donald, J. Photoch. Photobio.C 1, 1 (1995).
5. S. Horikoshi, A. Saitou, and H. Hidaka, Environ. Sci. Technol. 37, 5813
(2003).6. A. Jitianu, T. R. Benoit, S. Delpeux, F. Beguin, and S. Bonnamy, Carbon 42, 1147 (2004).
7. T. Sano, N. Negishi, K. Koike, K. Takeuchi, and S. Matsuzawa, J. Mater. Chem.
14, 380 (2004).
22
8. H. Kisch and W. Macyk, ChemPhysChem 3, 399 (2002).
9. F. Zhang, J. Chen, X. Zhang,W. Gao, R. Jin, N. Guan, and Y. Li, Langmuir 20, 9329 (2004).
10. H. W. Chen, Y. Ku, and Y. L. Kuo, Water Res 41, 2069 (2007).
11. Z. Y. Juang, I. P. Chien, J. F. Lai, and C. H. Tsai, Diamond Relat. Mater. 13, 1203 (2004).
12. J. Liu, S. Webster, and D. L. Carroll, J. Phys. Chem. B 109, 15769 (2005).
13. H.Yu , X.J. Li , S.J. Zheng, and W. Xu, Mater. Chem. Phys 97, 59 (2006).
14. H. Tada, T. Ishida, A. Takao, and S. Ito, Langmuir 20, 7898 (2004).
15. M. Jakob, H. Levanon, and P. V. Kamat, Nano Lett 3, 353 (2003).
16. B. Hammer and J. K. Norskov, Nature 376, 238 (1995).
17. B. Tian, J. Zhang., T. Tong, F. Chen, Appl. Catal. B 79, 394 (2008).
18. M. Valden, X. Lai, and D. W. Goodman, Science 281, 1647 (1998).
19. M. Haruta and M. Date´, Appl. Catal. A 222, 427 (2001).
20. G. C. Bond and D. T. Thompson, Gold Bull. 33, 41 (2000).
21. J. A. Rodriguez, G. Liu, T. Jirsak, J. Hrbek, Z. P. Chang, J. Dvorak, and A.
Maiti, J. Am. Chem. Soc. 124, 5242 (2002).
22. M. Haruta, N. Yamada, T. Kobayashi, and S. Iijima, J. Catal. 115, 30 (1989).
23. M. J. Kerker, Colloid Interface Sci. 105, 297 (1985).
24. K. Awazu, M. Fujimaki, C. Rockstuhl, J. Tominaga, H. Murakami, Y. Ohki, N.
Yoshida, and T. Watanabe, J. Am. Chem. Soc. 130, 1676 (2008).
25. T. Hirakawa and P. V. Kamat, Langmuir 20, 5645 (2004).
26. T. Hirakawa and P. V. Kamat, J. Am. Chem. Soc. 127, 3928 (2005).
27. P. Christopher, D. B. Ingram, and S. Linic, J. Phys. Chem. C 114, 9173 (2010).
28.Y. H. Tseng, J. H. Huang, Y. M. Lin, C. C. Chen, B. W. Chou, C. L. Cheng, and M.
S. Wong, Nanotechnology 17, 2490 (2006).
29. Y. Sun, J. Phys. Chem. C 114, 2127 (2010).
30. X. Chen, Z. Zheng, X. Ke, E. Jaatinen, T. Xie, D. Wang, C. Guo, J. Zhao, and H.
Zhu, Green. Chem. 12, 414 (2010).
31. L. Kuai, B. Geng, X. Chen, Y. Zhao, and Y. Luo, Langmuir in press (2011).
32. Y. Tian and T. Tatsuma, J. Am. Chem. Soc. 127, 7632 (2005).
33. J. Chen, J. C.S. Wu, P. C. Wu, and D. P. Tsai, J. Phys. Chem. C 115, 210 (2011) 34. D. Buso, J. Pacifico, A. Martucci, and P. Mulvaney, Adv. Funct. Mater. 17, 347
(2007).
35. Y. H. Tseng, H. Y. Lin, C. S. Kuo, Y. Y. Li, and C. P. Huang, Reac. Kinet. Catal.
Lett. 89, 63 (2006).
36. Y. C. Hsiao and Y. H. Tseng, Micro Nano lett. 5, 317 (2010).
37. I. Tanahashi, H. Iwagishi, and G. Chang, Mater. Lett. 62, 2714 (2008).
38. C.Y. Wang, C.Y. Liu, and X. Zheng, Colloid Surf. A 131, 271 (1998).
39. F.B. Li and X.Z. Li, Appl. Catal. A 228, 15 (2002).
40. H. Lin, C. P. Huang, W. Li, C. Ni, S. Ismat Shah, and Y. H. Tseng, Appl. Catal. B 68, 1 (2006).
41. Y. M. Lin, Y. H. Tseng, J. H. Huang, C. C. Chao, C. C. Chen, and I. Wang, Environ. Sci. Technol. 40, 1616 (2006).
42. R. J. Tan, Y. H. Tseng, and C. H. Kuo, Micro Nano lett., 5, 361 (2010).
24
Figure Caption
Figure 1. A sketch of photo-reactor for degradation of MO.
Figure 2. UVA lamp and LED photon energy distribution profiles.
Figure 3. XRD patterns of prepared photocatalysts. A: anatase TiO 2 , G: gold Figure 4. HR-TEM images of Au/TiO 2 particles. (a) 0.5% Au/11-TiO 2 ; (b) 0.5%
Au/21-TiO 2 ; (c) 0.5% Au/31-TiO 2 .
Figure 5. UV-Visible diffuse reflectance spectra of Au/TiO 2 photocatalysts. (a) effect of Au content; (b) effect of TiO 2 size.
Figure 6. Dependence of MO removal rate of X% Au/11-TiO 2 photocatalysts on illumination source; catalyst loading: 0.1 g, intensity of UV irradiation:
1.7 mW/cm 2 , intensity of GLED irradiation: 1.2 mW/cm 2 , inlet concentration of MO: 10 ppm, reaction temperature: 25 o C.
Figure 7. Photoluminescence spectra of X% Au/11-TiO 2 photocatalysts.
Figure 8. Schematic illustration of (a) Au/11-TiO 2 (b) Au/31-TiO 2 for photocatalytic reaction by SPR effect.
Figure 9. Dependence of MO removal rate of 0.5% Au/d-TiO 2 photocatalysts on
illumination source; reaction conditions as given in Figure 5.
Figure 1.
UV-A lamp
GLED Plate UV-A lamp UV-A lamp
GLED Plate
26
Figure 2.
300 350 400 450 500 550 600 650
UV GLED
Wavelength ( nm )
Figure 3.
20 30 40 50 60 70 80
G G G G
A A A A A A A A
A
Pristine TiO2 0.1% Au/11-TiO2 0.3% Au/11-TiO2 0.5% Au/11-TiO2 0.5% Au/21-TiO2 0.5% Au/31-TiO2
2 θ
28
Figure 4.
40 nm (a)
40 nm (a)
50 nm (b) 50 nm (b)
100 nm (c) 100 nm
(c)
Figure 5.
350 400 450 500 550 600 650 700 750 800
(A)
0.5% Au/11-TiO
2
0.3% Au/11-TiO
2
0.1% Au/11-TiO
2
Pristine TiO
2F ( R )
Wavelength ( nm )
350 400 450 500 550 600 650 700 750 800
(B)
0.5% Au/31-TiO
2
0.5% Au/11-TiO
2Pristine TiO
20.5% Au/21-TiO
2
F ( R )
Wavelength ( nm )
350 400 450 500 550 600 650 700 750 800
(A)
0.5% Au/11-TiO
2
0.3% Au/11-TiO
2
0.1% Au/11-TiO
2
Pristine TiO
2F ( R )
Wavelength ( nm )
350 400 450 500 550 600 650 700 750 800
(B)
0.5% Au/31-TiO
2
0.5% Au/11-TiO
2Pristine TiO
20.5% Au/21-TiO
2
F ( R )
Wavelength ( nm )
30
Figure 6.
6 6.5 7 7.5 8 8.5 9
0 0.1 0.2 0.3 0.4 0.5
Au content ( % ) k ( 1 0
-3* m in
-1)
0 4 8 12 16 20 24 28
(k
UV/VIS- k
UV) / k
UV( % )
k
UV/VISk
UV6 6.5 7 7.5 8 8.5 9
0 0.1 0.2 0.3 0.4 0.5
Au content ( % ) k ( 1 0
-3* m in
-1)
0 4 8 12 16 20 24 28
(k
UV/VIS- k
UV) / k
UV( % )
k
UV/VISk
UVFigure 7.
350 400 450 500 550 600
In te n s it y ( a .u . )
Wavelength ( nm )
Pristine TiO
20.1% Au/11-TiO
20.3% Au/11-TiO
20.5% Au/11-TiO
232
Figure 8.
TiO 2
e
-e
-e
-h
+h
+TiO 2
Au
Visible light (524 nm)
(a)
SPR
e
-e
-e
-h
+h
+Au
Visible light (524 nm)
(b)
UV light
UV light
VBUV light
CB
CB
VB
TiO 2 TiO 2
e
-e
-e
-h
+h
+TiO 2
Au
Visible light (524 nm)
(a)
SPR
e
-e
-e
-h
+h
+Au
Visible light (524 nm)
(b)
UV light
UV light
VBUV light
CB
CB
VB
Figure 9.
5 6 7 8 9 10 11
5 10 15 20 25 30 35
TiO
2size ( nm ) k ( 1 0
-3* m in
-1)
0 4 8 12 16 20 24 28
(k
UV/VIS- k
UV) / k
UV( % )
k
UV/VISk
UVλλ
λλSPR= 536 nm λλλλSPR= 552 nm
λλ
λλSPR= 570 nm
5 6 7 8 9 10 11
5 10 15 20 25 30 35
TiO
2size ( nm ) k ( 1 0
-3* m in
-1)
0 4 8 12 16 20 24 28
(k
UV/VIS- k
UV) / k
UV( % )
k
UV/VISk
UVλλ
λλSPR= 536 nm λλλλSPR= 552 nm
λλ
λλSPR= 570 nm
34
Graphic Abstract
Effect of surface plasmon resonance on the photocatalytic activity of Au/TiO 2 under UV/Visible illumination
Yao-Hsuan TSNEG, I-Guo CHANG, Yian TAI, and Kung-Wei WU In this study, the Au/TiO 2 is proposed as a new
type of photocatalyst that uses the enhanced electric field amplitude on the surface of Au particles in the spectral vicinity of its plasmon resonance. This plasmonic photocatalysis under UV/visible illuminations for Au/TiO 2
increases with the increase in SPR adsorption, which is affected by Au content and TiO 2 size.
5 6 7 8 9 10 11
5 10 15 20 25 30 35
TiO2 size ( nm ) k ( 10-3 * min-1 )
0 4 8 12 16 20 24 28
(kUV/VIS - kUV) / kUV ( % )
k
UV/VISk
UV λλλλSPR= 536 nm λλλλSPR= 552 nm λ λ λ λSPR= 570 nm
5 6 7 8 9 10 11
5 10 15 20 25 30 35
TiO2 size ( nm ) k ( 10-3 * min-1 )
0 4 8 12 16 20 24 28
(kUV/VIS - kUV) / kUV ( % )
k
UV/VISk
UV λλλλSPR= 536 nm λλλλSPR= 552 nm λ λ λ λSPR= 570 nm
國科會補助計畫衍生研發成果推廣資料表
日期:2011/10/21
國科會補助計畫
計畫名稱: 光觸媒催化技術於磷化氫氣體降解與量測之研究 計畫主持人: 曾堯宣
計畫編號: 99-2221-E-011-082- 學門領域: 觸媒及反應工程
研發成果名稱
(中文) 光催化技術於磷化氫氣體之定量分析(英文) Quantative method for gaseous phosphine via photocatalytic technique
成果歸屬機構
國立臺灣科技大學發明人 (創作人)
曾堯宣,李澈
技術說明
(中文) 本發明藉由光觸媒氧化反應程序發展分析氣相中低濃度磷化氫濃度之技術,利用 不同光催化反應結果,可以在紫外光的激發下,將氣體狀態的磷化氫氧化為磷酸 鹽與氧化磷物種,後續可以以傅立葉紅外線光譜儀(FTIR)、離子層析儀(IC)與感 應耦合電漿發射光譜(ICP-AES)分別分析氣相中磷化氫濃度變化以及於光觸媒表 面生成之磷酸鹽與磷原子總含量,藉以建立濃度校正曲線。可以藉由光觸媒材料 表面之磷物質含量可以準確推估氣相中磷化氫濃度,此部份預計可發展出低濃度 磷化氫氣體之分析程序。
(英文) In this work, the decomposition of gas-phase phosphine under UV/TiO2 process was investigated in phosphine quantitative analysis.The phosphine quantitative analysis, gas- phase product were determined by Fourier transform infrared (FTIR) and X-ray photoelectron spectroscopy (XPS), liquid-phase product were determined by Ionic chromatography ( IC) and Inductively coupled plasma-atomic emission spectrometer (ICP-AES). These results indicate that phosphate (PO43-) and phosphorus pentoxide (P2O5) were both in liquid-phase and gas-phase respectively. There has a calibration curve between IC, ICP-AES with FTIR. This result is expected to develop a low concentration of phosphine gas analysis procedures.
產業別
研究發展服務業技術/產品應用範圍
民生化工,半導體相關分析技術技術移轉可行性及 預期效益
可技轉與半導體業主以及相關分析檢測業者,可發展為針對PH3氣體的分析技術,具有實用 的可行性
註:本項研發成果若尚未申請專利,請勿揭露可申請專利之主要內容。
99 年度專題研究計畫研究成果彙整表
計畫主持人:曾堯宣 計畫編號:99-2221-E-011-082- 計畫名稱:光觸媒催化技術於磷化氫氣體降解與量測之研究
量化
成果項目 實際已達成
數(被接受 或已發表)
預期總達成 數(含實際已
達成數)
本計畫實 際貢獻百
分比
單位
備 註 ( 質 化 說 明:如 數 個 計 畫 共 同 成 果、成 果 列 為 該 期 刊 之 封 面 故 事 ...
等)
期刊論文 0 0 100%
研究報告/技術報告 1 1 100%
研討會論文 2 2 100%
論文著作 篇
專書 0 0 100%
申請中件數 1 1 100%
專利 已獲得件數 0 0 100% 件
件數 0 0 100% 件
技術移轉
權利金 0 0 100% 千元
碩士生 2 2 100%
博士生 0 0 100%
博士後研究員 0 0 100%
國內
參與計畫人力
(本國籍)
專任助理 0 0 100%
人次
期刊論文 0 2 100%
研究報告/技術報告 0 0 100%
研討會論文 0 0 100%
論文著作 篇
專書 0 0 100% 章/本
申請中件數 0 0 100%
專利 已獲得件數 0 0 100% 件
件數 0 0 100% 件
技術移轉
權利金 0 0 100% 千元
碩士生 0 0 100%
博士生 0 0 100%
博士後研究員 0 0 100%
國外
參與計畫人力
(外國籍)
專任助理 0 0 100%
人次
其他成果 (無法以量化表達之成 果如辦理學術活動、獲 得獎項、重要國際合 作、研究成果國際影響 力及其他協助產業技 術發展之具體效益事 項等,請以文字敘述填 列。)
依據此計畫基礎學術研究成果,已衍生 2 件產學計畫
1.無塵室微量氣體離子多點自動分析系統開發計畫(SBIR 計畫) 99.6-99.9 聯 宙科技公司
2.光觸媒降解無塵室內磷化物氣體之可行性分析計畫(中小企業科技關懷計畫) 100.7-100.12 舒活健康科技公司
成果項目 量化 名稱或內容性質簡述
測驗工具(含質性與量性) 0
課程/模組 0
電腦及網路系統或工具 0
教材 0
舉辦之活動/競賽 0
研討會/工作坊 0
電子報、網站 0
科 教 處 計 畫 加 填 項
目 計畫成果推廣之參與(閱聽)人數 0
國科會補助專題研究計畫成果報告自評表
請就研究內容與原計畫相符程度、達成預期目標情況、研究成果之學術或應用價 值(簡要敘述成果所代表之意義、價值、影響或進一步發展之可能性)、是否適 合在學術期刊發表或申請專利、主要發現或其他有關價值等,作一綜合評估。
1. 請就研究內容與原計畫相符程度、達成預期目標情況作一綜合評估
■達成目標
□未達成目標(請說明,以 100 字為限)
□實驗失敗
□因故實驗中斷
□其他原因 說明:
2. 研究成果在學術期刊發表或申請專利等情形:
論文:□已發表 □未發表之文稿 ■撰寫中 □無 專利:□已獲得 ■申請中 □無
技轉:□已技轉 ■洽談中 □無 其他:(以 100 字為限)
3. 請依學術成就、技術創新、社會影響等方面,評估研究成果之學術或應用價 值(簡要敘述成果所代表之意義、價值、影響或進一步發展之可能性)(以 500 字為限)
本研究藉由光觸媒氧化反應程序發展分析氣相中低濃度磷化氫濃度之技術,利用不同光催 化反應結果,以傅立葉紅外線光譜儀(FTIR)、感應耦合電漿發射光譜(ICP-AES)分別分析 氣相中磷化氫濃度變化以及於光觸媒表面生成之磷酸鹽與磷原子總含量,藉以建立濃度校 正曲線。可以藉由光觸媒材料表面之磷物質含量以準確推估氣相中磷化氫濃度,此部份預 計可發展出低濃度磷化氫氣體之分析程序。
本發明之特點 :
(1)利用光觸媒氧化之概念將磷化氫參與反應,經由光降解反應後加以分析即可得到結 果。(2)優點為反應所需時間較短、所測得之磷化氫濃度誤差較小且光觸媒之成本較低。