行政院國家科學委員會補助專題研究計畫 ■ 成 果 報 告
□期中進度報告
探索軟物質介觀結構複雜性的起源 (3/3)
Exploring the Origin of Complexity in the Mesoscopic Structure of Soft Matters
計畫類別:■ 個別型計畫 □ 整合型計畫 計畫編號:NSC 98-2221-E-011-009-MY3-
執行期間: 2009 年 08 月 01 日至 2012 年 07 月 31 日
計畫主持人:洪 伯 達 共同主持人:
計畫參與人員:周哲民 (博士後研究)
成果報告類型(依經費核定清單規定繳交):□精簡報告 ■完整報告
本成果報告包括以下應繳交之附件:
□赴國外出差或研習心得報告一份
□赴大陸地區出差或研習心得報告一份
□出席國際學術會議心得報告及發表之論文各一份
□國際合作研究計畫國外研究報告書一份
處理方式:除產學合作研究計畫、提升產業技術及人才培育研究計畫、列管計 畫及下列情形者外,得立即公開查詢
□涉及專利或其他智慧財產權,□一年□二年後可公開查詢
執行單位:國立臺灣科技大學材料科學與工程系
中文摘要
軟物質 (soft matter) 或稱軟凝聚態物質 (soft condensed matter) 是指處於固體和理 想流體之間的物質,其通常是由多種不同的分子所組成的複雜系統,而這類的系統早先 也稱之為複雜流體 (complex fluid)。由於軟物質結構的複雜性存在於介觀尺度之上,因 此如何抽出軟物質在遠離平衡態下結構形成的共性與普適特徵是一個相當棘手且具挑 戰性的議題。然而,現今大多數的研究仍利用形態學的判斷依據去想像上的思考軟物質 在介觀尺度上結構的形成過程。但幸運的是,事情通常並非從一開始就那麼複雜。
在 高 分 子 熱 可 逆 凝 膠 化 中 , 微 纖 狀 網 目 (
fibrillar networks
) 與 球 石 組 裝(
spherulite assemblies
) 是最常被觀察的結構。本研究發現,微纖狀網目的形成涉及我們稱之為「相干結構 (
coherent structure
)」的時空演化—由漲落不穩定性所誘發的非侷域 (
non-localized
) 微纖成核,同時其成長又與協同粗化 (coarsening
) 的濃度波耦合在 一起。這樣的形態發生 (morphogenesis),可以看成是高分子溶液中,失穩結晶化 (spinodal crystallization) 的直接結果。我們的研究駁斥了「凝膠化只不過是一個逾滲問 題」的一般看法,並提出了熵驅動結晶化假說。另一方面,我們也發現微纖狀網目與球 石 組 裝 這 兩 種 形 態 發 生 , 事 實 上 反 應 了 高 分 子 結 晶 化 在 動 力 學 上 不 穩 定 性/失穩 (instability/spinodal
) 與亞穩定性/成核 (metastability/nucleation
) 的區別。並進一步證 明,這兩種結構存在形態發生上的轉變。令人訝異這樣的轉變,表現出失穩奇異性 (spinodal singularity
),暗示平均場似的介觀相轉變 (mean-field-like “mesoscopic”
phase transition
)。關鍵詞:軟物質;物理凝膠;結晶化;自組織過程;介觀結構;小角光散射
Abstract
Extracting the common and universal aspects of the structural formation of soft matters far from equilibrium is a rather difficult and challenging task. Thus, most studies have up to now employed “morphological criteria” to―imaginatively―think the structural formation process of soft matters on mesoscopic length-scale. However, fortunately things are not usually that complicated right from the start.
Fibrillar networks and spherulite assemblies are two most frequently observed textures in weak gelation of crystallizable linear polymers. We find that the gelation has to do with the spatiotemporal evolution of the so-called “coherent structure”—the non-localized, fibril nucleation via the fluctuation instability and fibril growth coupled with a cooperatively coarsening concentration wave—and is a direct consequence of the spinodal crystallization far from equilibrium in the solution. The present result rejects the common opinion that the gelation is nothing more than the percolation problems and poses an interesting question about the entropy-driven crystallization. On the other hand, we also find the fibrillar networks and the spherulite assemblies textures in response to the kinetic distinction between instability/spinodal and metastability/nucleation of the polymer crystallization and prove the morphogenetic transition in between. Moreover, it comes as a surprise when such a transition exhibits a spinodal singularity that reveals a mean-field-like “mesoscopic” phase transition behavior.
Keywords: Soft matters; Physical gels; Crystallization; Self-assembling process; mesoscopic
structure; Small-angle light scattering
Contents
中文摘要... I Abstract ...II Contents... III
1. Introduction... 1
1.1. Polymer Gels with Fibrillar Network ... 2
1.2. Morphogenetic Transition in Polymer Gelation ... 3
2. Experimental Methods... 5
2.1. Materials ... 5
2.2. Time-Resolved
d-SALS... 5
2.3. Scanning Electron Microscopy... 5
2.4. Time-Resolved FT-IR ... 6
3. Results and Discussion ... 7
3.1. Spatiotemporal Evolution in Morphogenesis of Fibrillar Network ... 7
3.1.1. Scattering Modeling of Fibrillar Network ... 7
3.1.2. Morphogenesis of Self-Organizing Network...11
3.1.3. Comparison with the Previous Opinion... 14
3.1.4. When Does the Coherent Structure Occur?... 14
3.1.5. Hypothesis of entropy-driven crystallization... 15
3.2. Morphogenetic Transition in Polymer Weak Gelation ... 18
3.2.1. Experimental Evidence for Morphogenetic Transition... 18
3.2.2. Scattering Modeling of the Morphogenetic Transition... 20
4. Conclusions... 24
4.1. The origin of the coherency ... 24
4.2. Implication and interpretation of spinodal crystallization ... 24
4.3. New Position of FringedMicelle Model ... 26
Appendix ... 28
A.1 Scattering from Fibrillar Network ... 28
A.2 Depolarized Scattering from Birefringent Sphere ... 29
A.3 Scaled Form Factor of Birefringent Sphere... 29
Reference... 31
1. Introduction
Thermoreversible polymer gels are often considered to be a network fo
rmed through physical association of long-chain molecules.
1-5Further, one can mak
e the jump from the junction structure to the network properties, because no characteristic mesostructure is a consequence of the self-similarity of the network. Hence, The percolation model presents a"physically correct" picture for an understanding of the polymer gelation.1,2 The basic idea is to approach the formation of a topologically disordered network from the viewpoint of a randomly assigned two-state property (connected or disconnected between the neighboring polymer chain segments).6 This view explains why, except the rheology,7 the experiments8,9 over recent decades always remain on the microstructure in terms of the classification proposed by Flory10 and de Gennes.11
However, the vast observation of diverse, hierarchical gel morphologies, especially the gelation induced by a thermal driven phase transition, definitely contradict this.7,8,12-17 Recent researches on the colloid gels18 and the low-molecular gelators19-21 have suggested that as an experimental fact, the self-organization/assembly seems to be a reasonably realistic description.
Interestingly, some experimentalists have presumed somewhat similar mechanism in polymer systems in spite of no enough evidence.22 While all seem to question the universality of the percolation theory, there should not be any ambiguity in the answer. For variety gel systems, many theorists go a long way to give an exact description of their universality class in phase transitions.4,23,24 The idea behind the percolation theory has a very intrinsic problem. Namely, the gelation as a critical phenomenon, the theory expects a well-defined sol-gel “phase”
boundary in the equilibrium phase diagram.25,26 On the other hand, a new problem upraises: if the thermoreversible polymer gels are taken out from the percolation universality class, where will they belong? Hence, we contend that a more precise experiment, based on tracing the morphogenesis, is needed to identify the most important factor for the polymer gelation.
As early as 1979, de Gennes has distinguished between strong gelation and weak gelation:
a gelation is termed “strong” if it occurs by the percolation way; otherwise, it is a “weak”
gelation and corresponds to the progressive freezing of degrees of freedom of the system.11 The de Gennes' prediction is borne out by Kroy et al.'s theory and Lu et al.'s experiment in colloidal gels. Kroy et al. applied the mode-coupling theory to their "cluster glass" view of the weak gelation;27 Lu et al. emphasized the spinodal decomposition to generate the clusters that span the system and dynamically arrest.18 Indeed, the fragility under external stresses of
Viewed from this direction, unlike the past concern that the polymer gelation is the cross-links of a large number of microstructures (microcrystal, helical structure, molecular compound, etc.),7,8 now should be reinterpreted as the jamming transition induced by the self-organization/assembly of them.28 However, in conventional jamming systems, the objects which allow much more precise tracing of arrested dynamics are model colloids and granular materials. One must contend with the fact that the polymer can have a huge variety of structural states at different length scales. Lack of morphogenetic detail makes it difficult to investigate the dynamic evolution on the polymer weak gelation.
1.1. Polymer Gels with Fibrillar Network
Forming a fibrillar network is a very widespread phenomenon in the polymer gels and the low-molecular gelators. It is accepted for the gelators that the fibrillar structure is due to the crystalline fibril branching20,21 and may be depicted by the solidification.29 Naturally, this seems logical for polymer, because the crystallization does occur in most polymer gels.7-9 However, a similar observation does not automatically guarantee a similar origin and process. The solidification has no thought for the entanglement complexity of polymers, not to mention the fact that the mechanism does not by itself expect—how does the topological connectivity occur?
Obviously, the crux lies in how the fibril growth brings the topological connectivity on the mesoscale.
There are two mechanisms for the thermoreversible gelation with fibril structure. One is the bond percolation by fibril junctions (a typical phase transformation in polymer solutions);
another is the self-organization/assembly by fibril aggregation/evolution (an non-equilibrium phenomenon). However, the experiments based upon equilibrium thermodynamics are not possible to tell which one is most nearly in agreement with the fact. Thus, we proposed a judgment. If the gelation is characterized by the fibril nucleation covering over the entire transient network instantaneously (i.e., the bonding probability depends only on the nucleation kinetics), it is a percolation process; if not, it relies on when and how do the molecular topological entanglement pin the self-organizing/ assembling processes. Tracing the evolving fibrils by the depolarized small-angle light scattering (d-SALS) technique can provide an access to model the system in questions.17 In this report, we use a qualitatively reliable full-scattering-pattern analysis to perform a systematic stepwise survey of the gelation process.14,15 By reconstructing the whole process, the present work would not only answer how the fibrils self-organize into the network but also clarify what the nature of the morphogenesis in that process is.
1.2. Morphogenetic Transition in Polymer Gelation
In the thermoreversible gelation of crystallizable linear polymers, the two most frequently observed textures are fibrillar networks and spherulite assemblies, corresponding to the manner in which the packing of polymer chains was achieved in the crystallization, i.e., the fringed-micelle crystal (inter-chain packing) and the chain-folded lamellar crystal (intra-chain packing), respectively. Generally, expanding a polymer chain to increase the crystallization possible with other chains seems to be a most efficient way to gelation. However, from the crystallographic point of view, the direct inter-chain packing has been believed to forbid on kinetic grounds, and the metastability of a fringed-micelle crystal becomes an academic matter.30
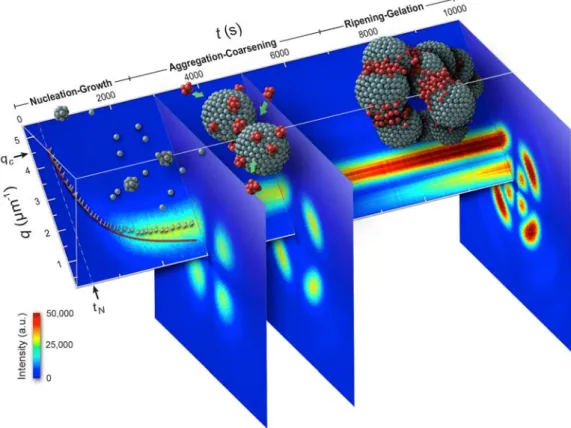
Figure 1 Image plot of time-resolved depolarized scattering profiles at azimuthal angle φ = 45° for C = 7 gdL
−1solution after the temperature jump from 433 to 293 K. The three scattering patterns show the representatives in nucleation-growth (typical four-leaf-clover characterization), aggregation-coarsening (the four-crescent- moon shape), and ripening-gelation stage, respectively.
14In the first part of the report, we would identify the instability of the fringed-micelle formation (a process called "coherent evolution"—the nonlocalized, fibril nucleation via the fluctuation instability and fibril growth coupled with a cooperatively coarsening concentration wave); at this point, we further speculated that the fibrillar networks might represent the
“observable” spinodal crystallization of polymers.13 In contrast to the fibrillar networks, since the polymer chain folds into a crystalline grain, the self-assembling mechanism provides the only available means to form a “network” without the topological entanglement. By using the time-resolved depolarized small-angle light scattering (d-SALS) with the scattering modeling approach, the cartoon in Figure 1 vividly portrays the process, in which the crystalline grains self-assemble into compact spherical clusters (spherulites) and further pack these clusters into a jammed solid.14-18
Obviously, the above argument shows that the two textures effectively means a striking manifestation of the kinetics at the beginning. In this report, we also consider whether a morphogenetic transition may occur, if the morphogenetic differentiation results from the kinetic distinction between instability and metastability. We start with the spherulite assemblies, which we have made clear during these years and named “nucleation gel” according to its kinetics, 14-18 and focus our attention to what may happen in the early stage. All results offer valuable insights into the theoretical treatment and dynamic experiments of polymer weak gelation in the future.
2. Experimental Methods
2.1. Materials
The fibrillar network was prepared by syndiotactic polystyrene (s-PS) (syndiotactic content of over 99.9%, Mw=2×10⁵, Mw/Mn=2.8, Idemitsu Petroleum Co. Ltd.) dissolved in
o-xylene, and then by quenching the homogeneous solution ( C
=0.5 gdL−1) from 408 K to the gelation temperature 323 K.The spherulite assemblies was prepared by poly(vinylidene fluoride) (PVDF) (
M
w= 2.75×10⁵ andM
wM = 2.75, Aldrich Chemical Co.) dissolved in a mixture of tetra
n (ethylene glycol) dimethyl ether (TG) and LiCF3SO3 salt. The salt was added to give an O:Li ratio (oxygen atoms in TG: lithium atoms in the salt) of 12:1. The gels were prepared by quenching homogeneous solution (C = 7 gdL-1) from 433 K to the gelation temperatures.2.2. Time-Resolved d -SALS
The optical arrangement of the apparatus has been described previously.16 A 5 mW polarized He-Ne laser was used as the incident source, and the polarization direction of the beam was adjusted by a half-wave plate. The beam was then spatially filtered, expanded, and shined onto the sample. The sample cell was placed on the temperature controlled stage (Linkam Scientific Co., THMS-600), and the scattered light intensity was directly imaged through the Fourier lens and an analyzer onto the CCD camera (Apogee Instruments Inc., Alta U2000 CCD camera). The digitized images were transferred the real-time processing to a personal computer. In present study, the reliable data are about scattering angle θ = 0.87~21.5°, corresponding to q = 0.22~5.57 µm-1.
2.3. Scanning Electron Microscopy
The freeze-dried fibrillar network was prepared as follows: the homogeneous s-PS/o-xylene solution was quenched from 408 K to 323 K for one day to form a wet gel, and then the wet gel was placed into the freeze-drying equipment (Emitech Ltd., K775X Turbo Freeze Dryer with LN2 Fed Cold Stage) at 138 K. Under a vacuuming condition (1×10⁻⁵ mBar) for more than one day, the freeze-dried network was obtained. The morphology of the freeze-dried network was investigated by scanning electron microscopy (SEM; Hitachi S-3000N).
2.4. Time-Resolved FT-IR
The time-resolved infrared spectrum was measured at a resolution of 1 cm-1 with a Nicolet 6700 FT-IR Spectrometer (Thermo Fisher Scientific Inc.). The s-PS/o-xylene solution was enclosed in a HT-32 heated demountable cell with 0.5 mm pathlength spacer inserted between two KBr windows. The crystal form of the s-PS fibril is δ phase with a 21 helical conformation corresponding to a regular TTG+G+ sequence,31 and the conformational-sensitive band of the sequence is at 572 cm-1;31-33 so the wavenumber range scanned was set 568~ 576 cm-1 to trace the band.
3. Results and Discussion
3.1. Spatiotemporal Evolution in Morphogenesis of Fibrillar Network
3.1.1. Scattering Modeling of Fibrillar Network
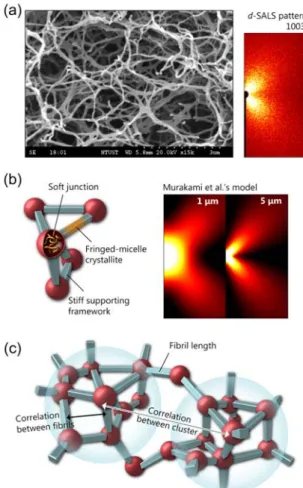
Figure 2 (a) shows the SEM micrograph and the corresponding depolarized scattering pattern of the s-PS/o-xylene gel. As shown in Figure 2 (b) left sketch, the network can be modeled as the rigid fibrillar skeleton connected by the soft entangled junction.
In the common practice of the d-SALS experiment, the structural identification of the scatterers is accomplished by comparison with theoretical form scattering, like Murakami et al.' anisotropic rod model.
34Figure 2 (a) The SEM micrograph (left) and the representative half depolarized scattering pattern (right) of the fibrillar network, prepared by 0.5 gdL
-1s-PS/o-xylene solution at 323K. (b) Left: the sketch of the fibrillar skeleton. Right: the theoretical patterns of the crystalline fibril by Murakami et al.’s model
34for different fibril lengths (L = 1 and 5µm). The parameters used are the anisotropies of the fibril δ = 1, the polar angle of the rod axis ω
0= 0, and the refractive index of the medium m1=1.503. (c) The hierarchical structure of fibrillar network.
As shown in Figure 2(b) right, the theoretical pattern (the rod length
L = 5µm
) is similar to the experimental one, but the length estimation differs markedly from the SEM observation(ca. 1
µm
). Undoubtedly, the present pattern should be richer in structure. In early works,35 it is implicitly assumed that the structure scattering can be excluded from d-SALS. Later, we knew that the structural information does exist and can be extracted by our scattering modeling approach.14,15For the scattering from an evolving hierarchical structure, giving the explicit analytical form of the scattering pattern is rather difficult or even impossible. Instead, the scattering modeling is a compromising phenomenological approach which can lead to a better understanding of the interrelation/interaction between scatterers at different timing and hierarchy during the process. Before building a realistic model, we would like to define two terms: form factor and structure factor. The form factor is the scattering intensity for a scatterer alone and is related to the shape and scattered ability of it. The structure factor is scattering intensity for the interference of the scatterers and is referred to the spatial arrangement of them.
Besides, the form factor also describes the scatterers’ level in the hierarchical structure. If the density-density correlation functions of two structures have the convolution relationship,36,37 the sub one names as the form factor. Let us return to our main subject. Considering many crystalline fibrils create a topological connectivity and then show a highly correlated evolution.
The model needs two form factors to define the fibrils and their correlation; one more structure factor is needed to characterize the large-scale inhomogeneities of the network, as shown in
Figure 2 (c).
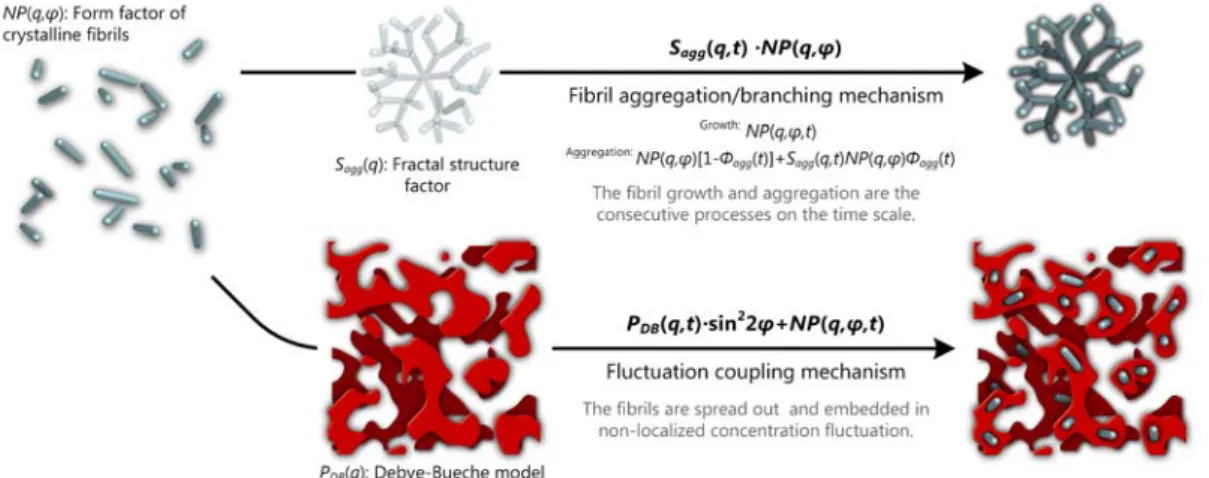
Figure 3 Scattering modeling of the fibrillar network.
Two mechanisms were considered: the fibril aggregation/branching and the fluctuation
coupling. The former is not new
21,38 and holds for the following case, as shown in Figure 3 top.First, either an aggregate or a branching object requires “an” origin,21 and the fractal characteristic should be detected and analyzed. Secondly, if the cluster is formed by the aggregation, it will be a two-stage process, i.e., the fibril growth and then aggregation. In the
present study, however, no fractal was observed, and the fibrils grew to join one another as a continuous process. Hence, a new fluctuation coupling mechanism goes as follows: the
“growing” fibrils are spread out and embedded in non-localized concentration waves posed by them. As shown in Figure 3 bottom, in addition to the fibril form factor (Murakami et al.'s model), the Debye-Bueche fluctuation model39 as another form factor provided a suitable formalism to describe the fibrils’ correlation. By its very nature, the Debye-Bueche model is often used to analyze the spatial inhomogeneity and makes no reference to the correlation between the discrete fibrils. Nevertheless, just these fibrils give rise to mesoscopically observable inhomogeneity. Given such a “mixing,” the scattered intensity should be expressed by the sum of these two terms. Further, because of a polymer chain inevitably participating in several fibrils, as the fibril growth, the topological entanglement would join the fibrils up. So we treated the structure factor as a loose assembly of such fibril clusters/domains.
The model is then given by
(
,) ( )
Rod(
,) ( )
sin 22Hv Hv DB
I q ϕ
=S q NP
⎡⎣q ϕ
+P q ϕ
⎤⎦(1)
where
I
Hv( q , ϕ )
is the depolarized scattered intensity (where q is the scattering vector, andϕ
is the azimuthal angle),S q
( ) 1= −β e
−(γξsq)2 is the structure factor of the spatial correlation between each cluster (whereξ
s is the correlation length, and β and γ are the amplitude and the range of the correlation, respectively),38N
is the number of the fibrils,(
,) (
/ 4)
2Rod
P
Hvq ϕ
=k L π δ ⎡ ⎣ p
2( cos ω
0) ⎤ ⎦
2P qL ( , ϕ )
is the form factor of the crystalline fibrilgiven by the Murakami et al.’s model [wherek
is related to the absolute intensity,L
is the fibril length, δ is the anisotropies of the fibril,ω
0is the polar angle of the fibril axis,2( )
p x is the second order Legendre function, and P qL ( , ϕ )
is the scaled form factor],34( )
4 3 2(
1 2 2)
2DB DB DB DB
P q
=π ξ K η
+q ξ
is the Debye-Bueche factor (whereK
is a constant,ξ
DBis the Debye-Bueche correlation length, andη
DB2 is the mean-square fluctuation),39 andsin 2
2 ϕ is the “optical transmission” property of the analyzer from the scattering matrix theory.40,41The model consists of eleven parameters (i.e., constant: ,
k K
,ω
0, γ and δ ;,
time-dependent parameters: ,N L
, β, ξ
s,ξ
DB , andη
DB2 ). How to better determine their values is a problem, especially in an absolute intensity fitting. However, for a semi-quantitative analysis, we setK
= and 1 δ= 1
, and combinedk
andN
to be a floating intensity coefficient in the fitting. In the Murakami et al.’s model, if the polymer in the fibril has a helical conformation, the angular dependence of the d-SALS pattern is independent ofω
;34thus we
set
ω
0= . In structure factor, 1 γ is given by 1 1γ
2σ π
= −
where
σ
is the ratio of the cluster size to their average distance (if σ= 1
, the clusters are closely packed; if σ< 1
, the clusters are close but not in contact; if σ> 1
, the clusters overlap).38 Considering the loose assembly of the clusters,σ< 1
seems to be reasonableness;thus we set σ
= 0.67
(γ= 0.42
).Figure 4 A comparison of the experimental (left half a series of quarter patterns) and the best-fitted theoretical (right half) scattering patterns.
For the remainder time-dependent parameters, formally, there may be not just one solution but a range, corresponding to “one” scattering pattern (two-dimensional, space case). The validity of the modeling is limited to the selection of these parameters, because the results may reflect in part the way in which those were selected. Nevertheless, it is possible with appropriate constraints during analysis, like refer to the real-space SEM micrograph. On the other hand,
one must not forget that we face a spatiotemporal evolution (three-dimensional case); only the physical clarity of these solutions appears to be continuous on the time scale and can thus represent a “right” answer. Figure 4 shows that the modeling results agree well with the experimental patterns—even including the background.
3.1.2. Morphogenesis of Self-Organizing Network
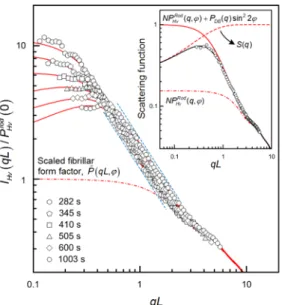
Figure 5 is plotted to test the dynamical scaling of the scattering function. The combined
form factors should fall onto a single master curve when the Debye-Bueche term just reflects the spatial correlations of the fibrils themselves. Interestingly, the scaled scattering functions were not found to be time-independent but were slightly shifted towards highqL
. The asynchronous behavior implies that the “individual” Debye-Bueche fluctuation, as a cooperatively coarsening concentration wave, was “coherent” with the growing fibrils.Figure 5 The reduced scattering functions (φ = 45°) of our fibrillar network model. The solid lines are the base-fitted theoretical scattering function, and the dash-dot line is the scaled fibrillar form factor by Murakami et al.'s model. The inset shows the behavior and interaction between three scattering factors.
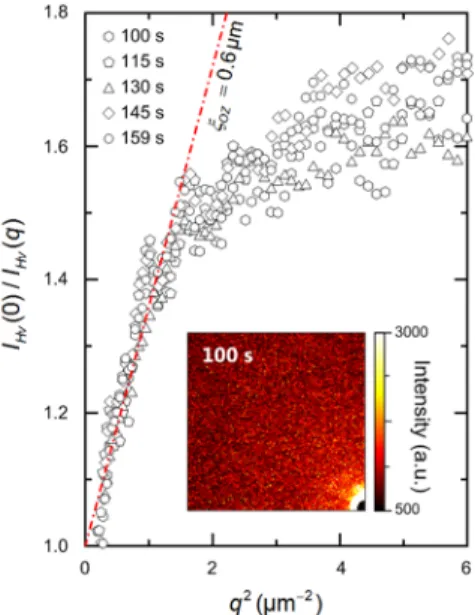
Figure 6 depicts the so-called coherent structure. On the other hand, as time goes on, the
scaled intensity decreased and developed a peak indicating the emergence of distinct fibrils and definite network from the fluctuation background. Although the gelation obviously had to do with the coherent structure evolution, how the fluctuation is coupled with the fibril growth was still unanswered. What is its origin? Assuming a thermal fluctuation in the initial homogeneous background, its wavelength, if related to the coupling, should be close toξ
DBat the fibril
nucleation. We can use the Ornstein-Zernike equationI q ( ) = I q (
=0 1) (
+q
2 2ξ
OZ)
−1to test36
the speckle pattern before the fibril nucleation. The point to observe is that the characteristic fluctuation length-scale (~0.5 µm) was also shown in other polymer gel systems.42-47 This would be considered later.
Figure 6 The schematic representation of the coherent structure.
Figure 7 The Ornstein-Zernike plot of the data for the initial background scattering and the speckle
pattern.
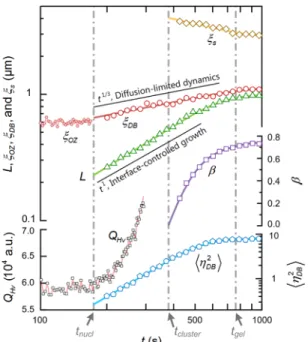
Figure 8 All scattering modeling parameters from a systematic stepwise survey of time-resolved scattering patterns.
Figure 8 shows the result of a systematic stepwise survey of the time-resolved scattering
patterns. At first glance, the process was classified into four regimes: (i) the fluctuation stage (t < t
nucl, wheret
n u cl is the nucleation time defined by the remarkable change in the scattering invariant,Q
Hv =∫
0∞I
Hv( q
,ϕ
= °45) q dq
2 ); (ii) the coherent evolution stage (t
nucl< < t t
cluster, wheret
cluster is the onset of connecting between the growing fibrils defined by β→ 0
); (iii) gelation stage (t
cluster< < t t
gel, wheret
gel is the gelation time determined experimentally by the fluidity observed); (vi) aging stage (t t >
gel). As expected,ξ
DB tended smoothly towardsξ
OZ att . This convergence implies that a triggering source as a thermal fluctuation with a band of
nucl specific wavelengths was needed to generate the polymer fibrillar network. In other words, given such the characteristic fluctuation in the initial background, the subsequent nucleation and growth of the fibrils then amplified the fluctuation so that the network emerged gradually.In the coherent evolution stage, the increase of
η
DB2 and the diffusion-limited dynamics~
1/ 3DB
t
ξ confirmed that the evolution depended on the “uphill” diffusion like the intermediate-stage spinodal decomposition.48 While, the interface-controlled growth
L ~ t
1 indicated that there was no need for long-range diffusion around the growth front of the embedded fibrils, for their dynamics became local. Ultimately, with the fibril growth the topological connectivity appeared and led to the heterogeneous network (see Figure 8, β andξ
s ). Here, we also noticed,L t t ( =
gel) ≈ ξ
OZ was interesting in that it shows—the initial fluctuation not only triggered the coherent structure but also, to large extent, predetermined the final fibrillar skeleton.3.1.3. Comparison with the Previous Opinion
From a phase transition point of view, the experimentalists attempt to answer the origin of the polymer fibrillar network.42-47 A fundamental understanding of the thermodynamics, the kinetics, and the mechanism of the gelation is therefore of great importance. However, recent studies on thermodynamic equilibrium microstructures (junctions) and morphologies (networks)7-9 and on global kinetics45-47 do not fill the gap in our knowledge on the formation mechanism. Some experiments have been carried out in order to search for the factors controlling the microstructures and morphologies.42-44 The point is that the gelation is due to the competition-cooperation between the crystallization and the phase separation in the polymer solution. Namely, the process is initiated via the spinodal decomposition and subsequent crystallization in the bi-continuous polymer-rich phase.45,46 The main evidence comes from analyzing the wide-angle light scattering (WALS) data of the early-stage concentration fluctuations in terms of Cahn’s spinodal theory.49 While there can be no doubt about the existence of the fluctuation, we divide on the relevance of the mechanism.
First, the extrapolation spinodal point determined in Cahn’s way is kinetic, but whether the thermodynamic miscibility gaps are precisely those observed in kinetic experiment is a problem.42-47 Secondly, the light scattering peak provides access to an analysis of the spinodal structure at each evolution stage—fluctuation, transition, and coarsening,50 but no observed spinodal structure may be questionable. In a number of experiments, especially those time trace observed by the WALS,42-47 the crystallization/gelation intervenes at the fluctuation stage of the spinodal decomposition, leading to a "physical pinning." Such the pinning effect retains the initial fluctuation structure (wavelength ~0.5 µm) in the final gel morphologies which coincidentally agrees with our observation in Sec. 3.1.2. Clearly, even though the early-stage fluctuation is approximately described by Cahn’s spinodal theory, its formation might be of a rather different origin. Now that our “coherent” picture could rationalize the previous observation, we might argue that the complex concept of the competition-cooperation of the multi-phase transitions are not required in order to explain the experimental data presented.
3.1.4. When Does the Coherent Structure Occur?
We may safely assume that its condition is related to
L (the critical length of the fibril
c nucleus) andξ
OZ, which give a criterion when combined with the intrinsic persistence length of the polymer,p
, asp L
< c <ξ
OZ . WhenL
cξ
OZ, the details of the fluctuation do not matter, and then the “classical” crystalline nucleus forms and grows locally. IfL
c< ξ
OZ, the nucleating fibrils seem roughly equivalent to the diffuse nucleus of Cahn and Hilliard's non-classicalnucleation theory51,52 or the wave-packet of Binder and Stauffer’s cluster-dynamics approach.53 The two “non-classical” pictures would perhaps explain why the Cahn’s spinodal theory can self-consistently describe the early-stage fluctuation observed by the previous WALS experiments. Pursuing further the cause of the coherence drives us to the problem about the spinodal crystallization in bulk polymers.54,56 The situation shows some similarity to the coherent structure formation presented here. In Ryan et al.'s SAXS experiment54 (also see in Kaji et al.55), they found a fluctuation-induced anomalous scattering at the early-stage crystallization which implies the observation of a spontaneous fluctuation process rather than a sudden nucleation event. By taking into account an additional correlation effect induced by topological entanglement of polymers, Muthukumar's kinetic model gives a reasonable overall account of Ryan et al.'s disputed data.56 In his model, the nucleation instability is embodied in the “intrinsic” properties of polymers, but the way is in fact ignoring the general metastable character of the polymer crystallization. As we see it now, the Muthukumar's model may be inappropriate or at least incomplete. In view of this, let us then consider another possibility:
whether under certain circumstances, the “extrinsic” fluctuations can be strong enough to vanish the metastability and then the spinodal crystallization can occur.
Recent studies have noted that the metastability limit can be realistic in supercooled liquids, if the system has strongly viscoelastic effects.57,58 Cavagna et al.’s viscoelastic nucleation theory57 gives a kinetic spinodal temperature which marks the relaxation time of the supercooled liquid exceeding the nucleation time of the crystal. Considering a mapping between the relaxation time and the length scale (τ ξ ), we analogize to have a criterion
~
2c OZ
L
≈ξ
in which the limit exists. We can summarize the main ideas—if the critical nucleus size corresponds to the characteristic wavelengths of the initial fluctuation, or the nucleation time takes place fairly close to the relaxation time of the polymer disentanglement, the spinodal crystallization occurs and the coherent structure is formed. At this point, our coherence criterion could be regarded as a signature of the gradual transition from the classical crystallization to the spinodal crystallization.3.1.5. Hypothesis of entropy-driven crystallization
Just like pattern-forming phenomena in dissipative systems,59,60 the gelation was via the fluctuation instability, and the initial fluctuation predetermined the final morphology. We may wonder what “small effects” felt by polymer molecules induce such a self-organizing process.
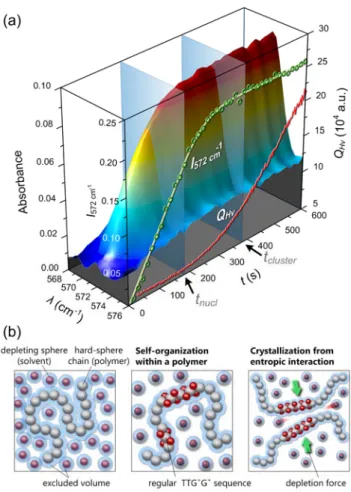
Let us draw attention to the conformational change of the s-PS during the fluctuation stage, as shown in Figure 9 (a).
Figure 9 (a) Real-time trace of the conformational-sensitive IR band of the regular TTG
+G
+sequence of the s-PS (572
cm-1) in the early stage nucleation. (b) Entropy-driven crystallization in the polymer solution. Left: The excluded volume effect leads to a crowded environment, and the maximum of the conformational entropy leads to an inaccessible region or a closed chain loop to confine the degree of translational freedom of the solvent molecules (the depleting spheres). Middle: The solvents act as “side chain” affixed to the hard-sphere chain to stabilize the self-organizing helix, thus favoring the global maximum of the system's entropy. Right: Again, the free-volume per depleting sphere is larger in the ordered (the crystal) than in the disordered (the self-organizing helix) phase.
The integrated IR intensity of the regular TTG+G+ conformation emerged immediately after quenching, increased linearly before any indication of forming observable fibrils (
t t
< nucl ), and approached only asymptotically the gelation stage. Superficially, this observation seems to agree: whereas the polymer crystal is partially built up with the intramolecular periodic structure, when a polymer molecule is possible to self-organize into the regular sequence, the next "crystallization" through intermolecular packing of these sequences must proceed in a more continuous and collective fashion as the "spinodal"process.61
However, two deep questions should be addressed. First, what does drive the self-organization within a polymer molecule? And secondly why does the solution show up as a long-lived metastable state, despite its fluctuation instability? The answers to both questions may lie in understanding how the s-PS chain behaves in the solution. Nevertheless, the
instability in the solution itself causes the experimental difficulties. To avoid the problem, the comparable atactic polystyrene (a-PS, Mw=2.116×10⁵, Mw/Mn=1.01, Sigma-Aldrich Inc.) was used as a substitute [the intrinsic viscosity
[ ] η
, which characterizes the hydrodynamic specific volume of a polymer coil, is 0.69dL g
-1and the Huggins constant, which is related to the structure of polymer coil (for the self-avoiding chains,k < 0.52
), is 0.488]. Inasmuch as the two polymers are the stereoisomers, their behaviors should be essentially identical at least att = 0
. Unexpectedly, in the present condition, the gelation occurred at[ ]
ηC = 0.345
(much lower than the hydrodynamic overlapped concentration,[ ] ~ 1
ηC
)! Obviously, the formation of the self-organized helix (i.e., the regular TTG+G+ sequence of the s-PS) accompanied the significant expansion of the s-PS coils and made gelation at the dilute situation. From Daniel et al.,32 the self-organizing helix can be stabilized by o-xylene molecules intercalated between the phenyl groups (the π—π interactions62). It, however, seems rather doubtful that all was driven entirely by such "chemical" force. On the other hand, we concerned why the coil expansion is not an instantaneous conformational transition but again a continuous process.From a different angle, we all know that the preferred polymer crystal is the chain-folded lamellar crystal.63 The chain-folding not only is a most efficient way of packing polymer chains but also satisfies the homogeneous nucleus and the sharp interface as required for the classical nucleation theory. In contrast, the fibril, a so-called “fringed-micelle crystal,” could collapse due to the high cumulative strain energy64 and the entropy effect of overhanging loose chains at the sterically nervous transition-interface-layers. Thus, in bulk crystallization, the fibril is forbidden on the kinetic grounds.64,65 However, the fibril nucleation during the gelation is certainly a different physical process. Now that the fibril structure does not favor the minimization of the interface energy, the global entropy maximization may be the primary in its formation. Indeed, using the hard-sphere chain model, the Prigogine-Flory-Patterson theory66 predicts the entropy-driven phase separation to occur when the loss in the mixing entropy is compensated by the translational entropy increment.67,68 Snir and Kamien also show that a purely entropic force can be enough to bend the stiff polymer into a helix.69 So we suggest a hypothesis of entropy-driven crystallization to understanding the fibril formation.
Figure 9 (b) illustrates how this may arise.
We first consider a hard-sphere chain (self-avoiding chain) surrounded by many depleting spheres (solvent molecules). The excluded volume of the hard-sphere chain reduce the free volume in which the depleting spheres may live, as shown in Figure 9 (b) left.
Clearly, the only way to heighten the spheres' free volume (translational entropy) at constant internal energy is to allow the significant expansion of the hard-sphere chain, while its conformational entropy is more or less lost. However, whether the translational entropy can have an appreciable effect on the expansion of the hard-sphere chain should depend on the polymer concentration. We predict that the maximum translational entropy could be obtained near the overlap threshold (
[ ] ~1 η C
), enough to outweigh the loss in the conformational entropy. Even so, the stability of the expanded hard-sphere chain still has to depend on its persistence time. The stabilization can be done in two ways: either by a higher activation energy barrier for the rotational isomerization, or by the special chemical forces such as the π-π interactions, as shown in Figure 9 (b) middle. Furthermore, as the self-organizing helices grow beyond certain critical length, the depletion attraction caused by them would be sufficiently large to induce the fluctuation instability, as shown inFigure 9 (b) right. We finally have
known why the solution shows up as the long-lived metastable state.3.2. Morphogenetic Transition in Polymer Weak Gelation
Now we consider whether a morphogenetic transition may occur, if the morphogenetic differentiation results from the kinetic distinction between instability and metastability. We start with the spherulite assemblies, which we have made clear during these years and named
“nucleation gel” according to its kinetics, 14-17 and focus our attention to what may happen in the early stage. All results offer valuable insights into the theoretical treatment and dynamic experiments of polymer weak gelation in the future.
3.2.1. Experimental Evidence for Morphogenetic Transition
Figure 1 (See Sec. 1) shows all the details of the gelation process.
14-17 Let us focus on the cluster nucleation-growth stage, t <3000 s. For a (category 2) birefringent sphere,15 i.e., spherical cluster assembled by crystalline grains, its characteristic size, a , is estimated by the peak locus in the intensity map,q , in terms of
ma
∼4q
m,15,35 and its growth kinetics is identified by the simple power-law relationshipa t ( )
∼t
α; meanwhile, the critical cluster size,a
c, can extrapolate the power-law relationship back to the nucleation time,t
n( determined by the time of remarkable in the scattering invariant, 45 0 45 0( )
20
v v
H H
Q I q q dq
−
=
∞∫
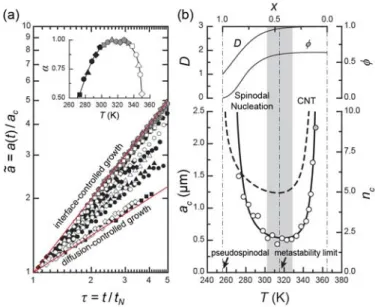
− ; the gelation time).Figure 10 (a) shows the scaled cluster size, a , versus scaled time, τ
, at different temperatures.Unexpectedly, the results indicates temperature dependence of
α
, which ranges between 0.5 (diffusion-controlled growth) and 1 (interface -controlled growth), cf. inset of Figure 10 (a).The highly diluted cluster nuclei in which the long-range diffusion of the crystalline grains
becomes important may account for the high temperature crossover. But, at low temperature, the crossover, once again, is not so clear. (Note: the freezing point of the solvent is much lower than the experiment temperatures.)
Figure 10 Nucleation-growth kinetics of clusters. (a) Power-law behavior of the scaled cluster size a vs.
scaled time τ at different temperatures. The inset shows the kinetic exponent, α . (b) Crossover behavior of critical cluster nucleation. The experimental critical cluster size, a
c(open circles), the best-fitted curve (tick line) calculated by Kalikmanvo's model, n
c(thick dash line), and the corresponding changes in average packing fraction, φ , and cluster dimension, D . The shading is the crossover region from CNT domain to spinodal nucleation domain.
A clue may be found in Figure 10 (b). The exceptional divergence of
a at low
c temperature evokes the image of the mean-field spinodal nucleation predicted by Cahn and Hilliard.52 The qualitative shape of thea
c curve can be examine by Kalikmanov's crossover function.70 Accordingly, the number of the crystalline grains constituting the critical cluster,n ,
c is given by( )
1 43 3
2 1 , 0 1
c 4
n
=B
⎡⎢⎣X
− +κ
−X
− ⎤⎥⎦ ≤X
≤ (2) where B is the thermodynamic coefficient,κ
is the dimensionless parameter, and X is the quench depth within the region of the metastability. In the function, whenX
→0+,n
c behaves corresponding to the classical nucleation theory (CNT); while whenX
→ , 1−n
c shows a singularity predicted by the spinodal nucleation. However, the critical cluster is not always a compact nucleus, because toward the spinodal nucleation a more or less fractal feature is established.70-72 In order to quantitative calculatea from
cn , one must account for its shape.
c For a fractal cluster, the size is written asa
c =a n
0(
cφ )
1 3, wherea is the size of the
0radius
a . From
cφ
=A a a (
c 0)
D−3andn
c =( a a
c 0)
D,73 we haveφ
=An
1 3/Dc− , where A is the packing factor and D is the dimension. Thus,φ
depends on the cluster’s dimension and decreases as the cluster grows larger. We setA
=0.64 for the close-packed but still remaining complete disorder74 and seta
0=0.2µm by our SEM micrograph14 and by Park et al.'s result for the core-shell structure of a PVDF chain in the dilute solution (R ∼
g 0.22µm ,h g 1.45
R R ∼
).75 As regards the shape of the critical cluster, we assume a Boltzmann sigmoidal form:D X ( )
=d
f + −(
3d
f)
⎡⎣1+e
(X X− 0)dX⎤⎦ , whered
f = for a ramified fractal (chain-like) 1 cluster.70Figure 10 (b) shows n (thick dash line) with the best-fitted result of
ca (thick line)
c and the corresponding changes in D andφ
, respectively. Clearly, the diffusion-controlled kinetics at low temperature can be associated with a continuous and collective spinodal nucleation.Having mentioned the cluster spinodal nucleation, we raise further questions to be explored: First, at first glance, the crystalline grains perhaps might seem to be a short-range attractive colloidal system, but it is not so (i.e., long-range interaction nature of the mean-field system). Secondly, the singularity behavior allows an extrapolation to locate the lower limit of the thermodynamic metastability of cluster nucleation, i.e., the so-called “pseudospinodal,” 76-78 but, beyond this limit, what is the specific texture showed? The answer to these questions may be the evidence of the morphogenetic transition we are looking for.
3.2.2. Scattering Modeling of the Morphogenetic Transition
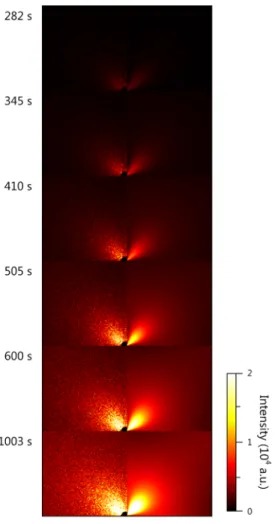
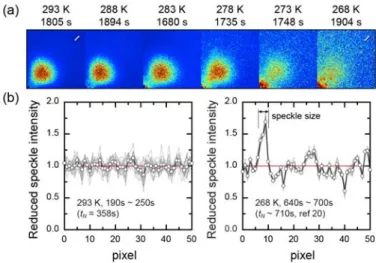
Figure 11 (a) Speckle patterns and the temporal fluctuations of speckle intensity on crossing the metastability limit. (b) The location of the speckle profiles are shown by the marks at above right of the 293 K and 268 K patterns, respectively.
In principle, the scattering pattern is composed of vast independent, (intensity) fluctuating speckles. The speckle is formed by the scattering of coherent light from an
inhomogeneous or a perturbational medium, especially by the interference of partial waves scattered from various position of the medium.79 The speckle size is proportional to the distance between the detector and the scatterers, and inversely proportional to the diameter of the collimated incident beam. When the instrumental geometry is determined, the speckle intensity and size are related to the spatial and temporal coherence of scatterers. Figure 11 (a) indicates that, on crossing the metastability limit,34,80 the background speckles gradually mask the patterns. As the left intensity chart of Figure 11 (b), since the short-time average can
“denoise” the data, there are thermal fluctuations in the homogeneous surrounding medium. On the contrary, in the right chart, the speckles with larger size and longer lifetime mean a comparatively immovable and appreciable inhomogeneous “structure” coexisting with the growing clusters. We have a good reason to think that near the pseudospinodal point, the cluster nucleation may occur in a “flickering” elastic background constituted by such a structure. More significantly, Klein et al. have highlighted that the nucleation in the system with long-range
elastic interactions behaves like a near mean-field system.
57By the scattering modeling approach,14,15 we can easily discern whether the cluster nucleation is true in a network. A simple model is given by (Supporting Information)
(
,) (
,) (
1) (
,) ( )
sin 22v v v
sphere fibril DB
H H fibril H fibril
I q ϕ
=P q ϕ
−φ
+P q ϕ φ
+P q ϕ
(3)where
I
Hv( q
,ϕ )
is the depolarized scattered intensity,P
Hspherev( q
,ϕ )
is the form factor of the birefringent sphere,80P
Hfibrilv( q
,ϕ )
is the form factor of the birefringent fibril,34P
DB( ) q
isthe Debye-Bueche factor,39 sin 22