CHAPTER IV. RESULTS AND DISCUSSION
This chapter’s purpose is to expose and explain the results found throughout the employees’ motivation survey that were applied in Cervecería Hondureña. For these interpretations has as its objective to know more about the motivation of the employees’
in the company. Here, six different hypotheses were tested using the SPSS statistical methods’ of ANOVA and T-test. For all the statistics tests, a Cronbach’s alpha (α) of 0.05 was used to explain whether the results were statistically significant or not. In addition, the researcher used the descriptive statistic to further illustrate the data for easier interpretation.
Demographics items results
There were a total of four hundred thirty-three (433) respondents who answered the Employees Motivation Survey (EMS) questionnaire which represented 99% of the total targeted population. This study survey got back almost one hundred percent of the questionnaires because the researcher had the full support of the company to execute this study. Of the total number that responded, three hundred twenty-two (322) represented 74.4% of the participants that were male and one hundred eleven (111) represented 25.6% of the participants that were female. The interviewees ages ranging from 18 to 24 represented 8.1%; the ages ranging from 25 to 30 represented 43.6%, which was the largest group; the ages ranging from 31 to 35 signifies 19.9% of the respondent; the ages ranging from 36 to 40 represented 16.4% of the respondent. While the final groups were clustered within the ages ranging 41 to 60 and they represented 12%, which was the smallest group of interviewees.
The majority of the participants in this survey were married, representing 50.8% of the sample population. Of the remaining sample 36.3% were single and the other 12.9%
were divided among divorced, widowed and others. In the data results that described their educational level 46.9% had a high school diploma, 41.3% had a bachelor’s degree, 8.8%
had a master degree, and 3% of the populations were among the doctorate, less than high school and other sort of educational degree. The 55% were working in the other employees’ area, the 30% in the staff area and the 15% in the executive and management
area. According to the sample size calculation it acquired 35.8% of the participants having between 2 to 4 years of working with the organization, 22.6% of the participants having less than two years, 21% of the participants having between 5 to 7 years of work, and 20.6% of the participants having between 8 to 16 years working in the company. In table 4.1 we can see these percentages that were discussed earlier.
Table 4.1 Demographics items percentages of responses
Demographics items Frequency of responses Percentage
Gender
Male 322 74.4
Female 111 25.6
Interviewees age
18 – 24 years old 35 8.1 25 – 30 years old 189 43.6 31 – 35 years old 86 19.9 36 – 40 years old 71 16.4 41 – 45 years old 32 7.4 46 – 50 years old 10 2.3 51 – 55 years old 7 1.6 56 – 60 years old 3 0.7
61 – 65 years old 0 0
More than 65 years old 0 0 Marital status
Single 157 36.3
Married 220 50.8
Divorced 23 5.3
Widowed 4 0.9
Other 29 6.7
Educational level
Less than high school 3 0.7 High school diploma 203 46.9 Bachelors’ degree 179 41.3
Masters degree 38 8.8
Doctorate degree 7 1.6
Other 3 0.7
Working area
Executives & Management 65 15
Staff 130 30
Other employees 238 55
Seniority Less than two years 98 22.6
2 to 4 years 155 35.8
5 to 7 years 91 21
8 to 10 years 40 9.2
Table 4.1 (Continued)
11 to 13 years 44 10.2
14 to 16 years 5 1.2
17 to 19 years 0 0
More than 20 years 0 0
In the table above shows the demographics items of the target population that participated in this study survey.
Table 4.2 Mean and standard deviation of demographics items
Demographics Items Mean Std. Deviation
Gender 1.26 0.43
Interviewees age 2.88 1.36 Marital status 1.91 1.02 Educational level 2.66 0.77
Working area 2.4 0.73
Seniority 2.52 1.28
In the table 4.2 shows the mean and standard deviation of each demographics item as a whole and in the table 4.1 showed the percentage of the participants according the demographics factors.
The importance of the five motivational factors
In this section the questions in the questionnaire survey were related to the nineteen questions that were used to answer the research questions and to prove the hypothesis.
This was divided into five different sections; these sections were explained by the research instrumentation in chapter three. The questionnaire used incorporated the five categories illustrated in the framework of the study. Each of the questions was related to the categories of the factor that were enlisted in the framework of the study. In appendix C shows this relationship, were the researcher showed the relationship that existed between each questions and each factors of motivation.
The purpose of this section is to present the ranking of percentages of each question into the different category and into the different scale of the importance use in the
questionnaire. And with these descript statistics results we can see clearly the relevance or importance that each questions have according to the opinions that the target population has about the factors of motivation that they considered were relevant for them. But the more remarkable issue from these results was the points of the “very important”. In the results we saw each question with a majority of percentage as the
“very important” factor. In the follow explanations of the results the researcher focused on these issues, and showed the order from the highest to lowest rank of percentage that the questions resulted.
After the percentage results of the questions were shown for each category within motivation which was more relevant for the target population then the researcher presented the top ten ranking of the twenty-five questions. This clearly showed what kind of motivational factors were more relevant or had more influence based on the response from the questionnaire in accordance with the interest of the participants, i.e., their needs and feelings about motivation in the working place.
Monetary factors
The questions related to the monetary category or factors are the first four questions, were the researcher asked about salary, bonuses, payment according performance and achievement differences in regards to the monetary rewards. In this category with the four questions the average results indicated that 66.3% of the participants selected the question number three, which was the amount based on the base salary; followed by the 65.1% responded that the pay linked to performance; and in the third position was the question four that had the opportunity based on achievement rewards. Then final was the bonuses questions which were the lowest rate with 47.8%. See table 4.3.
Table 4.3 Monetary category percentages of responses Question
No. Questions No
important at all
Unimportant Neutral Important Very important
1 Being able to earn bonuses 0 7.4 2.1 42.7 47.8
2 Pay linked to performance 0.5 0 0.9 33.5 65.1
3 A regular salary, according
with the living standard 0.5 1.8 4.4 27.0 66.3 4 Having the opportunity to
achieve different sort of
rewards 0 0 1.6 36.0 62.4
Note: The results are in percent
Here we can see that the employees considered the monetary category or the factors about motivation to be the most important issue because the result indicated that the participants regarded base salary to be “very important”, and the least important for them was to earn bonuses.
Organizational culture
In the organizational culture category the five different questions related to this topic were questions related to the relationship between the managers and coworkers; questions related to the culture within the environment; questions related to the work condition; and questions related to the communication aspect.
According with the answers provided by the participants in this survey, 76.2%
considered that the most important and motivating issue of the organizational culture of the organization was question eleven that said that the most important factor was the work condition. Then 75.1% considered that culture was the most important and they chose the question number seven that made reference to “feel that they are part of a team”.
While 73% of the target population believed that communication was an important motivation factor. In the fifth position we can see that 70.2% chose a question related to the relationship that should exist with the superiors and the coworkers. And this percentage was followed by the 43% of the participants who replied that work condition was important for them, with the question that asked them “of having job objectives demanding responsibilities and new challenges”. Another question that was related to the culture in the organization asked if the participant was having the risk of failing and if
changing their plans were important and for this question the results obtained was that this issue had no important. The table 4.4 below clearly presents these results. In the table the frequency and percentages of participants that choose each of this set of questions related to this motivational category is also displayed.
Table 4.4 Organizational culture category percentages of responses Question
No. Questions No
important at all
Unimportant Neutral Important Very important
7 Feel that I am part of a team 0.5 0 24.4 0 75.1 8 Having job objectives,
demanding responsibilities, and new challenges
0 0.2 5.1 51.7 43.0
9 Receiving collaboration from
my boss and coworkers 0 0 1.2 28.6 70.2
10
Having a good communication channels with the bosses and
colleagues 0.5 0 3.2 23.3 73.0
11 Having all the necessary resources for developing my job
0.5 0 3.0 20.3 76.2
Note: The results are in percent
According with the result from the participants shown in table 4.4, it was possible to see that the employees’ considered that feeling a part of a team was very important for them to feel motivated in the work place and get a better performance. So, having a good relationship with his/her coworkers and managers would make the employees feel more comfortable in the work place.
Benefits
These set of questions referred to the benefits factors of motivation. 79.4% of the participants considered that the most important factor of motivation was for the company to have insurance services for them and their families. This ranked was immediately followed by the feeling of job security in the workplace and knowing that their seniority was respect and taken into consideration with a 56.6%. It is clear to see that between the first and second ranking has big differences regarding the importance. In the third ranking position we can see that 51.3% of the participants chose that the social security was a
very important motivational factor. In the table 4.5 shows more clearly these three ranks in this section of the questionnaire survey.
Table 4.5 Benefits category percentages of responses Question
No. Questions No
important at all
Unimportant Neutral Important Very important
12 Having social security 0 0.5 14.3 33.9 51.3
13 Derive standing and feeling of importance from work and job seniority
0.5 0 6.7 36.3 56.5
15
Having a medical card and insurance services for me and my
family members 0 0 4.9 15.7 79.4
Note: The results are in percent
As can be seen in the results above that the major percentage of the employees which is eighty percent considered that the major benefit that the company can provide for them and their families was the insurances. Here we must remember that 50.8% of the target population was married, hence was the reason for this high response rate.
Recognitions
The topics that the researcher touched on in this section of the questionnaire survey was related to recognition of the goal achieved on the job. Also, another issue that was relevant was for the employees to be recognized for their performances they achieved in their labor activities, and so on.
The target population considered the most important factor of motivation in the recognition section was for the employees to be recognized for their performance which was indicated by 52.71% of the participants who chose the question related to this topic.
Followed by 48.7% of the participants who chose the question number seventeen which said that the employees’ felt motivated when they were recognized by the goal achieved and the job that they were doing. The third ranked question that indicated that the participants chose the topic of acknowledgement by managers and coworkers as very important motivational factor resulted with a 41.8%. A summary of these results can be seen in the table 4.6 below.
Table 4.6 Recognitions category percentages of responses Question
No. Questions No
important at all
Unimportant Neutral Important Very important 16 Being recognized for my
expertise 0 0.2 4.6 42.5 52.7
17 Being recognized for the job
I do and the goal I achieved 0.5 0 2.1 48.7 48.7 19
Acknowledgment by bosses and colleagues for effort,
skills and competencies 0 0.9 17.1 40.2 41.8 Note: the result is in percent
In the above results it shows that the participants’ considered this set of questions as very important issue of recognition factors in motivation. The issue of being recognized by the expertise the employees of the company stated that that made them to feel more motivated to strive in their work place and that made them feel more appreciated in their job.
HRD actualization
The last four questions of the questionnaire survey are related to the HRD actualization, as being the opportunity to have a career development, training opportunities, self-actualization, and promotion. These were the topics that were explored under this section.
According to the number of participants, from the four hundred thirty-three surveys who responded, 74.6% of the target population selected the question number twenty-five as a very important factor. This question was about the need to receive part training opportunities from the company that would make them feel motivate, so this question was related to self-actualization. 70.9% of the participant considered that working for a manager who gave value to the training was very important factors, while 63.7% select the question that career development in the company was very important. However, only 55.4% of the participants taught that having a job would allow them to grow and develop into the organization were a very important motivational factor. In table 4.7 below shows these results in a clearer way.
Table 4.7 HRD actualization category percentages of responses Question
No. Questions No
important at all
Unimportant Neutral Important Very important 21 Is a job which allow me to grow
and develop in the organization 3.2 0.5 8.1 32.8 55.4 23 Working for a boss who give value
to the training 0 0.2 6.9 21.9 71.0
24 The organization allows the employees to have a career
development 3.7 0 4.2 28.4 63.7
25 Receive part training opportunities
from the company 0 0 3.7 21.7 74.6
Note: The results are in percent
Taking a look at the table 4.7 above, we can see that for the target population of the company the more important factor of motivation in this set of question were the issue of been able to get promotion, the self-actualization, and training opportunities. These three percentages were very close. Therefore, for the HRD actualization section these results indicated that the employees considered that the important factor was promotion and training opportunities.
The ten factors of major ranking for the entire questionnaire
In this section the researcher presences the ten factors that were the highest ranked score in according with the frequency of “very important” with the liker scale used by the researcher in the questionnaire survey. This section shows the sort of factors that the employees felt motivated them to put more effort in their jobs. These factors were getting a better performance and improving their moral and satisfaction. In table 4.8 and figure 4.1 shows the rank that each factors obtained in the different questions in the questionnaire. Each of these questions was calculated out of a total of four hundred thirty-three questionnaires response which equaled hundred percent.
Table 4.8 Top ten motivational factors
Factors Questions N %
Benefits Insurance 344 79.4
Organizational culture Work condition 330 76.2 Organizational culture Culture 325 75.1 HRD actualization Self-actualization 323 74.6 Organizational culture Communication 316 73.0 HRD actualization Training opportunities 307 70.9 Organizational culture Managers & coworkers relationship 304 70.2
Monetary Base salary 287 66.3
Monetary Pay linked to performance 282 65.1 HRD actualization Career development 276 63.7
79.4 76.2 75.1 74.6 73 70.9 70.2
66.3 65.1 63.7
0 10 20 30 40 50 60 70 80 90
Benefits Org. Culture Org. Culture HRD Actualiza. Org. Culture HRD Actualiza. Org. Culture Monetary Monetary HRD Actualiza.
Figure 4.1 Top ten motivational factors
In figure 4.1 above shows a graphic representation of the ranks of the question that were selected by the majority of participants. They were related to the benefits that the company offered to the employees as their motivational factors and these were more relevant in the lives of the employees. Here the results showed that the monetary factor took almost the final position which was indicative of sixty-five percent. As is seen in table 4.8 and figure 4.1 above the participants in this survey of Cervecería Hondureña considered that the most important factor resulted with a 40% and was related to the
organizational culture. The others rank that followed were the cultural issue and the HRD actualization. These had the lowest ranking position which made a huge different between benefits which obtained the highest score.
With these results we can see that several literature about motivation have indicated that money by itself is enough to motivate employees. Other sorts of motivation, not just money, would make them to feel motivated to improve their performances and their job satisfaction. The theories that the researcher mention in chapter two showed that money was not the only one issue that motivated the employees. So with this result the companies and their managers should begin to consider the other issues that could help to improve the employees’ motivation and moral, so as to improve their overall performance. To end this section we can reinforce the statement in this paragraph that said “money alone isn’t enough to motivate people to excel on the job. In fact, the most effective incentive systems blend monetary with non-monetary forms of rewards – and often it’s was the non-monetary types that proved to be the most motivating” (Harvard Business School, 2005). Therefore, managers most take into consideration this situation as an indicator to decide how to improve the motivation, moral and job satisfaction of the workforce. With these results that were found from the data collection we can use them to answer the research question. The results indicated that the non-monetary aspect were more important and more relevant to the target population of this study than the monetary factor, since the results showed that the organizational culture, benefits and HRD actualization got the highest ranks in relation to the monetary factors.
The literature review gave tremendous support to the results obtained in the top ten important factors. In the sense that the money was not everything or the most important factor that motivated the workforce. Similarly, according to Bruce & Pepitone (1999) these researches say that money alone isn’t enough to motivate people to excel on the job.
According with DeNisi & Griffin (2001) they also stated that the fundamental purpose of compensation was to provide an adequate and appropriate reward system for employees, so that they feel valued and worthwhile organizational members and representatives.
However, something interesting was obtained from the results gotten from the survey, cause in the top ten ranking the recognition factor didn’t appear, this mean that for the employees that were surveyed in this company this factor wasn’t importance, and this
contradicts the literature reviewed, because several books and documents asserted that the recognitions was one of the most important factor of motivation. As Nelson & Spitzer (2003) stated that now more than ever, the use of recognition is a critical ingredient in the success of an organization. However, this result doesn’t mean that the recognition factor didn’t matter to the workforce in this company, or that the other items that didn’t get a high ranking mattered. The results only say that the employees have other items or issues that were more relevant to them in the organization. The recognition factor obtained 52.7% and with indicated that the recognition was also important, but no too relevant in this study since it wasn’t in the top ten ranks.
In the next section of this chapter the researcher explains the results that were obtained from the hypotheses that were tested using the one-way ANOVA.
The relationship between demographic items and motivational factors In this section of the research it shows the results obtained from the hypotheses results.
The purpose of this section is to check if there are any relationships between demographic items and motivational factors in accordance with the results attained from the test of the six hypotheses. The results are explained in the subsequent sections that follow.
Hypothesis 1: male and female opinion
Employees’ attitude and opinion toward motivation in the workplace were analyzed using one-way ANOVA. The purpose for applying ANOVA test were to determined statistical significant between gender and the motivational factors that were provided to the participants in the questionnaire survey. The reason why the researcher didn’t use T- test to test this hypothesis was because using ANOVA the homogenate would be much better than using T-test.
In table 4.9 shows the descriptive statistic that relates gender to motivational factors.
There we can find the frequency represented by N and the percentage represented by %.
Also the cumulative percentages of this relationship between these two issues were also indicated in the results.
Table 4.9 Descriptive statistic by gender
Demographic Item N % Valid % Cumulative %
Male 322 74.4 74.4 74.4
Female 111 25.6 25.6 100.0
Total 433 100.0 100.0 -
With these results it is evident that the majority of the target population that participated in this study was more male than female.
1. Monetary factor results
The monetary factor results using ANOVA revealed that the male and female employees findings were statistical significant. This result means that male and female employee thinks differently regarding the monetary factor. In the following table we can see the results in this case, see table 4. 10
Table 4.10 Monetary factor ANOVA results by gender
Items Sum of squares df Mean F p Between groups 1.005 1 1.005 5.004 0.026*
Within groups 86.586 431 0.201 - -
Total 87.591 432 - - -
* p < .05
The ANOVA indicated there are statistical significant, between gender and monetary factor which means that we accept the alternative hypothesis in this factor. The alternative hypothesis says that there are different opinion between male and female.
2. Organizational culture factor results
In the organizational culture factor the case was completely different from the monetary factor. The ANOVA in this factor ranked differently. In regard to gender with culture, work condition, managers and coworkers relationship and communication the results using ANOVA indicated that there were no statistical significant with the organizational culture and gender. The targeted population didn’t have a different opinion here either. Let see table 4.11 for more details.
Table 4.11 Organizational culture ANOVA results by gender
Items Sum of squares Df Mean F p Between groups 0.099 1 0.099 0.621 0.431
Within groups 68.585 431 0.159 - -
Total 68.684 432 - - -
* p < .05
Here it is assumed that the alternative hypothesis must be rejected while the null hypothesis was accepted. Therefore, this factor doesn’t have any differences in gender with organizational culture which was an exception of the work condition. However, we can assume that there were no relationship and we can say that in the organizational culture had no difference between male and female.
3. Benefits factor results
The ANOVA obtained from the benefit factor showed that there were no statistical significance in the opinion of the benefits between male and female and regarding social security, job security, and insurance. The ANOVA revealed that there were no statistical significant, this mean that there was no difference in the opinion about this factor of motivation between male and female. See table 4.12.
Table 4.12 Benefits ANOVA results by gender
Items Sum of squares Df Mean F p Between groups 0.024 1 0.024 0.178 0.673
Within groups 58.016 431 0.135 - -
Total 58.04 432 - - -
* p < .05
As we can see in the table above we certainly rejected the alternative hypothesis, and we accepted the null hypothesis. Here we can say that there was no difference in the opinion between male and female that was related to the benefit factor indicated in the organization data interpretation results.
4. Recognitions factor results
The result of this factor is the same with the benefits factors, were the ANOVA indicated that no statistical significant exited between male and female employees’
opinion about recognition into the workplace. As we look closer at the data results, it shows that the recognition factor was equal to the gender item. Therefore, we can reject the alternative hypothesis, because there were no relationship that existed between male and female opinion about the recognitions factors, see table 4.13.
Table 4.13 Recognition ANOVA results by gender
Items Sum of squares df Mean F p Between groups 0.003 1 0.003 0.014 0.907
Within groups 103.921 431 0.241 - -
Total 103.925 432 - - -
* p < .05
5. HRD actualization results
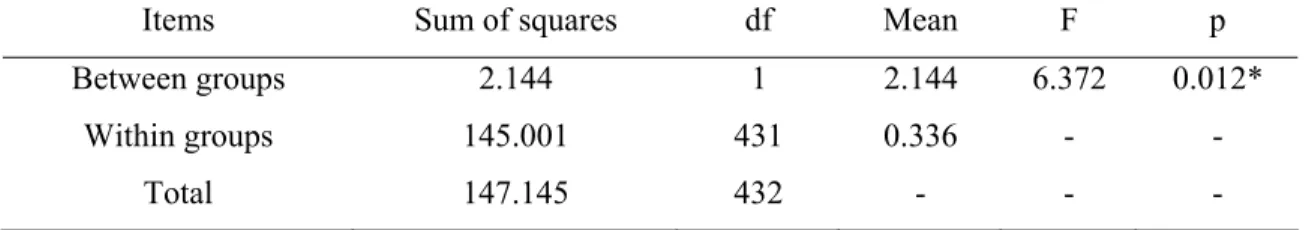
In the HRD actualization factor we can see that ANOVA ranked a little bit different, however the alternative hypothesis was accepted as seen in the following results. In regard to gender with training opportunities, career development, and self-actualization the ANOVA results showed that there were statistically significant. Maybe this result was because the male in the Latin culture were more able to take training or seminars, and the female were the one that would be at home. Thus the major of the population who participated were male. See table 4.14.
Table 4.14 HRD actualization ANOVA results by gender
Items Sum of squares df Mean F p Between groups 2.144 1 2.144 6.372 0.012*
Within groups 145.001 431 0.336 - -
Total 147.145 432 - - -
* p < .05
With the results obtained from the ANOVA we can accept the alternative hypothesis, and say that there were differences in the opinion between male and female about the HRD actualization factor relating to the motivational factor.
6. Different opinion between male and female
In the different opinion between male and female we can say that this hypothesis did not show a strong difference in the opinion between male and female because three of the five factors of motivation were rejected in the hypothesis statement. Therefore, it can be assumed that the monetary and HRD actualization issues had different opinion with gender in the demographic factor, see table 4.15.
Table 4.15 ANOVA results of five motivational factors by gender
Items Sum of squares df Mean F p Between groups 0.171 1 0.171 1.691 0.194
Within groups 43.51 431 0.101 - -
Total 43.676 432 - - -
* p < .05
Based on these result we rejected the hypothesis that there is different opinion between male and female, but the monetary and HRD actualization factors were not rejected.
Hypothesis 2: management, staff members, and other employees’ opinion
The employees’ opinion about the management, staff members, and others employees, were analyzed using ANOVA. In table 4.16 presents the descriptive statistics data of this hypothesis.
Table 4.16 Descriptive statistic by working area
Demographic Item N % Valid % Cumulative % Executive & Management 65 15.0 15.0 15.0
Staff 130 30.0 30.0 45.0 Other employees 238 55.0 55.0 100.0
Total 433 100.0 100.0 -
The purpose of this testing was to determine the statistical significance relationship amount management, staff members, and others employees within the organization. In the follow paragraph the researcher stated the results obtained from the ANOVA testing for the second hypothesis.
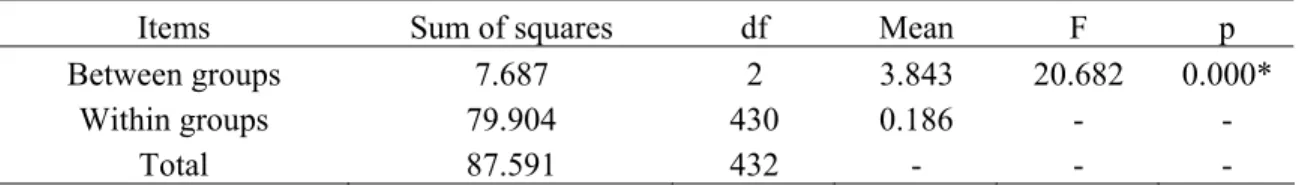
1. Monetary factor results
The ANOVA test revealed that there were differences in the opinion in the workforce that worked in the different areas within the company. So, regarding the management, staff members, and other employees with salary according to performance, amount of the base salary, and reward the ANOVA indicated that there were statistical significant. This means that there was different opinion amount the workforce that worked in different areas of the organization. See table 4.17.
Table 4.17 Monetary factor ANOVA results by working area
Items Sum of squares df Mean F p Between groups 7.687 2 3.843 20.682 0.000*
Within groups 79.904 430 0.186 - -
Total 87.591 432 - - -
* p < .05
In spite of these results launched by the ANOVA test, we accept the alternative hypothesis, that there was different opinion among management, staff members, and other employees which was indicated in the monetary factor results.
2. Organizational culture factor results
According to the ANOVA results it indicated that this factor had a strong significant value in the relationship that the management, staff member, and other employees had
with the difference in opinion about the organizational culture factor in their workplace.
Regarding management, staff members, and other employees with culture, work condition, managers and coworkers relationship, communication there are statistical significant. See table 4.18.
Table 4.18 Organizational culture ANOVA results by working area
Items Sum of squares df Mean F p Between groups 3.581 2 1.791 11.827 0.000*
Within groups 65.102 430 0.151 - -
Total 68.684 432 - - -
* p < .05
In conclusion, we can accepted the alternative hypothesis that there were different opinion amount the management, staff members, and others employees about the organizational culture factors according to the results that the ANOVA indicated.
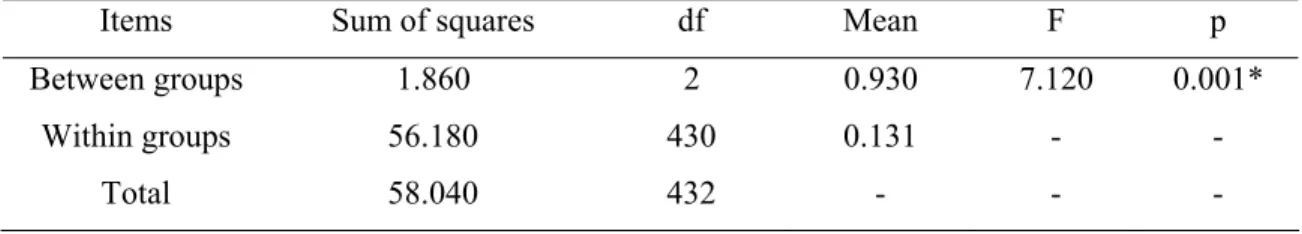
3. Benefits factor results
In this factor the ANOVA indicated that management, staff members, and other employees’ responses concerning benefits in the workplace had different opinions. So concerning management, staff members, and other employees with social security, job security, insurance, the ANOVA reveled that there were statistical significant. This meant that the alternative hypothesis was accepted. The situation can be best explained that the employees’ working in the different areas of the organization had different needs.
See table 4. 19.
Table 4.19 Benefits ANOVA results by working area
Items Sum of squares df Mean F p Between groups 1.860 2 0.930 7.120 0.001*
Within groups 56.180 430 0.131 - -
Total 58.040 432 - - -
* p < .05
In this case we can realize that the workforce had different opinion about the benefits that they can obtain from the company as motivational factor.
4. Recognitions factor results
The result from the ANOVA testing on the recognitions factor indicated that there were difference in the opinion among management, staff members, and other employees.
Regarding management, staff members, and others employees with employee performance and goal achieved there were statistically significant. See table 4.20.
Table 4.20 Recognition ANOVA results by working area
Items Sum of squares df Mean F p Between groups 1.779 2 0.889 3.744 0.024*
Within groups 102.146 430 0.238 - -
Total 103.925 432 - - -
* p < .05
In this factor we accepted the alternative hypothesis that there existed different opinion about the management, staff members, and other employees.
5. HRD actualization results
In the HRD actualization factor the ANOVA indicated a result that showed a significant relationship amount the employees that worked in the different areas of the organization and their motivational factor. Regarding the management, staff members, and other employees with promotion, training opportunities, career development, self- actualization, the ANOVA indicated that there were significant relationship in the HRD actualization factors. This meant that the management, staff member, and other employees, had a different opinion of this factor of motivation, so we accepted the alternative hypothesis. See table 4.21.
Table 4.21 HRD actualization ANOVA results by working area
Items Sum of squares df Mean F p Between groups 15.178 2 7.589 24.729 0.000*
Within groups 131.966 430 0.307 - -
Total 147.145 432 - - -
* p < .05
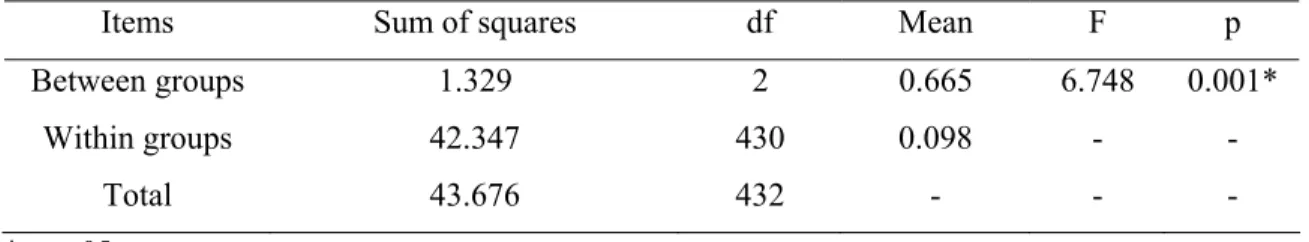
6. Different opinion among management, staff members, and other employees
For the different opinion among management, staff members, and other employees it can be concluded that the alternative hypothesis were accepted for the five different motivational factors. The results also indicated that there were differences in the opinion among the employees that worked in the different areas of the organization in relation to these factors. See table 4.22.
Table 4.22 ANOVA results of five motivational factors by working area
Items Sum of squares df Mean F p Between groups 1.329 2 0.665 6.748 0.001*
Within groups 42.347 430 0.098 - -
Total 43.676 432 - - -
* p < .05
Hypothesis 3: single, married, divorce, and widowed employees’ opinion
The ANOVA in this third hypothesis was focused on testing if there were any different opinion among the marital status of the employees about factors of motivation into the organizational environment. In table 4.23 shows the statistic results here we can see three demographics items that were clustered because the participants number in these three items “divorced, widowed, and other” were too small. Thus it gave better results so the researcher decided to cluster these three items.
Table 4.23 Descriptive statistic by marital status
Demographic Item N % Valid % Cumulative %
Single 157 36.3 36.3 36.3
Married 220 50.8 50.8 87.1
Divorced, Widowed, and other 56 12.9 12.9 100.0
Total 433 100.0 100.0 -
The application of the ANOVA was because here more than two variables were tested, so with this statistical tools determined the existence of statistical significant in the opinion of the employees that were single, married, divorce or widowed, in reference to the motivational factors.
1. Monetary factor results
The ANOVA confirmed that there were a statistical significance with the marital status and the monetary factor. The participants showed that there was different opinion in respect to this issue. Regarding marital status single, married, divorce, and widowed, with bonuses, salary according with performance and reward, the ANOVA indicated that there were statistically significance. So we accepted the alternative hypothesis, that there were different opinions about monetary factors from the marital status demographic factor. See table 4.24.
Table 4.24 Monetary factor ANOVA results by marital status
Items Sum of squares df Mean F p Between groups 3.525 2 1.763 9.016 0.000*
Within groups 84.066 430 0.196 - -
Total 87.591 432 - - -
* p < .05
Here we accepted the alternative hypothesis for the monetary factor in the three items in this category.
2. Organizational culture factor results
The ANOVA results indicated that the opinion about this factor of motivation among the marital status of the employees doesn’t have any statistical significance, so the employees had different opinion under this factor. Regarding single, married, divorce, and widowed with culture, managers and coworkers relationship, communication, work condition, ANOVA indicated that there were no statistical significant. Here we can see that the employees; single, married, divorced, and widowed had different opinion about the organizational culture. So, we rejected the alternative hypothesis and we accepted the null hypothesis. Hence, in this issue the employees with different marital status had different opinion about this item under the organizational culture factors. See table 4.25.
Table 4.25 Organizational culture ANOVA results by marital status
Items Sum of squares df Mean F p Between groups 0.792 2 0.396 2.508 0.083
Within groups 67.892 430 0.158 - -
Total 68.684 432 - - -
* p < .05
3. Benefits factor results
The ANOVA revealed that in these factors the marital status has a statistical significance, given that the employees single, married, divorced, and widowed had a different opinion about the benefits factors of motivation in their workplace. Regarding the single, married, divorced, and widowed with social security, Job security, insurance, the ANOVA indicated that there were statistical significant in the three items that confirmed the benefits factors, so without any doubt we accepted the alternative hypothesis, as we can see in table 4.26. These results can be to the situation that the employees’ that are single doesn’t have the same responsibility of take a re family as the married employees, and so on.
Table 4.26 Benefits ANOVA results by marital status
Items Sum of squares df Mean F p Between groups 5.208 2 2.604 21.194 0.000*
Within groups 52.832 430 0.123 - -
Total 58.040 432 - - -
* p < .05
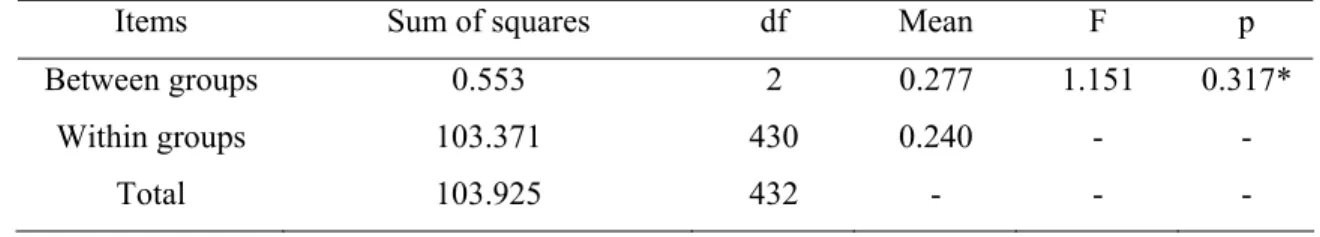
4. Recognitions factor results
In the results that the ANOVA launched in the recognitions factor of motivation indicate that there were no different opinion among the marital status of the employees in respect to these factors. Regarding single, married, divorced, and widowed employees with employee performance, goal achieved, and acknowledgement, ANOVA indicated that there were no statistical significant, so we rejected the alternative hypothesis, and we accepted the null hypothesis. See table 4.27.
Table 4.27 Recognition ANOVA results by marital status
Items Sum of squares df Mean F p Between groups 0.553 2 0.277 1.151 0.317*
Within groups 103.371 430 0.240 - -
Total 103.925 432 - - -
* p < .05
5. HRD actualization results
The results obtained from the ANOVA in this motivational factor don’t present a difference opinion among the marital status of the employees about HRD actualization in relation to marital status. So regarding the single, married, divorce, and widowed employees with HRD actualization the ANOVA indicated that there were no statistical significant. Therefore, with these results we had to reject the alternative hypothesis and accept the null hypothesis. See table 4.28.
Table 4.28 HRD actualization ANOVA results by marital status
Items Sum of squares df Mean F p Between groups 1.100 2 0.550 1.620 0.199
Within groups 146.044 430 0.34 - -
Total 147.145 432 - - -
* p < .05
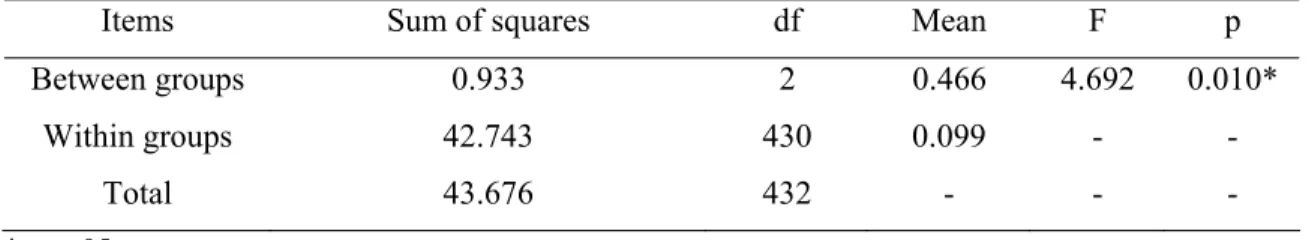
6. Different opinion among single, married, divorced, and widowed
In the different opinion among single, married, divorced and widowed we can conclude that the alternative hypothesis was accepted, and say that the employees with different marital status have different opinion or perceptions about motivation in the workplace, see table 4.29. In regards to the manager they most take this point into consideration in order to apply new ways of motivating their employees.
Table 4.29 ANOVA results of five motivational factors by marital status
Items Sum of squares df Mean F p Between groups 0.933 2 0.466 4.692 0.010*
Within groups 42.743 430 0.099 - -
Total 43.676 432 - - -
* p < .05
Hypothesis 4: employees’ age range opinion
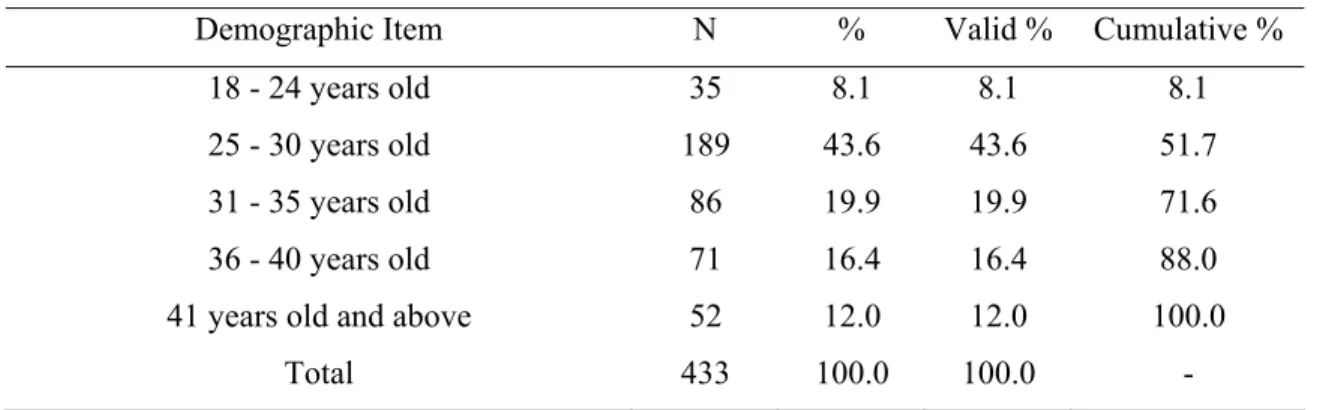
The workforce opinions toward factors of motivation in the workplace were also analyzed using ANOVA, including the fourth hypothesis that was related to age range of the workforce in the company. The purpose of applying the ANOVA was to determined statistical significant amount the age range of the employees vs. the five different motivational factors that were using in this study survey. We can see the descriptive statistics results obtained from this hypothesis in table 4.30, and also in this table we can see that the last four range of age in the questionnaire were cluster. Ages from forty-one years old upwards the researcher cluster the results because the size resulted were too
small in comparison with the other age range. Therefore, these last four range age on their own wouldn’t be significant for the study, so the researcher decide to cluster.
Table 4.30 Descriptive statistic by age range
Demographic Item N % Valid % Cumulative % 18 - 24 years old 35 8.1 8.1 8.1 25 - 30 years old 189 43.6 43.6 51.7 31 - 35 years old 86 19.9 19.9 71.6 36 - 40 years old 71 16.4 16.4 88.0 41 years old and above 52 12.0 12.0 100.0
Total 433 100.0 100.0 -
1. Monetary factor results
The ANOVA revealed that the employees’ age range resulted in different opinion about the factors of motivation. In regards to age range with the items; bonuses, salary according with performance, and reward, ANOVA indicated that there were statistical significant. See table 4.31.
Table 4.31 Monetary factor ANOVA results by age range
Items Sum of squares df Mean F p Between groups 7.001 4 1.750 9.296 0.000*
Within groups 80.59 428 0.188 - -
Total 87.591 432 - - -
* p < .05
With these results we accepted the alternative hypothesis, and concluded that there was different opinion between employees’ age range and the monetary factors. Thus we accepted the alternative hypothesis and rejected the null hypothesis for the monetary factor tested.
2. Organizational culture factor results
The ANOVA confirmed that the opinion of the employees with different age range was different. In regards to the age range with culture, work condition, managers and
coworkers relationship, communication, and work condition, the ANOVA revealed that there were statistical significant. Here we accepted the alternative hypothesis, that there was different opinion between the employees’ range age and the motivational factor of the organizational culture, see table 4.32.
Table 4.32 Organizational culture ANOVA results by age range
Items Sum of squares df Mean F p Between groups 4.090 4 1.023 6.775 0.000*
Within groups 64.593 428 0.151 - -
Total 68.684 432 - - -
* p < .05
3. Benefits factor results
In this factor of benefits, the ANOVA also confirmed that the difference in the employees’ age range brought different opinion about this factor of the employees in the organization. Regarding age range to social security, job security, and insurance, the ANOVA revealed that there were statistical significant, and we accepted the alternative hypothesis. See table 4.33. For the results in this section we can say that the employees’
in different age have a different need, and therefore they want to get different sort of benefits.
Table 4.33 Benefits ANOVA results by age range
Items Sum of squares df Mean F p Between groups 9.515 4 2.379 20.980 0.000*
Within groups 48.526 428 0.113 - -
Total 58.040 432 - - -
* p < .05
4. Recognitions factor results
In the recognitions facto, the ANOVA also confirmed that the difference in the employees’ age range brought different opinion about this factor and the employees in the organization. Regarding the age range to employee performance, goal achieved, and
acknowledgement, the ANOVA revealed that there were statistical significant, and we accepted the alternative hypothesis. See table 4.34. The results in this section can be the reason why the employees’ in different age had different kind of need, and therefore they want to get different sort of benefits.
Table 4.34 Recognition ANOVA results by age range
Items Sum of squares df Mean F p Between groups 3.073 4 0.768 3.261 0.012*
Within groups 100.851 428 0.236 - -
Total 103.925 432 - - -
* p < .05
5. HRD actualization results
The ANOVA revealed in this motivation factor that the employees’ from different age range had different opinion about the HRD actualization, may be because the youngest employees were more interested in getting more new knowledge or because they wanted to get a quicker promotion and develop a career in the organization. These responses were difference with the elder employees who already had developed their careers and status, position, and experience in the company. Regarding age range to promotion, training opportunities, career development, self-actualization, the ANOVA indicated that there were statistical significant. Thus the alternative hypothesis was accepted. Taking this result it was confirmed that the employees’ from different age had different opinion or perspective about the HRD actualization as motivational factor. See table 4.35.
Table 4.35 HRD actualization ANOVA results by age range
Items Sum of squares df Mean F p Between groups 9.435 4 2.359 7.331 0.000*
Within groups 137.710 428 0.322 - -
Total 147.145 432 - - -
* p < .05