CHAPTER FOUR ANALYSES AND RESULTS
Chapter four presents the results of this study. The first part of this chapter describes the background information of participants. The second part reports the overall online reading strategy patterns gathered from the computer tracking mechanism. The third part explores the interrelationship between reading strategy use and comprehension. The fourth part presents the results from the post-task survey and final reflection which targeted participants’ perceptions of the current technology-enhanced reading program, English Reading Online. The last part presents strategy use of four case studies from videotaping and semi-structured interviews.
Results of the Background Questionnaire
The background questionnaire (see Appendix P), adapted from Hanson-Smith’s (2003a) questionnaire for computer/Internet users on the types of reading done electronically, was a 5-point Likert scale questionnaire that provided information on 30 participants’ langauge learning profiles and their views on reading online texts.
Questions included four sections: (1) participants’ demographic data, (2) their computer skills and purposes for using computers, (3) their time spent on online reading tasks, and (4) comparison between reading printed texts and online texts.
Students indicated their level of agreement from Strongly Agree (assigned as the rating of 5) to Strongly Disagree (assigned as the rating of 1) and they could also add written comments at the end of each section. The mean of the response to each question was calculated by multiplying the number of responses for each rating by the rating number (1 through 5), adding the results, and then dividing that total by the total number of respondents (30 participants). The results of the background questionnaire will be presented in the order of the aforementioned four sections.
The first section of the background questionnaire examined demographic data.
Among the thirty second-year Applied English majors who participated in this study, 22 of them were females and 8 were males, and they ranged in age from 19 to 23.
Prior to their undergraduate studies, eight of them graduated from general senior high schools, while twenty-two graduated from vocational senior high schools. Among these vocational high school graduates, twelve of them were originally applied English majors, six were business majors, and four were engineering majors. Table 6 shows students’ self-evaluation of their own English skills. It was found that most of them were conservative about their overall English proficiency (M=2.60, SD=0.71), their English reading ability (M=2.74, SD=0.74), and their use of reading strategies (M=3.10, SD=0.79). They also regarded learning English as difficult (M=3.07, SD=0.81), but they were motivated to learn English (M=4.33, SD=0.77).
Table 6. Participants’ Self-Evaluations of English Proficiency
Question Mean SD
11. My English is good. 2.60 0.71
12. I have good English reading proficiency. 2.74 0.74 13. I like to learn English very much. 4.33 0.77 14. I think learning English is difficult. 3.07 0.81 15. I’m good at using reading strategies. 3.10 0.79
Note. N=30. Strongly Agree=5, Strongly Disagree=1. The possible highest score is 5.
The second part of the questionnaire, Questions 16-24, was to ascertain students’
computer skills and their purposes of using the computers. The results shown in Table
7 indicated that students in general were most capable of searching information on the
World Wide Web (M=4.27, SD=0.63). They were also confident about using
computers (M=3.30, SD=0.74) and utilizing the computer resources for language
learning (M=3.33, SD=0.65). As for the purposes for using computers, they used
computers primarily for emails (M=4.33, SD=0.70), leisure activities (reading fashion
news, watching movies, listening to songs, etc.)(M=4.33, SD=0.60), and academic
Table 7. Participants’ Computer Skills and Purposes for Using Computers
Question Mean SD
16. I’m confident using the computer. 3.30 0.74 17. I’m confident about using computer language
resources, such as dictionaries on CD, software on ELT, etc.
3.33 0.65 18. I’m confident using World Wide Web. 4.27 0.63
19. I use computers for fun, such as playing games. 3.30 1.22 20. I use computers to send emails. 4.33 0.70 21. I use computers for academic purposes, such as
writing papers. 4.03 0.55
22. I use computers for leisure, such as watching fashion
news or listening to songs. 4.33 0.60
23. I use computers for chatroom and BBS. 3.30 1.16
Note. N=30. Strongly Agree=5, Strongly Disagree=1
purposes (M=4.03, SD=0.55). They also used computers for fun (M=3.30, SD=1.22), and for communication via chatrooms and BBS stations (M=3.30, SD=1.16).
Other purposes indicated by students in their additional comments included joining online chat, doing online auction, and downloading online resources such as freeware, online games, mp3, etc. In conclusion, students had fairly good skills in dealing with basic computer applications, such as emailing, surfing on the net, etc.
They also used computers for communication, academic, and entertainment purposes.
Table 8 presents the results of the time participants spent on online reading tasks revealed in the third section of the questionnaire. The data showed that 53.33% of the students spent one to three hours per day surfing on the net. Students did not spend much time in email, with 66.67% of them spending only one to three hours per week reading email from teachers and 46.67% of them spending the same amount of time reading email from friends. With regard to the time spent reading online for fun, 50%
of them spent one to three hours per day participating in e-lists, discussion boards, or
Table 8. Time on Online Reading Tasks Weekly (1-3hrs)
Weekly (3+hrs)
Daily (1-3hrs)
Daily (3+ hrs) TYPE of ACTIVITY
F % F % F % F % 25. I go online. 2 6.67 4 13.33 16 53.33 8 26.67 26. I read e-mail from friends. 14 46.67 6 20.00 10 33.33 0 0.00 27. I read e-mail from teachers. 20 66.67 5 16.67 5 16.67 0 0.00 28. I read pages on the Web for
fun.
6 20.00 6 20.00 14 46.67 4 13.33 29. I read pages on the Web for
academic purposes, e.g., to find articles for my report.
12 40.00 13 43.33 2 6.67 3 10.00
30. I participate in e-lists, discussion boards, or live chat for fun, e.g., a hobby website.
11 36.67 2 6.67 15 50.00 2 6.67
31. I participate in e-lists, discussion boards, or live chat for academic
purposes.
20 66.67 5 16.67 5 16.67 0 0.00
online groups; and 46.67% of them read web pages for one to three hours per day.
Students spent relatively less time reading for academic purposes, with 43.33% of them spending over 3 hours per week reading web pages. In addition, 66.7% of the students spent only one to three hours per week participating e-lists, discussion boards, or online groups for academic purposes. In conclusion, students spent more time using computers for fun than for academic purposes.
Table 9 shows participants’ views on printed texts versus online texts found in
the last section of the background questionnaire. Students mildly agreed that they
skimmed and scanned more when they read online than when they read printed texts
(M=3.10, SD=1.04). The possible reasons were that the heading and boldface features
Table 9. Participants’ Views on Printed vs. Electronic Text
Question Mean SD
32. I do more skimming and scanning of materials online/onscreen than I do of materials printed on paper.
3.10 1.04
33. I prefer reading online or onscreen to reading materials printed on paper of comparable length.
2.67 1.01 34. I find ads in frames, pop-ups, and other commercials
on Web pages to be distracting.
3.37 1.25
Note. N=30. Strongly Agree=5, Strongly Disagree=1
of online texts were more obvious and convenient for scanning. Besides, the information provided on the Internet might not be real; therefore, careful reading, such as reading word-by-word, was not necessary.
In addition, most of the participants did not express their preference over online reading (M=2.67, SD=1.01). When asked about the reason, they reported the problems of eye strain when reading online. Besides, as they also had long been adapted to the simplicity of the one dimensional information presentation mode in paper-based reading, multimedia presentation modes in online reading gave them a sense of overload. Furthermore, advertisements in frames, pop-ups, and other commercials on Web pages were distracting and annoying (M=3.37, SD=1.25).
However, there was still some positive feedback about reading online mentioned in the additional comments, such as the convenience that hyperlinks could provide.
While reading online, they did not have to flip hard to get information.
When asked about the greatest difference between reading materials
electronically and reading materials printed on paper in the final question of the
background questionnaire, participants reported that electronic reading contained fast
circulated information that enabled students to gain a variety of information, whereas
paper reading presented knowledge in a fixed way. Reading books gave students a
sense of security and a better grip on reality because they could touch it, own it, and write notes on it. Reading online materials, though providing more interesting and resourceful information, would not retain in their mind for long. They couldn’t read it in details because the nature of the online text was to be flashy, short, and attention-gathering.
Pre-Defined Reading Strategies in English Reading Online
Students’ online reading strategies will be first discussed from their use of strategy function buttons pre-defined in English Reading Online. Their newly emerged patterns of strategy collected via videotaping techniques and semi-structured interview will later be presented.
The web-based reading program, English Reading Online, incorporated 15 strategy function buttons (Keyword, Preview, Prediction, Dictionary, Translation, Summary, Outline, Grammar, Highlight, Notebook, Pronunciation, Music box, Question, and Semantic mapping) grouped under four types of strategies (Global strategy, Problem-solving strategies, Support strategies, and Socio-affective strategies). The navigation behaviors of the students, including their use of these 15 strategy function buttons in reading four articles of different topics and difficulty levels, were tracked within this program. The number of times each strategy button was clicked and the time spent on each strategy button indicated how often and how long students used that particular strategy. The following section will first start with the distribution patterns of 15 strategy buttons and then uncover the results of strategy use across proficiency levels, topics, and text difficulty using Chi-square analyses.
After that, time on each strategy button will be discussed to validate the use of strategies.
Frequency of Strategy Use
In this section, analyses will be presented in the following order: (1) distribution
of strategy use by all students, (2) distribution of strategy use by the High and the Low proficiency groups, (3) strategy use across topics (movie, history, travel, and holiday) by all students, (4) strategy use across topics by the High and the Low proficiency groups, (5) strategy use across the text difficulty levels (Articles 1 & 2 for easier texts, while Articles 3 & 4 for difficult texts) by all students, and (6) strategy use across the text difficulty levels by the High and the Low proficiency groups.
Distribution of Strategy Use by All Students
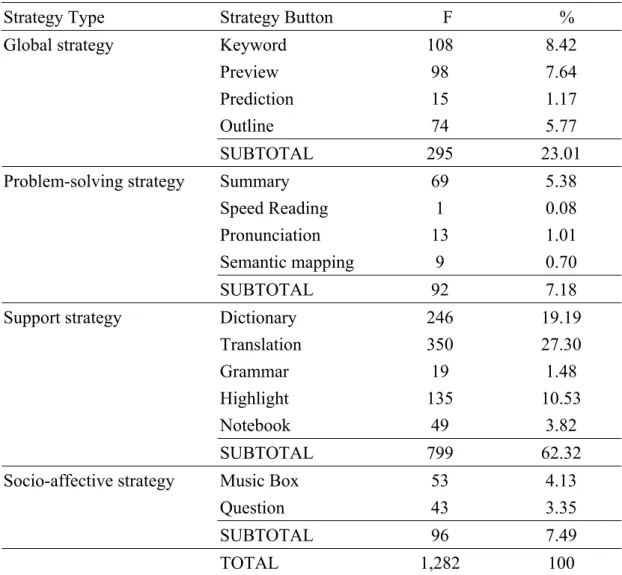
The results of the total number of clicks of each strategy function key and the distribution of four types of reading strategies defined in English Reading Online are shown in Table 10.
Table 10. Strategies Used by All Students in Reading Four Articles
Strategy Type Strategy Button F %
Keyword 108 8.42
Preview 98 7.64
Prediction 15 1.17
Outline 74 5.77
Global strategy
SUBTOTAL 295 23.01
Summary 69 5.38
Speed Reading 1 0.08
Pronunciation 13 1.01
Semantic mapping 9 0.70
Problem-solving strategy
SUBTOTAL 92 7.18
Dictionary 246 19.19
Translation 350 27.30
Grammar 19 1.48
Highlight 135 10.53
Notebook 49 3.82
Support strategy
SUBTOTAL 799 62.32
Music Box 53 4.13
Question 43 3.35
Socio-affective strategy
SUBTOTAL 96 7.49
TOTAL 1,282 100
The percentage of strategy use shown in Table 10 was calculated by dividing the number of times students clicked on a particular strategy button by the total number of times students used reading strategy buttons. In reading the four lessons, all students used Support strategies most frequently (62.32%), with Global strategies coming in at a distant second (23.01%), Socio-affective strategies an even more distant third (7.49%), and Problem-solving strategies the last (7.18%). The Chi-square test showed that the difference between the use of four categories of strategies was statistically significant, with Support strategies outnumbering the other three types of strategies (χ
2=1036.58, df =3, p < .0001). The graphic presentation is shown in Figure 17.
23.01%
Global strategies
7.18%
Problem-solving strategies 7.49%
Socio-affective strategies
62.32%
Support strategies
Figure 17. Strategy Distribution Chart
Among the fifteen strategies, Translation was most frequently used (27.30%),
followed by Dictionary (19.19%) and Highlight (10.53%). The top three frequently used strategies all belonged to the category of Support strategies. The three least used strategies were Speed Reading (0.08%), Semantic Mapping (0.7%), and Pronunciation (1.01%), which all fell into the category of Problem-solving strategy.
Distribution of Strategy Use by the High and the Low Groups
The results of the High proficiency group’s and the Low proficiency group’s strategy patterns will be discussed from their use of individual strategy function buttons, followed by their use of four types of strategies. Table 11 shows how each individual strategy button was used by the High and the Low proficiency groups.
Table 11. Strategies Used by the High and the Low Groups in Reading Four Articles High Group Low Group Strategy type Strategy button
F
% F %
Keyword 73 10.46 35 5.99
Preview 49 7.02 49 8.39
Prediction 9 1.29 6 1.03
Outline 40 5.73 34 5.82
Global
SUBTOTAL 171 24.50** 124 21.23**
Summary 33 4.73 36 6.16
Speed Reading 1 0.14 0 0
Pronunciation 9 1.29 4 0.68
Semantic mapping 8 1.15 1 0.17
Problem- solving
SUBTOTAL 51 7.31 41 7.02
Dictionary 134 19.20 112 19.18
Translation 187 26.79 163 27.91
Grammar 10 1.43 9 1.54
Highlight 76 10.89 59 10.1
Notebook 31 4.44 18 3.08
Support
SUBTOTAL 438 62.75 361 61.82
Music Box 21 3.01 32 5.48
Question 17 2.44 26 4.45
Socio-affective
SUBTOTAL 38 5.44** 58 9.93**
TOTAL 698 100 584 100
Note. ** p<0.05 by z-test.
It can be seen from Table 11 that among the 15 strategy buttons, the High proficiency group used Translation most frequently (26.79%), followed by Dictionary (19.2%) and Highlight (10.89%). Likewise, the Low proficiency group used Translation most (27.91%), followed by Dictionary (19.18%), and Highlight (10.1%).
Therefore, the top three strategies among these two groups were the same, with Translation the most frequently used, followed by Dictionary and Highlight.
The least used strategies among the High proficiency group were Speed Reading (0.14%), Semantic Mapping (1.15%), and Prediction (1.29%), whereas those among the Low proficiency group were also Speed Reading (0%), Semantic Mapping (0.17%), and Prediction (1.03%). Therefore, the bottom three strategies also showed similar patterns, with Speed Reading used least frequently, Semantic Mapping the second, and Prediction the third.
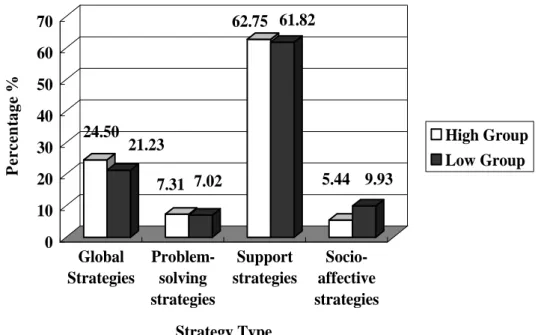
Although the top and bottom three strategies used by the High and the Low proficiency groups were identical, their use of four strategy categories was not the same. Of the strategies used by the High proficiency group, 24.50% were Global strategies; 7.31% were Problem-solving strategies; 62.75% were Support strategies;
and 5.44% were Socio-affective strategies. As for the Low proficiency group, 21.23%
were Global strategies; 7.02% were Problem-solving strategies; 61.82% were Support strategies; and 9.93% were Socio-affective strategies. When the Chi-square analysis was conducted, it was found that the High proficiency group’s and the Low proficiency group’s use of strategies was significantly different (χ
2=10.10, df=3, p=0.0177).
When the z-test for two proportions (Test of Homogeneity of Proportions) was
further conducted to examine which strategies resulted in the difference, it was found
that, the obvious difference was that the High group used Global strategies (24.50%)
more often than the Low group (21.23%), while the Low group used Socio-affective
strategies (9.93%) more frequently than the High group (5.44%). The graphic presentation is in Figure 18.
24.50 21.23
7.31 7.02
62.75 61.82
5.44 9.93
0 10 20 30 40 50 60 70
Percentage %
Global Strategies
Problem- solving strategies
Support strategies
Socio- affective strategies Strategy Type
High Group Low Group
Figure 18. Distribution of Four Types of Strategies Used by the High and the Low groups
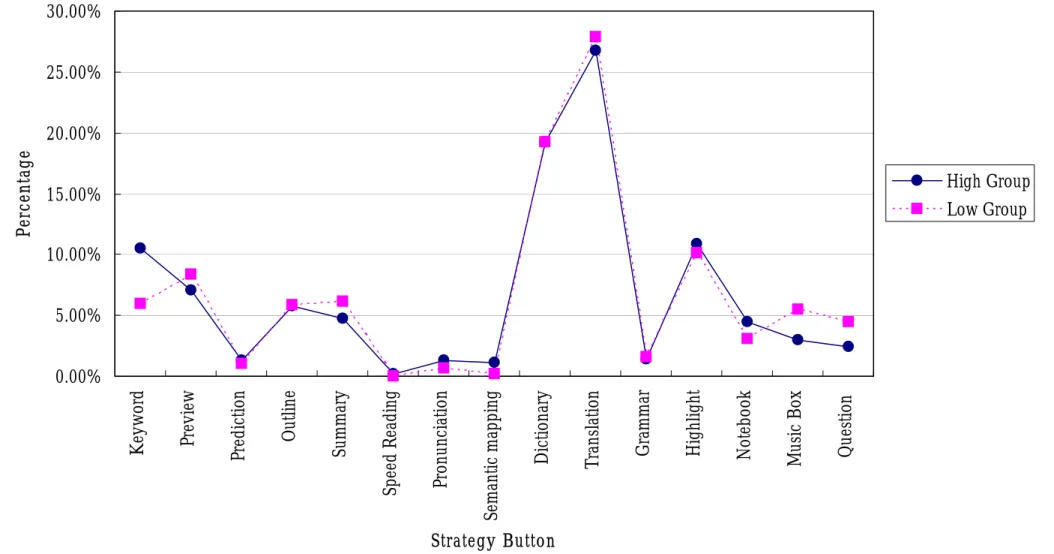
When I further examined individual strategy button usage among Global and Socio-affective strategies that showed difference, it was found that the greatest difference was the use of Keyword, with the High proficiency group using 4.47%
more than the Low proficiency group. The High group accessed important words of
the reading texts more frequently than the Low group. The second and third
differences were the strategy buttons of Music Box and Question. The Low group
listened to music and asked questions more often than the High group, with the
difference of 2.47%, and 2.01% respectively. Figure 19 presents the difference
between the High and the Low proficiency groups on individual strategy button usage.
Figure 19. The Percentages of Individual Strategy Button Usage of the High and the Low Groups 0.00%
5.00%
10.00%
15.00%
20.00%
25.00%
30.00%
Ke y w or d Pr ev ie w Pr ed ic tio n O utlin e Su m m ar y S peed R ead in g P ronunc ia ti on S em ant ic m ap pi ng D ic tio na ry T ran sl at io n G ra mmar H ighl ig ht N o te book Mu si c B ox Q u es tio n
Strategy Button
Pe rc e n ta g e
High Group
Low Group
Strategy Use Across Topics by All Students
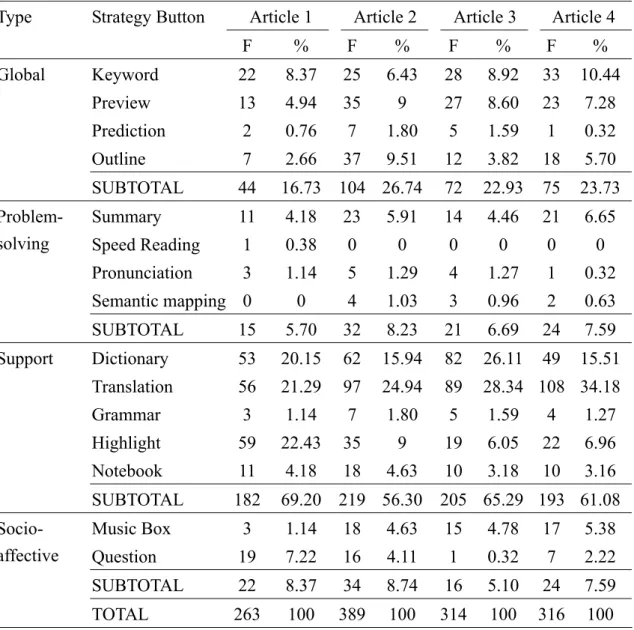
Students’ strategy use in reading four articles with different topics is shown in Table 12. Four articles represented four topics in the order of movie (Finding Nemo), history (Pyramids), travel (Taj Mahal), and holiday (St. Patrick’s Day). In addition, Articles 1 and 2 represented easy texts, while Articles 3 and 4 were difficult texts. The current section will first discuss how topics influenced strategy use in terms of (1) the types of strategies used across topics, and (2) the total number of strategies used across topics. How text difficulty influenced strategy patterns will be presented later.
Table 12. The Use of Strategy Buttons Across Lessons by All Students
Type Strategy Button Article 1 Article 2 Article 3 Article 4
F % F % F % F %
Keyword 22 8.37 25 6.43 28 8.92 33 10.44
Preview 13 4.94 35 9 27 8.60 23 7.28
Prediction 2 0.76 7 1.80 5 1.59 1 0.32
Outline 7 2.66 37 9.51 12 3.82 18 5.70
Global
SUBTOTAL 44 16.73 104 26.74 72 22.93 75 23.73
Summary 11 4.18 23 5.91 14 4.46 21 6.65
Speed Reading 1 0.38 0 0 0 0 0 0
Pronunciation 3 1.14 5 1.29 4 1.27 1 0.32 Semantic mapping 0 0 4 1.03 3 0.96 2 0.63 Problem-
solving
SUBTOTAL 15 5.70 32 8.23 21 6.69 24 7.59
Dictionary 53 20.15 62 15.94 82 26.11 49 15.51 Translation 56 21.29 97 24.94 89 28.34 108 34.18
Grammar 3 1.14 7 1.80 5 1.59 4 1.27
Highlight 59 22.43 35 9 19 6.05 22 6.96
Notebook 11 4.18 18 4.63 10 3.18 10 3.16
Support
SUBTOTAL 182 69.20 219 56.30 205 65.29 193 61.08 Music Box 3 1.14 18 4.63 15 4.78 17 5.38 Question 19 7.22 16 4.11 1 0.32 7 2.22 Socio-
affective
SUBTOTAL 22 8.37 34 8.74 16 5.10 24 7.59
TOTAL 263 100 389 100 314 100 316 100
First, with regard to strategy types across topics, in reading Article 1, students
used Support strategies most frequently (69.20%), with Global strategies coming in at a distant second (16.73%), Socio-affective strategies following the third (8.37%), and Problem-solving strategies (5.70%) coming the last. Students used the same order of the most-used to the least-used strategies in reading Article 2, with Support strategies (56.30%) being used most often, followed by Global strategies (26.74%), Socio-affective strategies (8.74%), and Problem-solving strategies (8.23%). In reading Article 3, Support strategies were still the most frequently used strategies (65.29%), followed by Global strategies (22.93%). However, the rankings for Problem-solving strategies (6.69%) and Socio-affective strategies (5.10%) were reversed compared with Articles 1 and 2. In reading Article 4, students used Support strategies most frequently (61.08%), with Global strategies coming in at a distant second (23.73%), and Socio-affective and Problem-solving strategies an even more distant third (7.59%).
In general, while reading the four articles, the top two most frequently used strategies were all Support and Global strategies. Problem-solving strategies were ranked the last place in Articles 1 and 2, while their ranking was elevated to the third place in Articles 3 and 4. From these descriptive data, Problem-solving strategies seemed to be used increasingly frequently from Article 1 to Article 4. As articles were read from Article 1 to Article 4, this may imply that with more practice, students were becoming frequent users of Problem-solving strategies. Despite the observed difference in rank order, the Chi-square test showed that strategy types used by all students across topics were not statistically different (χ
2= 16.77, df = 9, p =0.0524).
With regard to the total number of strategies used across topics for all students
(see Table 13), the Chi-square analysis showed that the frequency of strategies used
across lessons was significantly different (χ
2= 25.15, df =3, p <0.0001). The difference
was that in reading Article 2, on the history of pyramids, students used the greatest
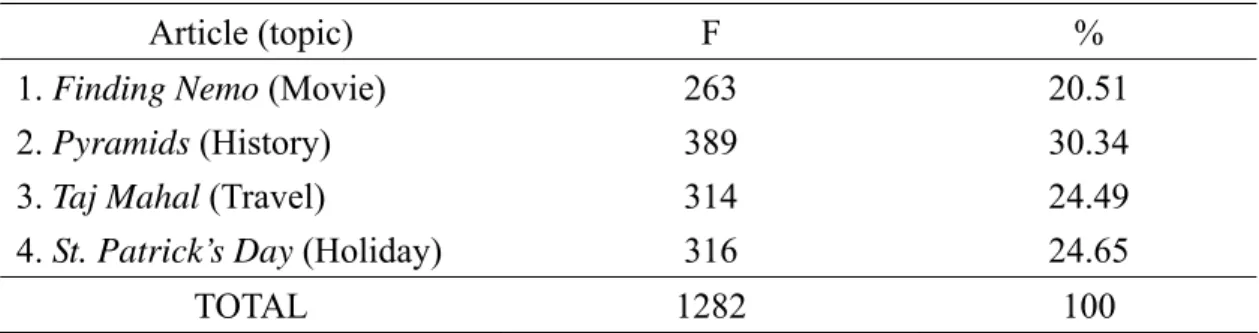
Table 13. The Total Number of Strategies Used Across Topics
Article (topic) F %
1. Finding Nemo (Movie) 263 20.51
2. Pyramids (History) 389 30.34
3. Taj Mahal (Travel) 314 24.49
4. St. Patrick’s Day (Holiday) 316 24.65
TOTAL 1282 100
number of strategies (30.34%), followed by Article 4 on St. Patrick’s Day (24.65%), Article 3 on traveling to the Taj Mahal (24.49%), and Article 1 on the movie, Finding Nemo (20.51%). The fact that Article 2, which has a complex structure, triggered the
higher number of strategy use will be discussed in detail later.
In summary, although students used the same types of strategies in reading these four articles of different topics, the number of strategies used in reading Article 2 outnumbered the ones used in reading the other articles.
Strategy Use Across Topics by the High and the Low Groups
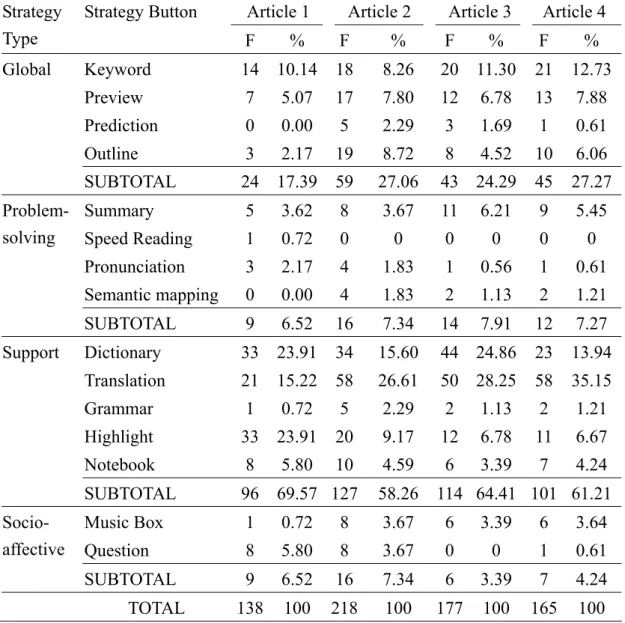
Strategy use across topics between the High proficiency group and the Low proficiency group is discussed from the four types of strategy use and the total number of strategies. First, with regard to strategy patterns, the results of the High proficiency group’s use of strategies in reading four articles with different topics are shown in Table 14. Of the strategies used by the High proficiency group in reading Article 1, Support strategies were used most (69.57%), followed by Global strategies (17.39%), Problem-solving strategies (6.52%), and Socio-affective strategies (6.52%).
In reading Article 2, Support strategies were also the most frequently used strategies
(58.26%), followed by Global strategies (27.06%), Problem-solving strategies
(7.34%), and Socio-affective strategies (7.34%). In reading Article 3, the most-used to
least-used strategies were Support strategies (64.41%), Global strategies (24.29%),
Problem-solving strategies (7.91%), and Socio-affective strategies (3.39%). Article 4
Table 14. Strategy Use Across Topics by the High Group
Article 1 Article 2 Article 3 Article 4 Strategy
Type
Strategy Button
F % F % F % F %
Keyword 14 10.14 18 8.26 20 11.30 21 12.73
Preview 7 5.07 17 7.80 12 6.78 13 7.88
Prediction 0 0.00 5 2.29 3 1.69 1 0.61
Outline 3 2.17 19 8.72 8 4.52 10 6.06
Global
SUBTOTAL 24 17.39 59 27.06 43 24.29 45 27.27
Summary 5 3.62 8 3.67 11 6.21 9 5.45
Speed Reading 1 0.72 0 0 0 0 0 0
Pronunciation 3 2.17 4 1.83 1 0.56 1 0.61 Semantic mapping 0 0.00 4 1.83 2 1.13 2 1.21 Problem-
solving
SUBTOTAL 9 6.52 16 7.34 14 7.91 12 7.27
Dictionary 33 23.91 34 15.60 44 24.86 23 13.94 Translation 21 15.22 58 26.61 50 28.25 58 35.15
Grammar 1 0.72 5 2.29 2 1.13 2 1.21
Highlight 33 23.91 20 9.17 12 6.78 11 6.67
Notebook 8 5.80 10 4.59 6 3.39 7 4.24
Support
SUBTOTAL 96 69.57 127 58.26 114 64.41 101 61.21
Music Box 1 0.72 8 3.67 6 3.39 6 3.64
Question 8 5.80 8 3.67 0 0 1 0.61
Socio- affective
SUBTOTAL 9 6.52 16 7.34 6 3.39 7 4.24
TOTAL 138 100 218 100 177 100 165 100 showed the same order—Support strategies the first (61.21%), Global strategies the second (27.27%), Problem-solving strategies the third (7.27%), and Socio-affective strategies the last. The Chi-square test showed that the High proficiency group did not use different types of strategies in reading these four articles (χ
2= 9.562, df = 9, p=0.387). Overall, in reading these four articles, the High proficiency group all used
Support strategies the most, followed by Global strategies, Problem-solving strategies, and Socio-affective strategies.
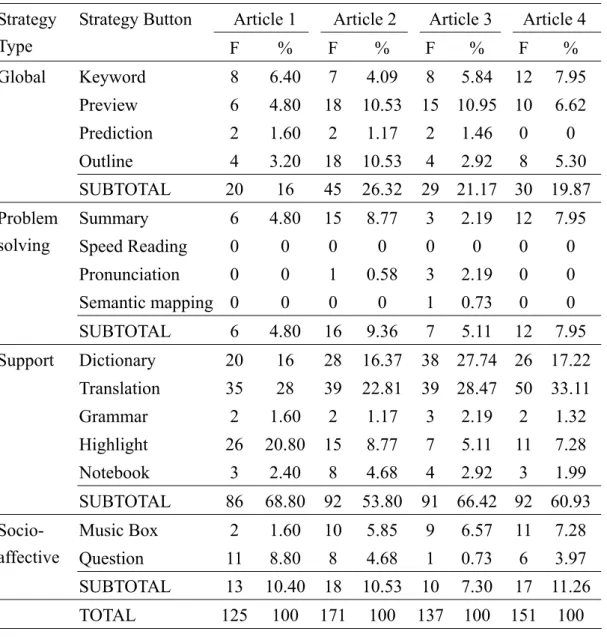
Table 15 shows strategy use across topics for the Low proficiency group. Of the
strategies used by the Low proficiency group in reading all four articles, the
Table 15. Strategy Use Across Topics by the Low Group
Article 1 Article 2 Article 3 Article 4 Strategy
Type
Strategy Button
F % F % F % F %
Keyword 8 6.40 7 4.09 8 5.84 12 7.95
Preview 6 4.80 18 10.53 15 10.95 10 6.62
Prediction 2 1.60 2 1.17 2 1.46 0 0
Outline 4 3.20 18 10.53 4 2.92 8 5.30
Global
SUBTOTAL 20 16 45 26.32 29 21.17 30 19.87
Summary 6 4.80 15 8.77 3 2.19 12 7.95
Speed Reading 0 0 0 0 0 0 0 0
Pronunciation 0 0 1 0.58 3 2.19 0 0
Semantic mapping 0 0 0 0 1 0.73 0 0 Problem
solving
SUBTOTAL 6 4.80 16 9.36 7 5.11 12 7.95
Dictionary 20 16 28 16.37 38 27.74 26 17.22 Translation 35 28 39 22.81 39 28.47 50 33.11
Grammar 2 1.60 2 1.17 3 2.19 2 1.32
Highlight 26 20.80 15 8.77 7 5.11 11 7.28
Notebook 3 2.40 8 4.68 4 2.92 3 1.99
Support
SUBTOTAL 86 68.80 92 53.80 91 66.42 92 60.93 Music Box 2 1.60 10 5.85 9 6.57 11 7.28
Question 11 8.80 8 4.68 1 0.73 6 3.97 Socio-
affective
SUBTOTAL 13 10.40 18 10.53 10 7.30 17 11.26
TOTAL 125 100 171 100 137 100 151 100
most-used to the least-used strategies were Support strategies, Global strategies,
Socio-affective strategies, and Problem-solving strategies. The Chi-square test
showed that the Low proficiency group did not use different types of strategies in
reading four articles (χ
2= 11.495, df = 9, p=0.243). Although the High proficiency
group and the Low proficiency group used similar patterns in reading these four
articles, differences were found between the High and the Low proficiency groups in
the ranking of the four types of strategies. The observed difference was that the High
group used Socio-affective strategies the least in reading these four articles, whereas
the Low group used the Problem-solving strategies the least. This phenomenon was in
some way similar to the results of the section on the distribution of strategy use of the High and the Low proficiency groups. The common findings were that Socio-affective strategies were used least by the High proficiency group, whereas Problem-solving strategies were used the least by the Low proficiency group. As Articles 1 and 2 and Articles 3 and 4 represented two sets of texts with different difficulty levels, Table 14 and Table 15 will be further elaborated later to show how text difficulty influenced strategy use.
To compare the total number of strategies used by the High proficiency and the proficiency Low proficiency groups in reading articles of different topics, the results from Table 14 and Table 15 were combined to show the difference (see Table 16).
Table 16. The Total Number of Strategies Used by the High and the Low Groups in Reading Articles Across Topics
Article 1 Article 2 Article 3 Article 4 TOTAL Group
F % F % F % F % F %
High Low
138 125
19.77 21.40
218 171
31.23 29.28
177 137
25.36 23.46
165 151
23.64 25.86
698 584
100 100 In reading Article 1, the High proficiency group used 138 strategies, which consisted of 19.77% out of the total number of strategies used in four articles (698).
Likewise, the number of strategies used in reading Articles 2, 3 and 4 consisted of
31.23%, 25.36%, and 23.64% of the total strategies. For the Low proficiency group,
the percentages of strategies used in Articles 1, 2, 3, and 4 were 21.40% (125 out of
584), 29.28%, 23.46%, and 25.86% respectively. From the observed data, both groups
used the largest number of strategies in reading Article 2. This finding was consistent
with the findings of the previous section on strategy use across topics: the total
number of strategies used by all students in reading Article 2 was the largest. The
Chi-square test showed that the difference in the total number of strategies used by the
High proficiency and the Low proficiency groups in reading the four articles of
different topics was not statistically significant (χ
2= 1.9149, df = 3, p=0.5903).
In summary, while reading articles of different topics, the High proficiency group did not use different strategy patterns, nor did the Low proficiency group. Besides, the High and the Low proficiency groups did not use different numbers of these four types of strategies in reading articles of different topics.
Strategy Use across Difficulty Levels of the Text by All Students
This section discusses how text difficulty influenced the strategy use. As
mentioned before, the four articles used represented four different topics.
In addition, they also represented different levels of text difficulty. Articles 1 and 2 were easy texts, while Articles 3 and 4 were difficult texts, with Article 1 being the easiest and Article 4 the most difficult. The strategy use across difficulty levels of the texts for all students can be discussed from the total number of strategies and the types of strategies used.
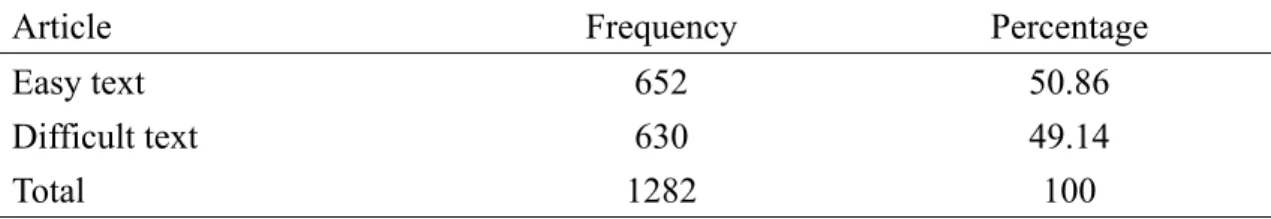
Table 17, summarizing the results from Table 12, shows the total number of strategies used by all the students reading easy and difficult texts. Students used a total of 652 strategies in reading easy texts (Articles 1 and 2), while they used 630 strategies in reading difficult ones (Articles 3 and 4). The total number of strategies used in reading easy text texts (i.e. 50.86%) was slightly higher than in reading difficult texts (49.14%). However, the Chi-square test showed that the difference of the total number of strategies used in reading easy and difficult texts was not statistically significant (χ
2= 0.3775, df = 1, p =0.5389).
Table 17. The Total Number of Strategies Used by All Students in Reading Easy and Difficult Texts
Article Frequency Percentage
Easy text 652 50.86
Difficult text 630 49.14
Total 1282 100
In addition to the total number of strategies used in reading easy and difficult texts, the researcher was interested to know whether the strategy type was different for all students reading texts of different difficulty levels. Table 18, summarizing the results of Table 12, shows students’ strategy types in reading easy and difficult texts.
Table 18. Strategy Use in Reading Easy and Difficult Texts by All Students
Global Problem-solving Support Socio-affective TOTAL Article
F % F % F % F % F %
Easy Difficult
148 147
22.70 23.33
47 45
7.21 7.14
401 398
61.50 63.17
56 40
8.59 6.35
652 630
100 100 It can be seen from Table 18 that of the strategies that students used in reading easy texts, 22.70% were Global strategies; 7.21% were Problem-solving strategies;
61.50% were Support strategies; and 8.59% were Socio-affective strategies. In reading difficult texts, students used 23.33% Global strategies, 7.14%
Problem-solving strategies, 63.17% Support strategies, and 6.35% Socio-affective
strategies. From descriptive statistics, it was found that students used Support
strategies and Global strategies slightly more frequently in reading difficult texts than
in reading easy texts. On the other hand, Social-affective strategies and
Problem-solving strategies were used slightly more frequently in reading easy texts
than in reading difficult texts. However, as these percentage differences were not very
noticeable, the Chi-square test showed that there was no significant difference
between strategy use with regard to text difficulty (χ
2= 2.348, df =3, p=0.5034). In
other words, text difficulty did not affect strategy use. Students used similar strategy
patterns in reading both easy and difficult texts. The graphic presentation is shown in
Figure 20.
22.7 23.33
7.21 7.14
61.5 63.17
8.59 6.35
0 10 20 30 40 50 60 70
Percentage %
Global strategies
Problem- solving strategies
Support strategies
Socio- affective strategies Strategy Type
Easy Te xts
Difficult Te xts
Figure 20. Strategy Use in Reading Easy and Difficult Texts by All Students
In summary, when students read easy and difficult texts, the total number of strategies and the strategy types were not significantly different. Students used similar sets of strategies in dealing with texts of different difficulty levels.
Strategy Use across Difficulty Levels of the Text by the High and the Low Groups This section will focus on strategies used by the High and the Low proficiency groups in reading articles of different difficulty levels in terms of the total number of strategies and the types of strategies.
Based on Table 14 and Table 15, Table 19 summarizes the total number of
strategies used by the High proficiency and Low proficiency groups in reading easy
and difficult texts. The Chi-square test showed that the difference of the total number
of strategies used between the High proficiency group and the Low proficiency group
in reading easy and difficulty texts was not statistically significant (χ
2= 0.0129, df = 1,
p = 0.9097).
Table 19. The Total Number of Strategies Used by the High and the Low Groups in Reading Easy and Difficult Texts
High Group Low Group TOTAL
Group
F % F % F %
Easy texts 356 54.60 296 45.40 652 100
Difficult texts 342 54.29 288 45.71 630 100
To examine the strategy types used by the High and Low proficiency groups in reading easy and difficult texts, Table 20, which is a summary of Tables 14 and 15, will be discussed in the following order: (1) strategy types used by the High proficiency group in reading easy and difficult texts, (2) strategy types used by the Low proficiency group in reading easy and difficult texts, (3) strategy types used by the High and Low proficiency groups in reading easy texts, and (4) strategy types used by the High and the Low proficiency groups in reading difficult texts. First, for the High proficiency group, Global strategies were used 23.32% in easy texts, while they were used 25.73% in difficult texts. Problem-solving strategies consisted of 7.02% of all the strategies used by the High proficiency group in reading easy texts, while they were 7.60% in reading difficult texts. Support strategies were used 62.64%
in easy texts, while they were used 62.87% in difficult texts. Socio-affective strategies were used 7.02% in easy texts, while they were used 3.80% in difficult texts. It can be seen from Table 20 that the greatest difference for the High proficiency group in reading easy and difficult texts was their use of Socio-affective strategies—their use of Socio-affective strategies decreased when text difficulty increased. Although the Chi-square analysis showed that the High proficiency group did not use different strategies in reading easy and difficult texts (χ
2=3.822 df=3, p=0.281), this phenomenon was interesting and might be further discussed as the p-value was close to 0.1.
Second, for the Low proficiency group, Global strategies were used 21.96% in
Table 20. The Strategy Types Used By the High and the Low Groups in Reading Articles of Different Difficulty Levels
High Group Low Group Article
Strategy Type
F % F %
Global 83 23.32 65 21.96
Problem-solving 25 7.02 22 7.43
Support 223 62.64 178 60.14
Socio-affective 25 7.02 31 10.47 Easy Texts
(Articles 1 & 2)
TOTAL 356
a100 296
c100
Global 88 25.73** 59 20.49**
Problem-solving 26 7.60 19 6.60
Support 215 62.87 183 63.54
Socio-affective 13 3.80** 27 9.37**
Difficult Texts (Articles 3 & 4)
TOTAL 342
b100 288
d100
Note. a This number represents the total number of strategies used by the High group in reading easy texts.
b This number represents the total number of strategies used by the High group in reading difficult texts.
c This number represents the total number of strategies used by the Low group in reading easy texts.
d This number represents the total number of strategies used by the Low group in reading difficult texts.
** p<0.05
reading easy texts, while they were used 20.49% in reading difficult texts.
Problem-solving strategies were 7.43% in easy texts, whereas they were used 6.60%
in reading difficult texts. Support strategies were used 60.14% in easy texts, while they were used 63.54% in difficult texts. Socio-affective strategies were used 10.47%, whereas they were used 9.37% in difficult texts. The Chi-square analysis showed that the Low proficiency group did not use different strategies in reading easy and difficult texts (χ
2= 0.754, df = 3, p=0.862).
Third, the comparison of the strategy types used by the High and the Low
proficiency groups in reading easy and difficult texts revealed differences in their
approaches to reading these different types of texts. The Chi-square analysis showed
that the High proficiency group and the Low proficiency group did not use different
strategy patterns in reading easy texts (χ
2= 2.574, df = 3, p=0.462). The graphic
presentation is shown in Figure 21.
23.32 21.96
7.02
7.43 62.64
60.14
7.02 10.47
0 10 20 30 40 50 60 70
Percentage %
Global strategies
Problem- solving strategies
Support strategies
Socio- affective strategies Strategy Type
High group Low group
Figure 21. Strategy Types Used by the High and Low Groups in Reading Easy Texts
Last but not least, in reading difficult texts, there were significant differences in strategy patterns between the High and the Low proficiency groups (χ
2= 9.726, df = 3, p=0.021). When the z-test for two proportions (Test of Homogeneity of Proportions)
was further used to examine the difference, it was found that the High group used a
comparatively higher percentage of Global strategies (25.73%) than the Low group
(20.49%), whereas the Low group used Socio-affective strategies (9.37%) more
frequently than the High group (3.80%) (p<0.05). The graphic presentation is shown
in Figure 22. This result was consistent with the data in the previous section on the
distribution of strategy by the High and the Low proficiency groups. The common
findings were that the High proficiency group preferred to use Global strategies,
whereas the Low proficiency group preferred to use Socio-affective strategies. The
results of this section also confirmed the tendency of the High proficiency group’s use
of less Socio-affective strategies in reading difficult texts.
25.73 20.49
7.60 6.60
62.87 63.54
3.80 9.37
0 10 20 30 40 50 60 70
Percentage %
Global strategies
Problem- solving strategies
Support strategies
Socio- affective strategies Strategy Type
High group Low group
Figure 22. Strategy Types Used by the High and the Low Groups in Reading Difficult Texts
In summary, just as the results found in the previous section showed that text
difficulty did not affect strategy use by all students, the results gathered in this section
also showed a similar finding: neither the High proficiency group nor the Low
proficiency group changed their use of strategies for reading easy or difficult texts. In
short, text difficulty did not affect strategy use by all students, by the High proficiency
group, and by the Low proficiency group. However, when proficiency level and text
difficulty were both taken into consideration, strategy types showed interesting
variations. Specifically, the High proficiency group tended to use more Global
strategies than the Low proficiency group, whereas the Low proficiency group was
inclined to use more Socio-affective strategies than the High proficiency group. The
High proficiency group seemed to dislike the use of Socio-affective strategies,
especially when they were reading difficult texts.
Time on Strategy Use
Time on strategy use will be discussed from the total time used on strategy buttons, followed by the sequence of how strategy buttons were used.
Total Time Spent on Each Strategy Button
This section first presents the results of the time spent on accessing each function in reading the four articles for all students, followed by High proficiency group’s and Low proficiency group’s time on strategy use. Table 21 shows the average time that students spent on each strategy button in reading four articles.
Table 21. Time Spent on Each Strategy Button by All Students Strategy
type
Strategy button
TOTAL Time
TOTAL click
Average Time per click
Keyword 10,329 108 95.64
Preview 4,866 98 49.65
Prediction 251 15 16.73
Outline 5,425 74 73.31
Global
SUBTOTAL 20,871 295 70.75
Summary 2,937 69 42.57
Speed Reading 53 1 53.00
Pronunciation 2,483 13 191.00
Semantic mapping 3,136 9 348.44
Problem-solving
SUBTOTAL 8,609 92 93.58
Dictionary 43,146 246 175.39
Translation 62,565 350 178.76
Grammar 282 19 14.84
Highlight 29,870 135 221.26
Notebook 6,452 49 131.67
Support
SUBTOTAL 142,315 799 178.12
Music Box 116,128 53 2,191.09
Question 9,330 43 216.98
Socio-affective
SUBTOTAL 125,458 96 1,306.85
TOTAL 297,253 1,282 231.87
Note. Units were counted by seconds.
The average time per click was calculated by dividing the total time spent on the strategy button by the total number of clicks. For example, students spent 10,329 seconds on a total of 108 clicks of Keyword strategy button; therefore, the average time per click on Keyword strategy amounted to 95.64 seconds.
Among the four types of strategies, students consumed the most time per click on Socio-affective strategy buttons (1,306.85 seconds per click). Support strategies came in second (of 178.12 average), Problem-solving strategies the third (93.58 average), and Global strategies the last (70.75 average). The three individual strategies that students spent the most time per click were Music Box (an average of 2,191.09 seconds per click), Semantic Mapping (348.44 average), and Highlight (221.26 average). The three strategies that students spent the least time per click were Grammar (14.84 average), Prediction (16.73 average), and Summary (42.57 average).
Table 22 shows the average time that the High proficiency group and the Low proficiency group spent on each strategy button in reading the four articles. The High proficiency group, the most time-consuming strategy was Socio-affective strategies (an average of 1,389.21 seconds per click); the second was Support strategies (124.64 average); the third was Problem-solving strategies (119.55 average); and the last was Global strategies (56.33 average).
The Low proficiency group consumed the most amount of time on Socio-affective (an average of 1,252.9 seconds per click); the second was Support strategies (243 average); the third was Global strategies (90.63 average); and the last was Problem-solving strategies (61.27 average).
The results from t-test showed that the difference in the average time per click
spent by the High proficiency group and the Low proficiency group reached
significance level, with the Low proficiency group spending more time than the High
proficiency group (t = -3.18, p<0.05). When taking a closer look at the four strategy
Table 22. Time Spent on Each Strategy Button by the High and the Low Groups
High Group Low Group
Strategy Type
Button
Total Time
Total Click
Average Time Per Click
Total Time
Total Click
Average Time
Per Click
t
KW 4,450 73 60.96 5,879 35 167.97 -1.81*
PV 2,412 49 49.22 2,454 49 50.08 .14
PD 180 9 20.00 71 6 11.83 .95
OL 2,591 40 64.78 2,834 34 83.35 -.35
Global
ST 9,633 171 56.33 11,238 124 90.63 -1.43
SU 1,499 33 45.42 1,438 36 39.94 .25
SR 53 1 53.00 0 0 0.00 ---
PN 2,059 9 228.78 424 4 106.00 1.19
SM 2,486 8 310.75 650 1 650.00 ---
Problem -solving
ST 6,097 51 119.55 2,512 41 61.27 2.34**
16,080 134 120.00 27,066 112 241.66 -2.37**
DY TN GM
22,637 162
187 10
121.05 16.20
39,928 120
163 9
244.96 13.33
-3.85**
.45 HT 14,938 76 196.55 14,932 59 253.08 -.88
NB 776 31 25.03 5,676 18 315.33 -1.10
Support
ST 54,593 438 124.64 87,722 361 243.00 -4.50**
MB QN
49539 3,251
21 17
2,359 191.24
66,589 6,079
32 26
2,080 233.81
.54 -.41 Socio-
affective
ST 52,790 38 1,389.21 72,668 58 1252.9 .45 TOTAL 123,113 698 176.38 174,140 584 298.18 -3.18**
Note. KW=Keyword, PV=Preview, PD=Prediction, OL=Outline, SU=Summary, SR=Speed Reading, PN=Pronunciation, SM=Summary, DY=Dictionary, TN=Translation, GM=Grammar,
HT=Highlight, NB=Notebook, MB=Music Box, QN=Question, ST=Subtotal.
Units were counted by seconds.
** p<0.05, * p<0.1
types, it was found that the High proficiency group spent comparatively more time on
Problem-solving strategies than the Low proficiency group (t =2.34, p<0.05), whereas
the Low proficiency group spent relatively more time on Support strategies than the
High proficiency group (t = -4.50, p<0.05). A further look into each strategy button
showed that the Low proficiency group spent more time on Dictionary (t = -2.37, p<
0.05), Translation (t = -3.85, p<0.05), and Keyword (t = -1.81, p <0.05) than the High proficiency group did.
In summary, for all students, Socio-affective strategies demanded the most amount of time per click, followed by Support strategies, Problem-solving strategies, and Global strategies. In addition, Global strategies and Support strategies demanded more time for the Low proficiency group than the High proficiency group.
Problem-solving strategies and Socio-affective strategies demanded more time for the High proficiency group than the Low proficiency group did.
Strategy Button Sequence
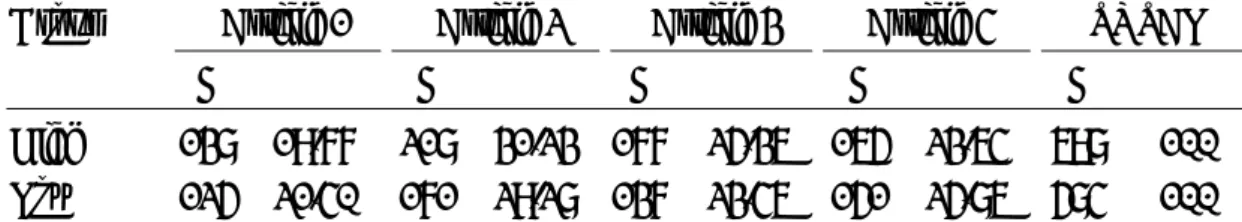
As mentioned in the Research Methodology section, the computer tracking system recorded the starting time when each strategy button was used. Each student’s strategy use sequence was determined by examining the computer record and sorting out the order in which each different strategy group was consulted. Table 23 shows a partial record of Student #2’s reading of Article 2.
Table 23. A Partial Record of Strategy Button Usage
Student # Article Starting Time Strategy group
2 2004/12/9 03:09:30 pm 3
2
2 2 2004/12/9 03:09:59 pm 3
2 2 2004/12/9 03:10:47 pm 3
2 2 2004/12/9 03:12:50 pm 1
2 2 2004/12/9 03:13:32 pm 3
2 2 2004/12/9 03:14:22 pm 3
2 2 2004/12/9 03:18:47 pm 1
2 2 2004/12/9 03:20:08 pm 1
2 2 2004/12/9 03:21:42 pm 4
2 2 2004/12/9 03:23:53 pm 1
2 2 2004/12/9 03:25:27 pm 2
2 2 2004/12/9 03:26:11 pm 3
Note. Strategy group 1=Global strategies; Strategy group 2= Problem-solving strategies; Strategy group 3=Support strategies; Strategy group 4=Socio-affective strategies.
It can be seen from Table 23 that Strategy Type 3 was used first, followed by Strategy Type 1, Strategy Type 4, and Strategy Type 2. The strategy use sequence was therefore coded as “3→1→4→2.” The click pattern for all students in reading four articles is shown in Appendix U.
Based on the aforementioned principles of sorting out strategy sequence, three patterns were found. First, among all students, Support strategies were generally used prior to Problem-solving strategies. Table 24 shows that among the cases that Support strategies and Problem-solving strategies were used in reading all four articles, 86.87% of the time students used Support strategies prior to Problem-solving strategies, whereas only 16.13% of the time they used Problem-solving strategies before Support strategies.
Table 24. Sequence of Support and Problem-Solving Strategy Use by All Students Support→Problem-solving Problem-solving→Support TOTAL
F % F % F %
52 86.87 10 16.13 62 100
The second pattern was that the text difficulty significantly triggered different strategy use sequence of Support and Socio-affective strategies (χ
2= 14.70, df=1, p=0.000). Table 25 shows that students used Support strategies followed by
Socio-affective strategies mostly in reading easy texts, whereas Socio-affective strategies were used prior to Support strategies when texts became difficult.
Table 25. Sequence of Support and Socio-Affective Strategy Use by All Students in Reading Easy and Difficult Texts
Easy Texts (Articles 1 & 2)
Difficult texts (Articles 3 and 4)
TOTAL Strategy sequence
F % F % F % Support→Socio-affective 37 68.52 17 31.48 54 100
Socio-affective→Support 3 16.67 15 83.33 18 100
The third pattern was that the sequence of Support and Socio-affective strategy
use was significantly different between the High and Low proficiency groups (χ
2= 29.805, df = 1, p=.000). Table 26 shows that the High proficiency group preferred the sequence of Global strategies followed by Support strategies, whereas the Low proficiency group favored the sequence of Support strategies followed by Global strategies.
Table 26. Sequence of Support and Global Strategy Use by the High and the Low Groups
High group Low group TOTAL Strategy sequence
F % F % F %
Global→Support 39 76.47 12 23.53 51 100
Support→Global 10 21.28 37 78.72 47 100
In conclusion, for all students, Support strategies were mostly used prior to Problem-solving strategies. However, different text difficulties resulted in different strategy sequences, with the use of Support strategies preceding Socio-affective strategies for the easy texts and Socio-affective strategies before Support strategies in reading difficult texts. Besides, students with different proficiency levels also used different strategy sequences, with the High proficiency group using Global strategies followed by Support strategies, whereas the Low proficiency group using Support strategies prior to Global strategies.
This section has presented the data of students’ use of fifteen strategy buttons in terms of frequencies and time. The next section will report on the data regarding the effects of strategy use on comprehension.
Relationships between Strategy Use and Recall Scores
This section focuses on the relationship between students’ strategy use and
reading comprehension. This study adopted the written recall protocol as the primary
tool to measure students’ comprehension. The scheme was completed by adapting
Johnson’s (1970) weighted propositional system and Goodman et al.’s (1987) holistic
scoring methods (see Chapter Three for details). For example, Article 1 on Nemo yielded 10 main ideas, 17 supporting ideas, and 41 details. As the weight of main ideas, supporting ideas, and details were 5, 3, and 1 respectively, the main idea scores, support idea scores, and detail scores for Article 1 were 50, 51, and 41 respectively, which came to a total of 142. The total score for each lesson and its branching idea scores, including the main idea, the supporting idea, and the detail are shown in Table 27.
Table 27. Total Score for the Scheme in Each Lesson
Main idea(×5) Supporting idea (×3) Detail (×1) Article
Unit Score Unit Score Unit Score Total
1 10 50 17 51 41 41 142
2 8 40 24 72 86 86 198
3 12 60 18 51 79 79 190
4 11 55 17 54 60 60 169
Each student’s recall protocol underwent the scoring process twice. The first time was to make sure students’ wording in their written recalls could be properly mapped against the schemes. After the first scoring, it was found that some of the students’
sentences could not be categorized; therefore, in the second time, the researcher went
back to the scheme and consulted the scheme raters. It was then decided an extra
category of “UC” (uncodable category) was added to include additional information
that was not mentioned in the text, inferences made by students, and students’ own
opinions. The scoring sample is shown in Appendix V. Although sentences without
categorization were not given any credits in their recall scores, the careful and
detailed labeling process helped to identify the relationship between students’ strategy
use and comprehension. One point worthy of our attention is that in the later part of
the regression analyses, because the four articles had different numbers of idea units
and therefore yielded different total scores, students’ recall scores were converted to
the percentage of raw scores from the total scores of the scheme (percentage score).
The act of converting students’ raw scores into percentage scores ensured that each lesson had a fair basis for comparison. The total scores and each idea unit ratings for the four articles has been shown in Table 27. For example, if a student’s raw score was 30 in Article 1, then his percentage score was 30/142. The full score was therefore 1 (100%). Table 28 shows that total recall scores of the High proficiency group and the Low proficient group. It was found that the High proficiency group recalled more than the Low proficiency group in reading these four articles. Both groups recalled more in reading easy texts (Articles 1 and 2) than in reading difficult texts (Articles 3 and 4).
Table 28. Recall Scores of the High and the Low Groups
Article Recall Score High Group Low Group Article 1 Raw
%
32.87 0.23
27.53 0.19 Article 2 Raw
%
35.69 0.18
31.65 0.16 Article 3 Raw
%
30.42 0.16
26.71 0.14 Article 4 Raw
%
19.33 0.11
15.08 0.09
Note. % = The student's raw score divided by the total score of the scheme.
The Regression Model
Two groups of students (a High proficiency group and a Low proficiency group)
were asked to read four articles in English Reading Online, where the students’ use of
the four types of strategies, including Global strategies (GLS), Problem-solving
strategies (PSS), Support strategies (SUS), and Socio-affective strategies (SOS) could
be tracked. The researcher was interested in whether the use of a particular type of
strategy influenced students’ scores in main ideas (M), details (D), and the total scores
(T) in each lesson. The possible relationship between types of strategy used and recall scores was explored using multiple regression analysis, with the percentage of strategy use as the independent variables (the predictor), and the recall scores as the dependent variable (the response). The strategy use was calculated by dividing the number of times students used a particular strategy by the total number of times students used reading strategies. The recall score was defined by the ratio of the raw score that a student received by the total score of the scheme.
The regression model was
Score=β
1GLS+β
2PSS+β
3SUS+β
4SOS where
1. β
1, β
2,β
3andβ
4were the regression coefficients for the predictors of four types of strategies—GLS, PSS, SUS, and SOS respectively.
2. GLS was Global strategies, PSS was Problem-solving strategies, SUS was Support strategies, and SOS was Socio-affective strategies.
3. The present study set the significance level at 0.05, and 0.1. In the case of p<0.05, the relationship between strategy use and recall scores was strongly suggested, while p<0.05~p<0.1 showed the evidence of the relationship to be significant.
4. The regression line indicated that a 1% strategy click increase was associated with an increase ofβ% of the recall scores.
Three sets of scores (total recall scores, recall scores on main ideas, and recall
scores on details) were investigated among the interaction of four articles and three
types of target groups (all students, the High proficiency group, and the Low
proficiency group). R-square (coefficient of determination) in this study ranged from
0.6 to 0.9 in the regression analysis, which indicated the model was well fit; that is,
the predictors explained the variation in the dependent variable very well. The
following results will be discussed in the order of how the use of strategies influenced total recall scores, scores on main ideas, and scores on details. Each type of scores will be interpreted from the combination of the student groups and articles.
The Total Recall Score
The influence of strategy use on students’ performance of the total recall score will be discussed pertaining to all students, the High proficiency group, and the Low proficiency group.
All Students
Table 29 summarizes the regression coefficients of the total score for all students reading the four articles. First, R-square in Article 1 was 0.8566, which meant the model was well fit. The regression line for all students reading Article 1 was Score=0.17GLS+0.26SUS. This means that students’ use of Support strategies and Global strategies in reading Article 1 had a significant impact on the gains of their total recall scores. In other words, a 1% Support strategy use increase was associated with an increase of 0.26% of the total recall scores (estimated coefficient=0.26), whereas per 1% increase of the Global strategy use corresponded to an increase of 0.17% of the total scores (estimated coefficient=0.17). The use of Support strategies was a stronger predictor than that of Global strategies though both of them significantly predicted the gains of total recall scores.
Similar tendencies could be found in Article 3 (The regression line was Score=
0.26GLS+0.18SUS) and Article 4 (The regression line was Score=
0.23GLS+0.11SUS) where the use of Global strategies and Support strategies
significantly predicted the gains of recall scores. However, in reading Article 2,
Support strategies were the only type of strategy that impacted students’ total recall
scores (Score= 0.18SUS).
Table 29. Summary of Regression Coefficients of the Total Score for All Students Reading Four Articles
Article Parameter Estimate (β) Probability (p)
Global strategy 0.1659* 0.0976
Problem-solving strategy 0.1431 0.3268 Support strategy 0.2559** <.0001 Socio-affective strategy 0.0278 0.8639 Article 1
Score=0.17GLS+0.26SUS; R-square=0.8566
Global strategy 0.0839 0.5187
Problem-solving strategy 0.2599 0.3006 Support strategy 0.1839** 0.0041 Socio-affective strategy 0.0056 0.9804 Article 2
Score=0.18SUS; R-square=0.6470
Global strategy 0.2610** 0.0111
Problem-solving strategy -0.0355 0.8218 Support strategy 0.1843** <.0001 Socio-affective strategy 0.1210 0.6523 Article 3
Score=0.26GLS+0.18SUS; R-square=0.8334
Global strategy 0.2289** 0.0091
Problem-solving strategy -0.1997 0.2975 Support strategy 0.1138** 0.0007 Socio-affective strategy 0.0406 0.7537 Article 4
Score=0.23GLS+0.11SUS; R-square=0.7446
Note. Parameter=reading strategy types
Estimate=the value of regression coefficient
** p<0.05, * p<0.1