THE APPLICATION OF COVARIANCE
STRUCTURE MODELTO THE STUDY
OF 1-MINUTE SIT-UPS TESTIN THE
FEMALE OF UNDERGRADUATES
Han-Dau Yau,
Dept. of Sports Training Science, National
College of Physical Education and Sports,
Taoyuan, Taiwan, ROC.
AIESEP-Ad
e
l
phi
’
98 World Sport Science
The application of covariance structure model to the study of 1-minute
sit-ups test in the female of undergraduates
Han-Dau Yau,
Dept. of Sports Training Science, National College of Physical Education and Sports, Taoyuan, Taiwan, ROC.
ABSTRACT
The logical validity of 1-minute sit-ups test is to measure the abdominal of strength and endurance. Base on the view of Psychometric: it can not clear
interpretation the muscle strength and muscle endurance. The purpose of this study was to the model tested with covariance structure models for the 1-minute sit-ups test. The subjects were 568 female of undergraduates in the National Taiwan University. The raw data coded the performance of every period of 5-seconds. Data were analyzed using the Statistical Analysis System's (SAS) CALIS procedure (SAS 6.11). The present analysis followed a two-step procedure based in part on an approach recommended by Anderson and Gerbing (1988). After the result was analyzed, the conclusion were the following: the strength was the performance of from 0 to 20 second period, and the endurance was the performance of from 45 to 60 second period in the 1-minute sit-ups test of female undergraduates, and that had good composite reliability, convergent validity and discriminant validity.
key words: sit-ups test; covariance structure model; physical fitness test; confirmatory factor analysis; linear structure relation;
INTRODUCTION
The 1-minute sit-ups test is to measure abdominal strength and endurance in AAHPERD Health-Related Physical Fitness Test (HRPFT). This test includes muscle strength and muscle endurance. That is two dimensions from measurement view.Suen (1990)”Variousaspectsofeducationaland psychologicaltestsand measurement procedures are studied in psychometrics. These include ..., how to interpretthesescores,”(p.40). Baseon Psychometricview:A good testmustbe clearly and precisely defined to a construct. If a test has two constructs (object of measurement). They are confusion by psychologists to explain some phenomenon. If a grade is good in 1-minute sit-ups test. We do not know: It is good muscle strength and good muscle endurance, or excellent muscle strength and average muscle endurance, or...., That is, the score of 1-minute sit-ups test can not judge the
performance of muscle strength or muscle endurance.
Baseon Safrit(1986)“Thevalidity ofthesit-ups test has not been clear established. ... Thus, the Modified Sit-ups Test is validated on the basis of logical validity”(p.240). This study will provide a empiricism validity. Wood (1989) also point“Linearstructuralequation modeling (also known ascovariancestructure modeling) is a series of multivariate statistical techniques that analyzes the
From the view of physiological basis: Wilmore and Costill (1988) defined out “(1)Strength refersto theability ofthemuscle,oragroup ofmuscles,to exertor apply force. (2) Muscle endurance refers to the ability of the muscle, or a group of muscles, to sustain repeated contractions, or to sustain a fixed or static contraction for an extended period of time. (3) Endurance can be assessed by a index of work decrement”(pp. 369-372). Hence, Yau (1997) studied “Thestudy of time setting for sit-upstestforundergraduates.” Analysiswasutilized for outcome(plot
performance & ANOVA) and internal correlation(exploratory factor analysis), and the conclusion was that the cutting point for time setting to measure the strength and endurance of muscle for the sit-ups test for undergraduates were 35 seconds. This pilot study verified the factors of measurement of muscle strength and muscle endurance in 1-minute sit-ups test. Furthermore, this study made a large collection of samples. This confirmatory factor analysis is used to test the fit of the theoretical model for 1-minute sit-ups test. Because of it had adequate samples for the
METHOD
The subjects were 568 female of undergraduates in the National Taiwan University. This study was to measure the 1-minute sit-ups test. The data were obtained for the performance of every period of 5-seconds. The data were analyzed using the Statistical Analysis System's (SAS) CALIS procedure (SAS Institute Inc., 1995. Release 6.11), and the models tested were covariance structure models with multiple indicators for all latent constructs. The present analysis followed a two-step procedure based in part on an approach recommended by Anderson and Gerbing (1988). In the first step, confirmatory factor analysis was used to develop a measurement model that demonstrated an acceptable fit to the data. In the second step, the measurement model was modified so that it came to represent the theoretical model of interest. This theoretical model was then tested and revised until a
theoretically meaningful and statistically acceptable model was found.
RESULTS
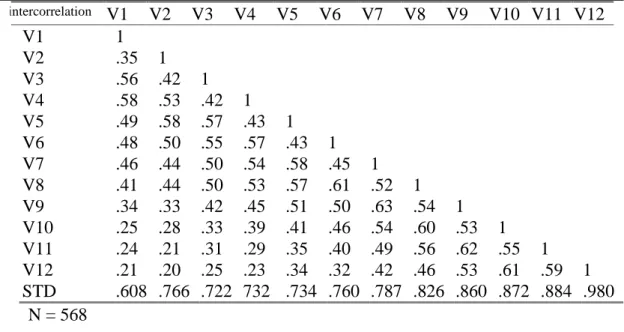
Table 1 Standard Deviations and Intercorrelations for 12 manifest variables Inintercorrelation V1 V2 V3 V4 V5 V6 V7 V8 V9 V10 V11 V12 V1 1 V2 .35 1 V3 .56 .42 1 V4 .58 .53 .42 1 V5 .49 .58 .57 .43 1 V6 .48 .50 .55 .57 .43 1 V7 .46 .44 .50 .54 .58 .45 1 V8 .41 .44 .50 .53 .57 .61 .52 1 V9 .34 .33 .42 .45 .51 .50 .63 .54 1 V10 .25 .28 .33 .39 .41 .46 .54 .60 .53 1 V11 .24 .21 .31 .29 .35 .40 .49 .56 .62 .55 1 V12 .21 .20 .25 .23 .34 .32 .42 .46 .53 .61 .59 1 STD .608 .766 .722 732 .734 .760 .787 .826 .860 .872 .884 .980 N = 568
The Initial Theoretical Model
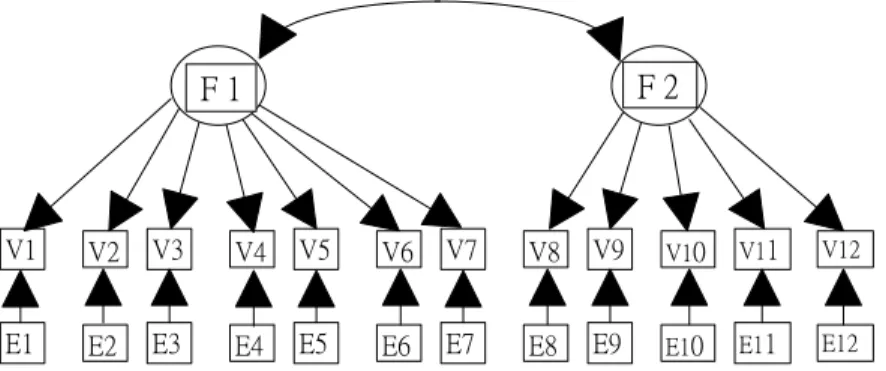
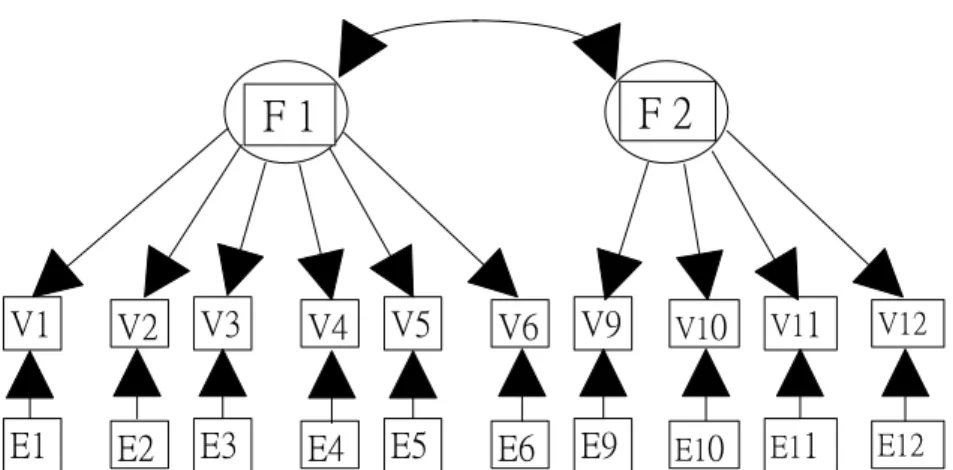
1endurance construct (F2) is measured by manifest variables V8 through V12. The letter“E”arerepresented theerrorofmeasurementto each manifestvariables.
F 1 F 2
V1 V2 V3 V4 V5 V6 V7 V8 V9 V10 V11 V12
E1 E2 E3 E4 E5 E6 E7 E8 E9 E10 E11 E12
Figure 1 The initial theoretical model of 1-minute sit-ups test
The initial measurement model
In the path analysis of 1-minute sit-ups test with latent variables, a measurement model describes the nature of the relationship between (a) the two latent variables, or factors, and (b) the twelve manifest indicator variables that measure those latent variables. The latent variables were muscle strength and muscle endurance. The muscle strength was measured by the indicator variables 1 through 7 (from 0 to 35 second period). The muscle endurance was measured by the indicator variables 8 through 12 (from 35 to 60 second period)2.
The initial structural model
connecting muscle strength factor (F1) to muscle endurance factor (F2).
Assessment of fit
This measurement model was estimated using the maximum likelihood method, and the chi-square value for the model was statistically significant,2(df = 53, N = 568 ) = 641.12, p < .05 (in table 2). Technically, when the proper assumptions are met, this chi-square statistic may be used to test the null hypothesis that the model fits the data. In practice, however, the statistic is very sensitive to sample size and departures from multivariate normality, and will very often result in the rejection of a well-fitting model. For this reason, it has been recommended that the model
chi-square statistic be used as a goodness of fit index, with smaller chi-square values (relative to the degrees of freedom, df ) indicative of a better model fit (Bentler & Bonett, 1980; James, Mulaik, & Brett, 1982; Jöreskog & Sörbom, 1989; Marsh, Balla, & McDonald, 1988; Marsh & Hocevar, 1985).
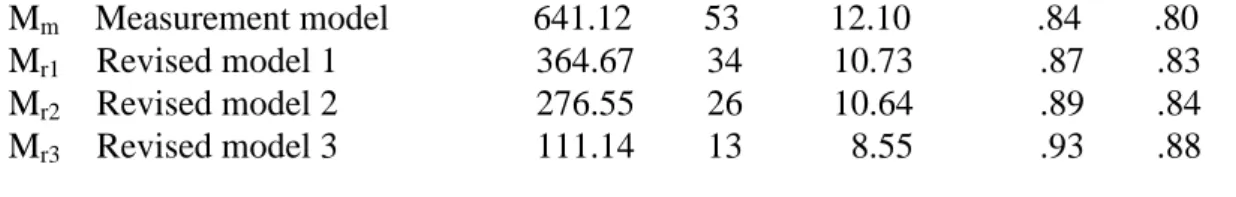
Table 2 Goodness of fit indices for the 1-minute sit-ups test measurement model study
measurement model Chi-square df chi-square/df CFI NNFI - ---Mm Measurement model 641.12 53 12.10 .84 .80 Mr1 Revised model 1 364.67 34 10.73 .87 .83 Mr2 Revised model 2 276.55 26 10.64 .89 .84 Mr3 Revised model 3 111.14 13 8.55 .93 .88
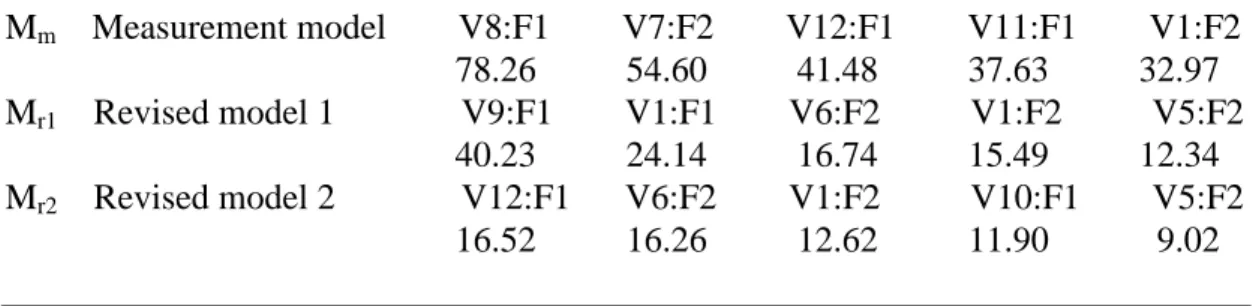
Table 3 The Gamma matrix of Lagrange multiplier test indices for the 1-minute sit-ups test measurement model study
measurement model Rank order of the largest Lagrange multipliers
--- ---Mm Measurement model V8:F1 V7:F2 V12:F1 V11:F1 V1:F2 78.26 54.60 41.48 37.63 32.97 Mr1 Revised model 1 V9:F1 V1:F1 V6:F2 V1:F2 V5:F2 40.23 24.14 16.74 15.49 12.34 Mr2 Revised model 2 V12:F1 V6:F2 V1:F2 V10:F1 V5:F2 16.52 16.26 12.62 11.90 9.02
A number of other results, however, indicated that there was a problem with the model’sfitin fact. Thechi-square / df ratio for this model is 12.10 (in table 2). Because of the ratio over 2.00 is generally considered larger and misfit. The
comparative fit index, or CFI (Bentler, 1989) and the non-normed fit index, or NNFI (Bentler & Bonett's, 1980) as overall goodness of fit indices. The values of CFI and NNFI are 0.84 and 0.80 for this study. Both indices are less than 0.90, indicating that the present model does not fit. In support of the model, the chi-square statistic, the chi-square / df ratio, the CFI, and the NNFI were all within a rejection range. This study decided for modifying the initial measurement model. The Gamma matrix of large Lagrange multiplier tests showed in table 3. The value of the Lagrange multiplier is 78.26 for the V8:F1 relationship. The means of model chi-square is expected to decrease by a value of 78.26 if you add a path from F1 (alternatives) to V8. That two manifest indicators, V7 (54.60) and V8, were
apparently causally affected by both the muscle strength construct (F1) as well as the muscle endurance construct (F2). Because V7 and V8 were apparently a
The revised measurement model 1
Goodness of fit indices for the revised measurement model 1 (Mr1) are presented
in table 2. The chi-square value of Mr1was statistically significant,2( df = 34 ) =
364.67, p < .05 . The chi-square / df ratio is 10.73. In addition, the values of CFI and NNFI are 0.87 and 0.83. These indices exceeded the criterion of an ideal fit for the measurement model. This study therefore modified the Mr1again. The
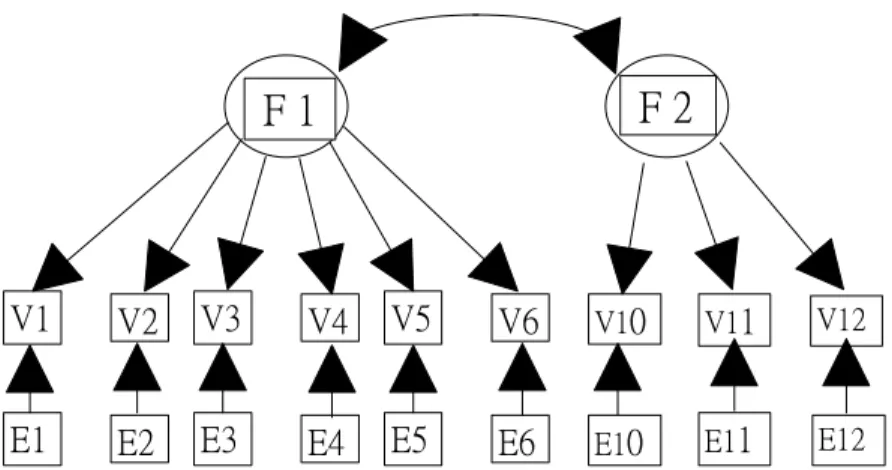
estimation of Lagrange multiplier test is 40.23 for the V9:F1 relationship in table 3. Because V9 was a multidimensional variable, we were eliminated from the Mr1, and
the Mr1was estimated again.
F 1
V9 V10 V11 V12 E9 E10 E11 E12 V1 V2 V3 V4 V5 V6 E1 E2 E3 E4 E5 E6F 2
Figure 2 The revised measurement model 1 of 1-minute sit-ups test
The revised measurement model 2
The goodness of fit indices for the revised measurement model 2 (Mr2) are
presented in table 2. The chi-square value of Mr2was statistically significant,2( df
There is a danger that data-driven model modifications will capitalize on chance characteristics of the sample data and result in a final model that will not generalize to the population or to other samples (MacCallum, Roznowski, & Necowitz, 1992). We therefore began the search by attempting to drop the reasonable of variable. The values of large Lagrange multiplier test choose the V6:F2 (16.26) and the V5:F2 (9.02) in table 3. Once again, we eliminated the V5 and V6 from the Mr2, and the Mr2was
estimated again.
F 1
V10 V11 V12 E10 E11 E12 V1 V2 V3 V4 V5 V6 E1 E2 E3 E4 E5 E6F 2
Figure 3 The revised measurement model 2 of 1-minute sit-ups test
The revised measurement model 3
The test of goodness of fit indices for the revised measurement model 3 (Mr3)
are presented in table 2. The chi-square value of Mr3was statistically significant,2
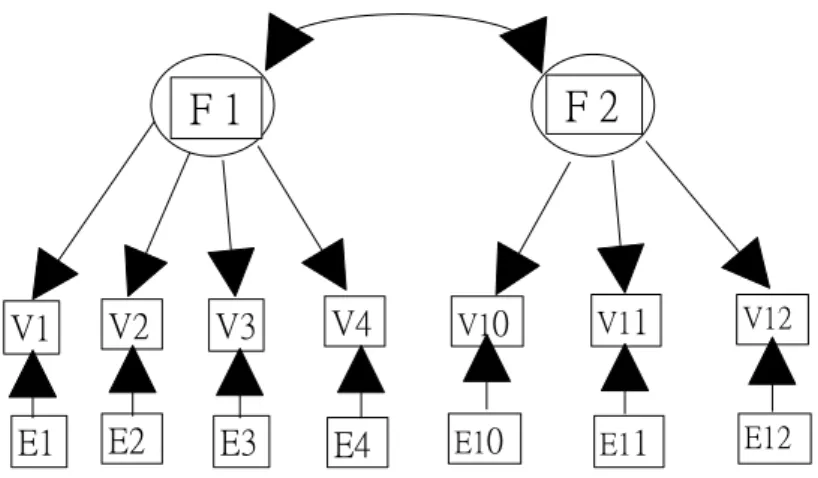
( df = 13 ) = 111.14, p < .05 . The chi-square / df ratio is 8.55. In other words, the values of CFI (0.93) exceeded 0.90 , the NNFI value (0.88) for this model was close to 0.90, indicating that the fit between Mr3and data could acceptable. Therefore,
model Mr3wastentatively accepted asthestudy’s“final”measurementmodel,and a
F 1
V10 V11 V12 E10 E11 E12 V1 V2 V3 V4 E1 E2 E3 E4F 2
Figure 4 The revised measurement model 3 of 1-minute sit-ups test
Standardized factor loading for the indicator variables are presented in Table 4. TheSAS system’sCALIS procedureprovidesapproximatestandard errorsforthese coefficients that allow large-sample t tests of the null hypothesis that the coefficients are equal to zero in the population. The t values obtained for the coefficients in Table 4 range from 14.28 through 19.66, indicating that all factor loadings were significant (p < .05). This finding provides evidence supporting the convergent validity4of the indicators (Anderson & Gerbing, 1988).
Table 4 The properties of the revised measurement model 3 for the 1-minute sit-ups test Variable Factor Standardized factor
loading
Table 4 also provides the reliabilities of the indicators (the square of the factor loadings), along with the composite reliability5or each construct. Composite reliability is a measure of internal consistency comparable to coefficient alpha (Fornell & Larcker, 1981). The composite reliability was 0.79 for F1, and was 0.81 for F2. The two factors demonstrated acceptable levels of reliability, with
coefficients in excess of 0.70. The sixth column of Table 4 provides the variance extracted estimate6or each factor. This is a measure of the amount of variance captured by a construct, relative to the variance due to random measurement error (Fornell & Larcker, 1981). The variance extracted estimates of F1 and F2 are 0.48 and 0.59. The constructs demonstrated variance extracted estimates were F1 approximately 0.50 and F2 excess 0.50, the level recommended by Fornell and Larcker (1981).
In this study, discriminant validity7would be demonstrated through the
chi-square difference test8, the confidence interval test, and the variance extracted test. When estimated, the unidimensional model(rF1F2=1) displayed a model chi-square of
453.48 with 14 df. The standard measurement model (in table 2) has already shown that the chi-square for that model was 111.14 with 13 df. We may now calculate the difference in chi-square between the two models: 453.48111.14 342.34. So the difference in chi-square was 342.34. The df for the test is found by subtracting the
df for two models: 1413 = 1 . Since our observed chi-square difference value was
distinctive but correlated constructs provided a fit that was significantly better than the fit provided by the unidimensional model (single factor). In short, this test supports the discriminant validity of F1 and F2.
The confidence interval test involves calculating a confidence interval of plus or minus 2 standard errors around the correlation between the factors, and determining whether this interval includes 1.0. If it does not include 1.0, discriminant validity is demonstrated (Anderson & Gerbing, 1988). The correlation between F1 and F2 is 0.498 , and the standard error for this estimate is 0.042 . To compute the confidence interval for this correlation, the first multiply this standard error by 2: 0.0422 = 0.084. The lower boundary for the confidence interval will be two standard errors below the correlation: 0.4980.084 = 0.414. The upper boundary for the confidence interval will be two standard errors above the correlation: 0.4980.084 = 0.582. So the confidence interval for the relationship between F1 and F2 ranges from 0.414 to 0.582. This confidence interval does not include the value of 1.0, meaning that it is very unlikely that the actual population correlation between F1 and F2 is 1.0. This fining supports the discriminant validity of the measures.
The variance extracted test, we review the variance extracted estimates (as described previously) for two factors of interest, and compare these estimates to the square of the correlation between the two factors. Discriminant validity is
for F1, and was 0.59 for F2. Because the variance extracted estimate for two factors were greater than the square of the interfactor correlation, this test succeeds to support the discriminant validity of the two factors.
Combined, these findings generally support the reliability and validity of the constructs and their indicators. The revised measurement model 3 (Mr3) was
thereforeretained asthestudy’sfinalmeasurementmodelagainstwhich othermodels would be compared.
CONCLUSION
The purposes of this study were to (1) The confirmatory analysis of 1-minute sit-ups test includes the components of strength and endurance of muscle. (2) An acceptable of revised model was provided to fit the data and interpret the scores of muscle strength and muscle endurance. The raw data coded the performance of every period of 5-seconds for 1-minute sit-ups test. The subjects were 568 female of undergraduates in the National Taiwan University. Because it has a sample of moderate size in this study. The final model was based on data-driven model modifications. Data were analyzed using the Statistical Analysis System's (SAS) CALIS procedure (SAS 6.11), and the models tested were covariance structure models with multiple indicators for all latent constructs.
recommended by Anderson and Gerbing (1988). In the first step, confirmatory factor analysis was used to develop a measurement model that demonstrated an acceptable fit to the data. In step two, the measurement model was modified so that it came to represent the theoretical model of interest. This theoretical model was then tested and revised until the revised measurement model 3 of 1-minute sit-ups test. It was a theoretically meaningful and statistically acceptable model. The composite reliability (identical coefficient alpha) was 0.79 for F1, and was 0.81 for F2. The variance extracted estimate (identical construct-related evidence of validity) was 0.48 for F1, and was 0.59 for F2. Standardized factor loading for the indicator variables were significant, and it were evidence supporting the convergent validity of the indicators. The chi-square difference test, the confidence interval test, and the variance extracted test were all demonstrated discriminant validity in this study. After the result was analyzed, the conclusion were the strength was the performance of from 0 to 20 second period, and the endurance was the performance of from 45 to 60 second period in the 1-minute sit-ups test of female undergraduates, and that had good internal consistency reliability, convergent validity and discriminant validity.
REFERENCES
Anderson, J. C., & Gerbing, D. W. (1988). Structural equation modeling in practice: A review and recommended two-step approach. Psychological Bulletin, 103, 411-423.
BMDP Statistical Software.
Bentler, P. M., & Bonett, D. G. (1980). Significance tests and goodness-of-fit in the analysis of covariance structure. Psychological Bulletin, 88, 588-606.
Campbell, D. T., & Fiske, D. W. (1959). Convergent and discriminant validation by the multitrait-multimethod matrix. Psychological Bulletin, 56, 81-105.
Fornell, C., & Larcker, D. F. (1981). Evaluating structure equation models with unobservable variables and measurement error. Journal of Marketing Research,
18, 39-50.
Hatcher, L. (1994). A step-by-step approach to using the SAS system for factor
analysis and structural equation modeling. Cary, N.C: Statistical Analysis System
(SAS) Institute Inc.
James, L. R., Mulaik, S. A., & Brett, J. M. (1982). Causal analysis. Beverly Hills: Sage.
Jöreskog, K. G., & Sörbom, D. (1989). LISREL 7: A guide to the program and
applications, 2nd edition. Chicago: SPSS Inc.
Long, J. S. (1983). confirmatory factor analysis: A preface to LISREL. Sage University Paper Series on Quantitative Application in the Social Sciences, 07-033. Beverly Hills: Sage.
MacCallum, R. C., Roznowski, M., & Necowitz, L. B. (1992). Model modification in covariance structure analysis: The problem of capitalization on chance.
Psychological Bulletin, 111, 490-504.
Marsh, H. W., Balla, J. R., & McDonald, R. P. (1988). Goodness-of-fit indexes in confirmatory factor analysis: The effect of sample size. Psychological Bulletin,
103, 391-410.
to the study of self-concept: First and higher order factor structures and their invariance across age groups. Psychological Bulletin, 97, 562-582.
Safrit, M. J. (1986). Introduction to measurement in physical education and exercise
science. St. Louis: Times Mirror / Mosby.
SAS Institute Inc. (1995). SAS/STAT Release 6.11. Cary, N.C: Statistical Analysis System (SAS) Institute Inc.
Suen, H. K. (1990). Principles of test theories. Hillsdale, NJ: Lawrence Erlbaum Associates.
Wilmore, J. H., & Costill, D. L. (1988). Training for sport and activity the
physiological basis of the conditioning process (3rd ed.). Dubuque, Iowa: Wm. C.
Brown.
Wood, T. M. (1989). The changing nature of norm-referenced validity. In M. J. Safrit, & T. M. Wood, (Ed.), Measurement concepts in physical education and
exercise science. Champaign, IL: Human Kinetics.
Yau, H.D. (1997). The study of time setting for sit-ups test for undergraduates. Chinese Taipei University Sports Federation Proceeding of Conference on Physical Education and Sports 1997. 198-210.
NOTES
p. 256)
2. Based on Yau, (1997): The study of time setting for sit-ups test for undergraduates. It was to the exploratory analysis of time setting that the sit-ups test measured the components of strength and endurance of muscle for undergraduates. The conclusion was that the cutting point for time setting to measure the strength and endurance of muscle for the sit-ups test for undergraduates were 35 seconds. 3. One of the most important advantages offered by latent-variable analyses is the
opportunity that they provide to assess the reliability and validity ofthestudy’s variables. Broadly speaking, reliability refers to consistency of measurement. Validity, on the other hand, refers to the extent to which an instrument measures what it is intended to measure. The CALIS procedure can be used to assess item reliability, composite reliability, variance extracted estimates, convergent validity, and discriminant validity. Combined, these procedures provide evidence
concerning the extent to which the indicators used in the study are producing reliable data and are measuring what they are intended to measure. (Hatcher, 1994. p. 325)
4. Convergent validity and Discriminant validity are usually associated with use of the multitrait-multimethod (MTMM) approach to validation (Campbell & Fiske, 1959) in which multiple constructs are each assessed using more than one assessment method. Convergent validity is demonstrated when different instruments are used to measure the same construct, and scores from these different instruments are strongly correlated. (Hatcher, 1994. pp. 331-332)
6. The variance extracted estimate assesses the amount of variance that is captured by an underlying factor in relation to the amount of variance due to measurement error. (Hatcher, 1994. P. 331)
7. Discriminant validity is demonstrated when different instruments are used to measure the different constructs, and the correlations between the measure of these different constructs are relatively weak. A test displays discriminant validity when it is demonstrated that the test does not measure a construct that it was not designed to measure. (Hatcher, 1994. p. 332)