行政院國家科學委員會補助專題研究計畫成果報告
※※※※※※※※※※※※※※※※※※※※※※※※※
※
停經憂鬱症婦女之腦血流及多巴銨受體功能檢查(1/3)
※
※
Functional brain evaluation with Tc-99m HMPAO SPECT
※
※
and I-123 IBZM SPECT in postmenopausal depression
※
※※※※※※※※※※※※※※※※※※※※※※※※※
計畫類別:■個別型計畫 □整合型計畫
計畫編號:NSC89-2320-B-006-001-M08
執行期間:88 年 08 月 01 日至 89 年 07 月 31 日
計畫主持人:
姚維仁
共同主持人:陳純誠、黃國恩、王新台、游一龍
本成果報告包括以下應繳交之附件:
□赴國外出差或研習心得報告一份
□赴大陸地區出差或研習心得報告一份
□出席國際學術會議心得報告及發表之論文各一份
□國際合作研究計畫國外研究報告書一份
執行單位:國立成功大學醫學系核子醫學科
中 華 民 國八十九年 十 月 三十日
中文摘要: 本計劃為三年期連續性計劃,結合核子醫 學、婦產科、精神科與流行病學專家,利 用 Tc-99m HMPAO 單光子電腦斷層掃瞄 探討停經婦女憂鬱症的病理生理機制。在 第一年中,我們檢查了 20 位疑似有憂鬱症 的停經後婦女,年齡在 40-60 歲(平均 51 歲)。每位均偵測血中 E2 及 FSH 濃度,以 確定其停經狀態。每位均接受醫院焦慮及 憂鬱測試(HAD)及認知功能測試(MMSE) 並接受兩次 TC-99m HMPAO SPECT; 第 一 次 為 偵 測 基 礎 腦 血 流 , 隔 周 再 運 用 WCST-CV2 測試其額葉血流增高情形。我 們以手繪額葉與小腦比值作為額葉腦血流 半定量分析,每位並接受磁振造影以偵測 有無結構異常。一共有十七位完成全部檢 查,其中五位患有憂鬱症狀(憂鬱分數大於 11 分)。屬憂鬱症狀者,其認知功能偏低 ( 8 6 . 2 % 比 9 4 . 0 % ) , 但 無 統 計 差 異 (P=0.095)。在基礎 Tc-99m HMPAO 腦血 流檢查中,憂鬱組與非憂慮組之額葉血流 並無差異(額葉/小腦比為 0.87 ±0.05 及 0.86 ±0.07),在激化額葉後之腦血流變 化 , 在 非 憂 鬱 組 腦 血 流 增 加 ( 6 . 4 6 ± 7 . 8 5 % ) , 在 憂 鬱 組 反 而 減 少 (- 1 .6 5 ± 6.46%)。然而兩組差別並未達統計意義 (P=0.061)。額葉/小腦比與憂鬱症狀嚴 重程度亦無相關(r = 0.12,P=0.464);此結果 異於過去在憂鬱症之腦血流變化,顯示停 經 後 婦 女 憂 鬱 症 或 許 有 不 同 之 機 轉 。 關鍵詞:停經,憂鬱症,腦血流,單光子 電腦斷層掃瞄
Abstract
Purpose: This is a three-year project.
We combined the experts and scholars in nuclear medicine, gynecology, psychiatry, and epidimiology to investigate the
underlying pathophysiology of post-menopausal depression with Tc-99m HMPAO and I-123 IBZM SPECT.
Patients: 20 women, aged 40-60 years
(mean = 51 ), with post-menopausal syndrome were included in this study. 17 women had completed all the tests. Serum E2 and FSH levels were determined to ensure post-menopausal status. Methods:
Each patient received Hospital Anxiety and Depression test (HAD) and Mini-Mental Status Examination (MMSE) to determine their level of anxiety and depression and to test their cognitive functions, respectively. The first Tc-99m HMPAO SPECT was designed to obtain the baseline cerebral blood flow. The second Tc-99m HMPAO SPECT was performed one week apart to detect changes of cerebral blood flow after frontal activation using WCST-CV2 test. Brain MRI was performed for each patient.
Results: Five patients were determined to
have depressive disorders (as defined by a depression score of 11 or more). Patients with depression scored lower on MMSE than those without depression (86.2% vs. 94.0%, P-value = 0.095). However , it did not reach statistical significance. There were also no significant difference of frontal/cerebellum ratio between depression and non-depression groups in both baseline and activation studies (0.87 ±0.05 vs. 0.86 ±0.07 in baseline, and 0.86 ±0.05 vs. 0.92 ± 0.08 in activation, respectively). The cerebral flow was increased after activation (6.46 ± 7.85%) in non-depression group, while in depression group the mean flow change was decreased (-1.65 ± 6.46%) .
However it did not reach statistical significance (P=0.061). There was no correlation between frontal/cerebellum ratio and severity of clinical symptoms(r = 0.12,P=0.464). No structural abnormalities on MRI can be identified in both groups.
Conclusion: On the contrary to previous
function brain Tc-99m HMPAO SPECT studies, we found no significant difference of frontal activity in postmenopausal depressive women. A different mechanism of cerebral blood flow change regulated by estrogen deficiency could be involved in post-menopausal depression.
Keywords: menopause, depression,
cerebral blood flow, SPECT
Background and Purpose
Depression is a major health concern not only because of personal distress, excess mortality, impaired interpersonal relationships, and restriction of work activities but also because of the economic burden it imposes. The relation between menopause and depression remained uncertain and may be due to biological, psychological or environmental effect. The biological hypothesis is estrogen deficiency resulting from cessation of menstruation causes increased vasomotor and somatic symptoms or changes in the elevation of neurochemicals such as plasma serotonin, tryptophan and their metabolites (5-Hydroxyindoleacetic acid, and MHPG) that could result in increased likelihood of depression. It is a major advance for clinical psychiatry that mental states can increasingly be related to underlying brain
states by use of available measures of regional brain function. Functional brain imaging with cerebral blood flow agent, such as HMPAO SPECT, permit noninvasive measurements of neurophysiology and is a powerful and sensitive tool for research aimed at elucidating the pathophysiology of depressive disorders. SPECT with Tc-99m HMPAO has been used to study several neuropsychiatric disorders, including primary and secondary depression. The depressive disorders appear particularly tractable to functional imaging approaches aimed at elucidating their pathophysiology because they have been associated with disruptions of brain function in the absence of gross neuropathology. Previous studies in severe depressive illness have shown a small but significant decrease in brain metabolism or blood flow in the dorsolateral prefrontal cortex, thalamus, caudate nucleus and orbitofrontal cortex. However, little attention has been given to patients with postmenopausal depression. In this study we hypothesized that there will be areas of regional cerebral dysfunction, detected by Tc-99m HMPAO SPECT, unique to the depressed group and that the magnitude of cerebral dysfunction in depressives is proportional to the severity of clinical scoring and MRI findings.
Patients and methods:
Twenty postmenopausal women, aged 40-60 years (mean 51 years) suspected to have depression clinically were referred from Department of Obstetric and
Gynecology at National Cheng-Kung University Hospital. Patients with a history of seizure disorder, major head trauma, cerebral vascular disease, cardiovascular disease, or a neurological disorder were excluded. Patients receiving a neuroleptic, analeptic or anticonvulsant drugs were also excluded. Serum E2 and FSH levels were determined to ensure post-menopausal status. Each patient received Hospital Anxiety and Depression test (HAD) and Mini-Mental Status Examination (MMSE) to determine their level of anxiety and depression and to test their cognitive functions, respectively. The first Tc-99m HMPAO SPECT was designed to obtain the baseline cerebral blood flow. The second Tc-99m HMPAO SPECT was performed one week apart to detect changes of cerebral blood flow after frontal activation using WCST-CV2 test. Brain MRI was performed for each patient. Among 20 menopausal women, 17 had completed all tests and were included for analysis.
Brain SPECT Imaging
In baseline study, all subjects were studied between 8:30 and 10:30 while they are recumbent in a quiet, darkened room with their eyes open and ears unoccluded. Each subject were injected intravenously with 74 MBq (20 mCi) of Tc-99m HMPAO (hexamethyl propylene amine oxyme) from an antecubital vein in a quiet environment about 10 minutes after setting of an intravenous line. Imaging was initiated approximately 20 minutes later. We used a triple-headed rotating gamma camera
(Multispect3, Siemens) with ultra high-resolution fan-beam collimators, which yields an image resolution of approximately 8.5 mm FWHM. The SPECT data were acquired over a circular 360o rotation, 120 steps, 30 seconds per step, in a 128 x 128 x 16 matrix, then were processed by filtered back projection with Butterworth and Ramp filters to reconstruct the transverse, coronal and sagittal images. The Chang method of attenuation correction was employed. The reconstructed transverse images will be aligned parallel to the canthomeatal (CM) line. The slice thickness of each transverse image is 2.89 mm.
Interpretation
Visual analysis
A visual examination of each subject’s scans was performed by a nuclear medicine specialist who is expert in SPECT imaging and who has no prior knowledge of the diagnosis. The digital images in the transaxial, sagittal and coronal planes were displayed on the monitor. The 3D-surface/-volume rendering and bull eye’s map were provided for comparison and ROI function for further quantitation.
Semi-quantitative Analysis of Brain SPECT Image
Automatic ROIs: Total six transverse images, at 2 pixels below mid-thalamus level, mid-thalamus level, 2, 4, 6 and 8 pixels above mid-thalamus level, were selected for analysis of cortical regions-of-interest (ROIs). We used a computer program to automatically define the cortical
ROIs. The outer cortical border was demarcated by a threshold value, defined as 50% of the maximal counts of the section being analyzed. The inner cortical border was 8 pixels (23.18 mm) radially inward from the outer cortical border. Then, on each transverse image the annular area were divided equally into twelve 15o sectors from the 12 o’clock position. Therefore, there were twelve cortical ROIs on each transverse image. These ROIs were labeled separately for right and left side of the cortical regions, each side with 6 cortical regions numbering from anterior to posterior regions of the brain. For example, ROI 1 through 6 represents medial frontal, lateral frontal, temporal, superior temporal, parietal, and occipital regions, respectively. The mean count density of each ROI was determined. Because the mean count density of ROI represents the degree of tracer uptake in the region, it is a marker of relative regional cerebral blood flow (rCBF). For semiquantitavie analysis of brain SPECT images, rCBF in each ROI was expressed by normalizing the mean count densities to cerebellar cortical reference region. The cortical cerebellar region was drawn manually.
Manual ROIs: Two sets of six transverse images were composited for frontal and cerebellum ROIs. Areas of frontal ROI and cerebellum ROI were drawn manually to best fit the ROIs unique to each patient.
MRI of the brain
MRI of the brain was done to identify
brain atrophy or any focal lesion and serve as the basis of elastic 3-D registration.
Results:
The average score in 17 patients was 8.9 ± 4.2 on anxiety and 7.2 ± 4.1 on depression. Seven patients were determined to have anxiety (as defined by an anxiety score of 11 or more) and 5 patients with depression (as defined by a depression score of 11 or more). There was no age difference between patients with depression (49.8 ± 5.2 years) and patients without depression (51.5 ±6.5 years). Patients with depression scored significantly lower on MMSE than those without depression (86.2% vs. 94.0%) (P-value = 0.095). In automatic ROI analysis of both baseline and activation Tc-99m HMPAO SPECT, no abnormal regional cerebral flow can be visualized in both groups. (Table 1) In manual ROI analysis, the frontal/cerebellum ratio in baseline Tc-99m HMPAO SPECT was 0.86 ±0.07, and 0.90 ± 0.07 upon activation in all 17 women. There were no significant difference of frontal/cerebellum ratio between depression and non-depression groups in both baseline and activation studies (0.87 ±0.05 vs. 0.86 ±0.07 in baseline, and 0.86 ± 0.05 vs. 0.92 ± 0.08 in activation, respectively). (Table 2) There was no correlation between frontal/cerebellum ratio and severity of clinical symptoms. No structural abnormalities on MRI can be identified in both groups.
Discussion:
Hypofrontalis and / or poor frontal activation relative to controls has been reported with cerebral flow SPECT in major depression.However, the current study showed no significant difference of frontal activity, both in baseline and after activation, between depression and non-depression groups in post-menopausal women. Different mechanism of cerebral blood flow changes may be involved between depressive patients in pre-menopausal and post-menopausal women.
Since frontal lobe is a complex cortical area, hypofrontalis is not a specific finding solely for major depression. Many other psychiatric disorders, such as schizophrenia and frontotemporal dementia, and structure abnormalities, such as Pick’s disease, are correlated with decreased blood flow in frontal lobe. In this study, we showed that scores of cognitive function may play a role in the activation of frontal blood flow, which may cause difficulty in evaluation of frontal flow changes in depression.
In addition, the small sample size, subtle difference, and heterogeneity of patients may account for this insignificance.
The first difficulty we have faced is the question of the existence of a menopause-related affective disorder. Studies of menopause and depression have been problematic because of variable definitions of menopause and depression. Extensive reviews have been completed by Morse, Ballinger, and Schmidt and Rubinow. Ballinger concluded that the evidence is not clear whether there is an affective disorder
of any severity that is necessarily related to the menopausal years.Schmidt and Rubinow believe that although the evidence for increased rates of major depression at menopause is lacking, there appears to be a psychological syndrome (symptoms of more minor severity) during the perimenopausal years.
As in most functional imaging studies of depression, this study involves relatively small sample size. This design limitation coupled with the subtle magnitude for the cerebral blood flow differences between depressives and controls relative to the variability of such measures reduces the sensitivity of studies for detecting intergroup differences and for replicating findings across studies. Consequently, subject selection criteria that reduce the variability of imaging measures are often required to improve statistical sensitivity. In the future, we will study more postmenopausal women for more detailed analysis.
Another difficulty is the clinical heterogeneity inherent within the depressive syndrome, as diverse signs and symptoms may have distinct neurophysiological correlates. For example, a depressed patient exhibiting prominent anxiety, obsessive ruminations, insomnia, and psychomotor agitation may show dissimilar imaging findings from one who predominantly manifests apathy, inactivity, excessive sleep, and psychomotor slowing.
In conclusion, we found no significant decrease of frontal cerebral blood flow, both in baseline and after activation, in post-menopausal depressive women. A different
mechanism of cerebral blood flow change regulated by estrogen deficiency could be involved in post-menopausal depression. Further analysis of more detailed regions (medial, lateral, orbital, and dorsal frontal areas) with MRI registration will be performed and clinical factors correlated with depressives will be sort out for the relative contributions of each factor to the variability of imaging measures.
References
1. Meagher d, Murray D. Depression. The Lancet 1997; 349: 117-120.
2. Ballinger C.B. Psychiatric Aspects of the Menopause. British Journal of Psychiatry 1990; 156: 773-787.
3. Morse CA. Menopausal mood disorders. Compreh Ther 1989;15:22-7.
4. Ballinger CB. Psychiatric aspects of the menopause. Br J psychiatry 1990; l56;773-87.
5. Halbreich U. Role of estrogen in postmenopausal depression. Neurology 1997, 48(5 Suppl 7) :S16-9.
6. Galynker II, Cai J, Ongseng F, Finestone H, Dutta E, Serseni D. Hypofrontality and negative symptoms in major depressive disorder. J Nucl Med. 1998; 39(4):608-12. 7. Abou-Saleh MT, Al Suhaili AR, Karim L,
Prais V, Hamdi E. Single photon emission tomography with 99m Tc-HMPAO in Arab patients with depression. J Affect Disord. 1999 Oct;55(2-3):115-23.
8. Kowatch RA, Devous MD Sr, Harvey DC, Mayes TL, Trivedi MH, Emslie GJ, Weinberg WA. A SPECT HMPAO study of regional cerebral blood flow in depressed adolescents and normal controls. Prog Neuropsychopharmacol Biol Psychiatry. 1999 May; 23(4):643-56. 9. Kanaya T, Yonekawa M. Regional
cerebral blood flow in depression. Jpn J Psychiatry Neurol. 1990 Sep;44(3):571-6. 10. Kocmur M, Milcinski M, Budihna NV.
Evaluation of brain perfusion with technetium-99m bicisate single-photon emission tomography in patients with depressive disorder before and after drug treatment. Eur J Nucl Med. 1998 Oct; 25(10):1412-4.
11. Yazici KM, Kapucu O, Erbas B, Varoglu E, Gulec C, Bekdik CF. Assessment of changes in regional cerebral blood flow in patients with major depression using the 99mTc-HMPAO single photon emission tomography method. Eur J Nucl Med. 1992; 19(12):1038-43.
Table 1. Automatic cortical/cerebellum ratio in baseline & activation Tc-99m HMPAO SPECT in depression and non-depression women.
Cortical/cerebellum ratio Depression (n=5)
Non-depression (n=12)
Mean SD Mean SD P-value Right ROI 1: Baseline
Activation 0.95 0.98 0.07 0.03 0.97 0.94 0.08 0.06 0.679 0.237 Right ROI 2: Baseline
Activation 0.95 1.02 0.09 0.06 1.00 0.97 0.07 0.07 0.330 0.259 Right ROI 3: Baseline
Activation 1.02 1.02 0.07 0.04 1.03 1.01 0.07 0.06 0.787 0.827 Right ROI 4: Baseline
Activation 0.89 0.91 0.06 0.07 0.97 0.96 0.05 0.06 0.049* 0.252 Right ROI 5: Baseline
Activation 0.87 0.88 0.06 0.05 0.90 0.87 0.06 0.05 0.504 0.735 Right ROI 6: Baseline
Activation 1.00 1.01 0.06 0.05 1.01 1.00 0.08 0.03 0.856 0.730 Left ROI 1: Baseline
Activation 0.95 0.96 0.05 0.05 0.95 0.91 0.07 0.06 0.906 0.204 Left ROI 2: Baseline
Activation 0.91 0.94 0.04 0.05 0.94 0.90 0.08 0.05 0.538 0.199 Left ROI 3: Baseline
Activation 0.97 0.93 0.04 0.08 0.98 0.95 0.06 0.02 0.723 0.675 Left ROI 4: Baseline
Activation 0.92 0.92 0.05 0.05 0.96 0.94 0.07 0.03 0.450 0.539 Left ROI 5: Baseline
Activation 0.93 0.91 0.06 0.02 0.94 0.92 0.08 0.06 0.781 0.664 Left ROI 6: Baseline
Activation 1.02 1.02 0.06 0.06 1.01 1.00 0.12 0.07 0.929 0.761
Table 2. Frontal/cerebellum ratio in baseline & activation Tc-99m HMPAO SPECT in depression and non-depression women.
Depression (n=5)
Non-depression (n=12)
Mean SD Mean SD P-value Baseline 0.87 0.05 0.86 0.07 0.782 Activation 0.86 0.05 0.92 0.08 0.139 ﹪of increase -1.65 6.46 6.46 7.85 0.061
Table 3. Frontal/cerebellum ratio in baseline & activation Tc-99m HMPAO SPECT in anxiety and non-anxiety women.
Anxiety (n=7)
Non-anxiety (n=10)
Mean SD Mean SD P-value Baseline 0.87 0.05 0.86 0.08 0.741 Activation 0.92 0.08 0.88 0.07 0.381 ﹪of increase 5.42 9.99 3.13 7.12 0.588
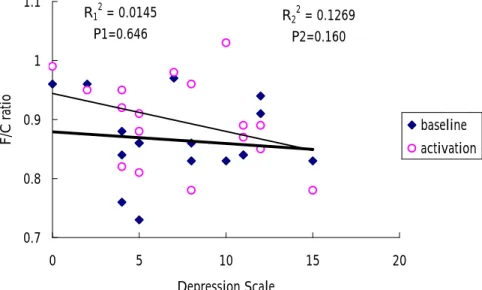
R1 2 = 0.0188 P1=0.600 R22 = 0.0025 P2=0.850 0.7 0.8 0.9 1 1.1 F/C ratio baseline activation R2 = 0.0069 P=0.752 -15 -10 -5 0 5 10 15 20 25 30 ﹪ increase of F/C ratio R12 = 0.0145 P1=0.646 R22 = 0.1269 P2=0.160 0.7 0.8 0.9 1 1.1 0 5 10 15 20 Depression Scale
F/C ratio baselineactivation
R2 = 0.0665 P=0.318 -15 -10 -5 0 5 10 15 20 25 30 0 5 10 15 20 Depression Scale ﹪ increase of F/C ratio
Fig 1.Correlation of frontal/cerebellum ratio(F/C ratio) in baseline and activation Tc-99m HMPAO SPECT with depression scale
Fig 3. Correlation of ﹪increase of F/C ratio with depression scale
Fig 2. Correlation of frontal/cerebellum ratio(F/C ratio) in baseline and activation Tc-99m HMPAO SPECT with anxiety scale
Fig 4. Correlation of ﹪increase of F/C ratio with anxiety scale
R12 = 0.0056 P1=0.775 R22 = 0.1926 P2=0.078 0.7 0.8 0.9 1 1.1 20 22 24 26 28 30 MMSE Scale F/C ratio baseline activation R2 = 0.1637 P=0.107 -15 -10 -5 0 5 10 15 20 25 30 20 22 24 26 28 30 MMSE Scale ﹪ increase of F/C ratio
Fig 5. Correlation of F/C ratio in baseline and activation Tc-99m HMPAO SPECT with MMSE scale
Fig 6. Correlation of ﹪increase of F/C ratio with MMSE scale