• 沒有找到結果。

Sex Differences in Smoking Behavior Trajectory Patterns and Related Factors Among Older Adults in Taiwan

N/A
N/A
Protected

Academic year: 2021

Share "Sex Differences in Smoking Behavior Trajectory Patterns and Related Factors Among Older Adults in Taiwan"

Copied!
21
0
0

加載中.... (立即查看全文)

全文

(1)

Gender differences in smoking behavior trajectory patterns and related factors among older adults in Taiwan

Abstract

Background: Smoking behavior changes over time in old age, and smoking patterns differ by gender and age. However, the gender stratified smoking trajectories of older adults are not often examined. The purpose of this study was to examine the smoking trajectories of older adults and their associated factors by gender. Methods: Data were drawn from a nationally representative longitudinal study of a sample of Taiwanese adults aged 50 to 66 (n=2,097). The samples were followed from 1996 to 2007. Group-based trajectory analysis was used. Results: Three smoking trajectories were identified in men: non/rare smokers (42.6%), quitting smokers (16.5%), and chronic smokers (40.9%). The male quitting smokers were more likely to be lower educated than the male non/rare smokers. The male chronic smokers were more likely to be older, lower educated, and living in rural areas than the male non/rare smokers.

Two smoking trajectories were identified for females: non/rare smokers (95.9%) and smokers (4.1%). Females of mainlander ethnic groups were more likely to be

smokers. Conclusions: There are gender differences in the smoking trajectories and related factors of older adults. Tobacco control programs should be sensitive to the gender of the target population.

Keywords: gender difference, group-based trajectories, smoking,

(2)

Introduction

Smoking has major mortality and morbidity risks as well as numerous potential medical consequences.

1-3

Smoking also causes poorer health-related quality of life

4

and increases the risk of dementia among the elderly.

5,6

Health promotion research has focused on changes in smoking behavior and related factors, and different trajectories of smoking behaviors have been examined in adolescent populations,

7-10

but not often in the elderly. Older adults are more likely to quit smoking than to start smoking as they age,

11

usually due to health problems.

12,13

Nevertheless, only a few studies have examined the heterogeneity in long-term trajectories of smoking behavior among adults.

14,15

To our knowledge, the trajectories of smoking behavior among the elderly have not yet been examined.

Gender differences have been identified in smoking and quitting behaviors, but the findings are mixed. Most studies have shown that males smoke more than

females,

16-20

including Taiwan.

20

The smoking prevalence of female aged 55 and more is less than male.

20

The prevalence of smoking usually declines over time among men but does not necessarily decline in women.

21-23

Regarding smoking cessation, most research has found higher cessation rates for males than for females, where this is also true for elderly individuals

24,25

Other studies, however, have found no gender

differences in the smoking cessation rate

17

or have found a higher rate among elderly women than among elderly men.

26

Two hypotheses have been proposed to explain gender differences in smoking behavior.

27

One hypothesis, related to “gender equality and independence among women”, suggests that women’s improved status

contributed to their adoption of male smoking behaviors. The other hypothesis

involves the concept of ‘cigarette diffusion’, derived from ‘model of the cigarette

(3)

epidemic’, proposes that women were later cigarette adaptors than men. However, the factors related to gender differences in smoking behavior have not yet been

thoroughly examined.

In this study, we identified trajectories of smoking behavior during an 11-year follow-up study of individuals in late adulthood and examined the factors correlated with these trajectories stratified by gender. The group-based trajectory analysis was used to identify the smoking trajectories for males and females.

28

Materials and Methods

Participants and Procedures

Data were drawn from the “Taiwan Longitudinal Survey on Aging (TLSA)”, a nationally representative longitudinal survey first conducted in 1989 and repeated every 3 or 4 years. A three-stage proportional-to-size probability sampling technique was used. Face-to-face interviews were conducted with a random sample of

individuals (aged > 60 years) taken from the entire elderly population of Taiwan. A supplemental sample of 2,462 persons aged 50-66 was added to the survey in 1996.

The samples in the present study were drawn from new participants in the survey since 1996, who were followed up in 1999, 2003, and 2007, with attrition due to missing cases and death. Only those who completed three or more waves of interviews and who self-reported were included in the analysis (Figure 1). Missing items for the included samples were imputed by last value carried forward (LVCF) method. Thus, 2097 persons were included in the group-based trajectory analysis.

Measures

Smoking behaviors

Smoking behavior was defined as occurring if the respondent engaged in the

(4)

behavior at the time of the interview. It was coded as a binary outcome (yes/no). The analysis of smoking behaviors was examined by gender.

Predictors

Predictors of the health behavior trajectories included demographic variables and the health status at the baseline in 1996.

(1) Demographic variables: age, education (high school or above/ below high school), working status (working or not), marital status (having a spouse or not), ethnic group (mainlanders or others (Fuchien/ Hakka/ Aboriginal)), domestic situation (living alone or living with someone), economic satisfaction (categorized into 3 groups: unsatisfied, fair, and satisfied), and living area (urban or rural).

(2) Health status: included self-rated health (scored 1 to 5, indicating very poor to excellent), number of chronic diseases (summation of self-reported chronic diseases, including hypertension, diabetes, heart disease, stroke, cancer, respiratory tract disease, arthritis, liver or gall bladder disease, gastrointestinal disorders, and kidney disease; score from 0 to 10), and depressive symptoms (measured by the 10-item Centre for Epidemiologic Studies Depression Scale with scores ranging from 0 to 30).

29

Analysis

The group-based trajectory analysis was used to identify the trajectory groups.

28

This method is designed to cluster individuals that exhibit a similar progression in

some outcome or behavior over time. The group-based trajectory model assumes that

the population is composed of a mixture of underlying trajectory groups. It is assumes

that Y

i

= {y

i1

, y

i2

, y

i3

, …. y

iT

}, where the longitudinal measurement is of an individual i

over T periods and that P(Y

i

) = Σπ

j

P

j

(Y

i

), where P(Y

i

) is the probability of Y

i

given

membership in group j, and π

j

is the probability of group j. The form of P(Y

i

) is

(5)

determined by the type of data used in the analysis. The group-based trajectory model is applicable for normal distributed, binary, or zero-inflated Poisson outcome

variables.

28

In this present study, smoking behavior was defined as a binary variable (yes/no), thus, a logistic model distribution was applied.

The optimal trajectory group number was determined by comparing the change in the Bayesian information criteria (△BIC) and the parsimony principle. A SAS procedure, PROC TRAJ, was applied for the analysis.

30

The unconditional model (wit only time but no other covariates included) was applied first, after which the baseline predictors were added to the model.

Results

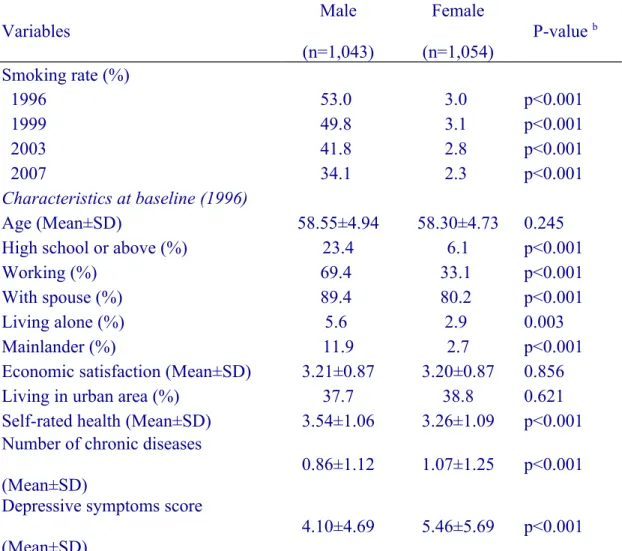
Table 1 shows the gender differences in smoking behavior across four waves and the baseline characteristics. Men had much higher smoking rates than women in all waves. Most other characteristics differed significantly between men and women.

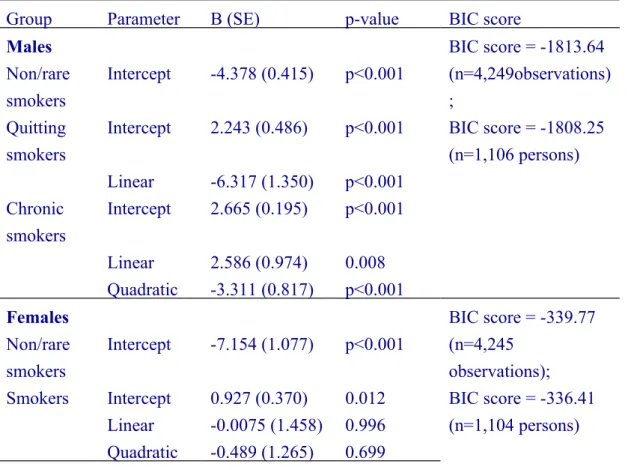
First, the unconditional model was analyzed to determine the optimal group numbers. The optimal group number was 3 for men and 2 for women according to the BIC scores. The group-based trajectories of smoking of the unconditional models by gender are shown in Figure 2, and the coefficients are shown in Table 2. The

trajectories of smoking among male respondents were identified as follows: non/rare smokers (42.6%), quitting smokers (16.5%), and chronic smokers (40.9%). The smoking trajectories among female respondents included non/rare smokers (95.9%) and smokers (4.1%). The average posterior probabilities for males were: 0.99

(non/rare smokers), 0.85 (quitting smokers), and 0.97 (chronic smokers); the posterior probabilities for females were 0.99 (non/rare smokers) and 0.94 (smokers).

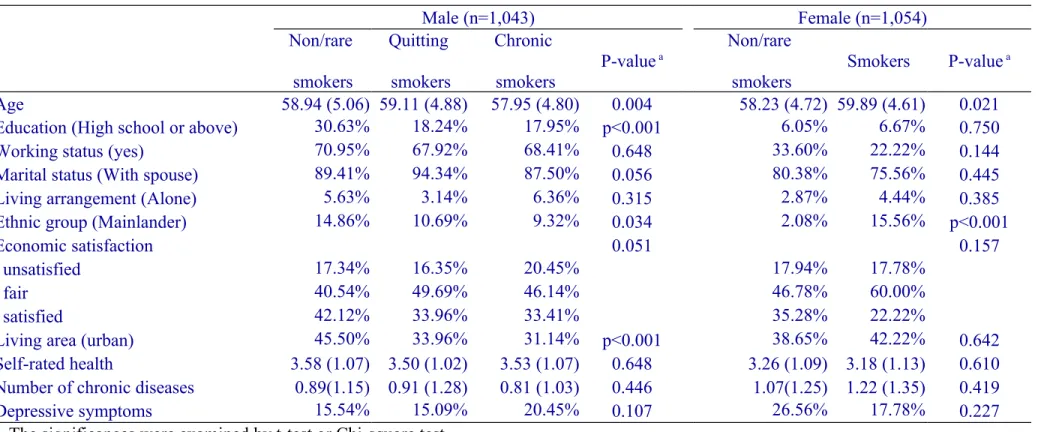
The characteristics of the trajectory groups stratified by gender are shown in

Table 3. Male quitting smokers were older than non-smokers and chronic smokers.

(6)

Male non-smokers were also more likely to be higher educated, mainlanders, and to live in urban areas. Among the female respondents, smokers were older than non- smokers, and mainlanders were more likely to be smokers.

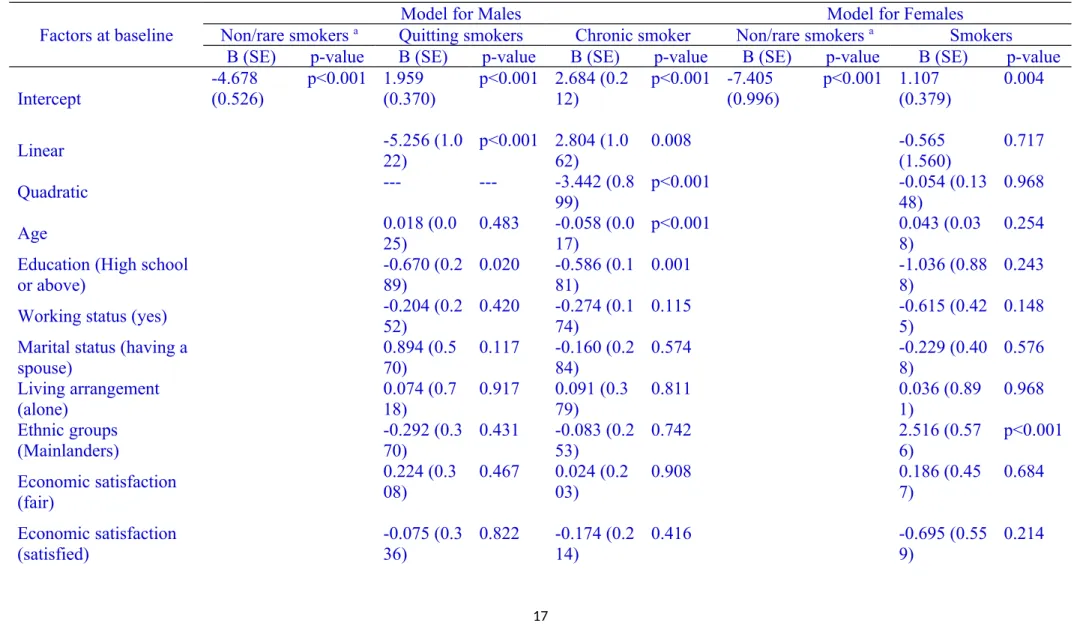
Next, the factors at baseline were added to the model to compare the

characteristics across trajectory groups (Table 4). For the model with covariates, the average posterior probabilities for males were: 0.98 (non/rare smokers), 0.90 (quitting smokers), and 0.95 (chronic smokers); the posterior probabilities for females were 0.99 (non/rare smokers) and 0.97 (smokers). The non/rare smoking group was used as the reference group for both men and women. Compared to the male non/rare

smokers, the male quitting smokers were more likely to be lower educated (β=-0.670).

The male chronic smokers were more likely to be younger (β= -0.058), lower

educated (β=-0.586), and living in rural areas (β=-0.452). Female smokers were more likely to be mainlanders (β=2.516), but female smokers did not differ significantly in other characteristics when compared to female non/rare smokers.

Discussion

We used data from an 11-year, 4-wave panel study of Taiwanese older adults to examine the multiple trajectories of smoking behavior. Three groups were identified for male respondents (non/rare, quitting, and chronic smokers), and two groups were identified for female respondents (non/rare smokers and smokers). Age, education, and living in urban areas were related to the smoking trajectories for male

respondents. The smoking trajectories for female respondents differed significantly by ethnic group.

Fewer trajectory patterns were identified in our study than in other studies.

14,15

The most important possible reason for this difference is the age of entry of the

trajectories. The samples in previous studies were younger than the samples in our

(7)

study.

14,15

The younger population may be more likely to begin smoking behaviors, whereas fewer middle-aged or older adults may begin smoking. Furthermore, the behaviors of older adults may be more rigid than are those of younger adults. The follow-up period for our study was also shorter than the follow-up period in Frosch’s study.

14

Thus, changes over a longer time could not be observed in our study.

Smoking behavior patterns are different in the older people and in the younger ones. Previous study revealed the incidence of smoking cessation were greater in young and old adult than middle age among both gender.

31

And there are more reasons to quit smoking for the young females than for the elderly females, such as pregnancy and breastfeeding.

32

Even for the women only, the smoking cessation programs targeted elderly female were few.

33

That could explain why it seemed that the smoking behavior was more stable in the female elderly.

There were gender differences in the trajectories of smoking behaviors. The smoking probability for Taiwanese women was much lower than the smoking probability for men; only 4.1% of female respondents were smokers, whereas 40.9%

of male respondents were chronic smokers, consistent with other studies.

18

Gender role norms may affect differences in smoking behavior.

34

Due to social disapproval of women’s smoking, general restrictions on women’s behavior, and men were more likely to adopt smoking than women. In addition, the smoking trajectories for males were differentiated into 3 groups, whereas females were only identified as smokers or non/rare smokers. Previous studies found a rate of 20.5% to 25.1% for former

smokers among females,

4,17,27

but the quitting trajectory of female respondents was not

identified in our study. It is possible that the smoking rate among female older adults

was much lower, and changes in smoking behaviors were unidentifiable.

(8)

Being older relating to a lower smoking rate for both genders is found in previous studies,

11,18

and being older is related to a larger number of quitting attempts.

11

In our study, male chronic smokers were younger than quitting smokers and non/rare smokers. Because the female quitting smokers were not identified in this study, the age difference among female smokers and quitters could not be confirmed.

Previous studies have found that education is inversely related to smoking behaviors for both genders.

17,25

Education is related to health literacy and healthy lifestyles, and people with higher education may be more likely to avoid smoking or to quit smoking. However, the education was not significant among females in our study. It is possible that the education level of the females in this cohort was commonly low.

Male older adults living in urban areas were less likely to be chronic smokers than to be non/rare smokers. This result was consistent with the negative relationship between the smoking rate and urbanization in cities in Taiwan. A person’s living area represents his or her life opportunities and occupation-related lifestyle. It is possible that older Taiwanese men living in rural areas were more likely to be farmers or to work in blue-collar occupations, lifestyles in which smoking is more prevalent.

Female Mainlanders were more likely to be smokers than other female ethnic

groups. After the civil war in China, many soldiers, government employees, and

wealthy people emigrated from Mainland China to Taiwan around 1949. The

mainlander group had higher socioeconomic status were more empowered and

enjoyed greater freedom than the Fuchien or Hakka females, which may explain the

difference in smoking behavior between these ethnic groups. Higher-educated women

were more likely to be smokers.

17

(9)

There are some limitations to this study. First, some variables were unavailable in the data, such as nicotine dependence, other smokers in the household,

18

misinformation and erroneous beliefs about smoking or the use of smoking as a coping strategy for stress.

2

Second, the low smoking rate among Taiwanese females leads to little variation; therefore, the heterogeneity of female smoking behavior was not further identified. Third, we included only baseline predictors in the model. The time-varying covariates, such as health status during follow-up, were not included in the model. Fourth, the longitudinal data were collected every several years. The smoking behavior may have changed during two waves (such as quitting and smoking again) but that was undetectable. Fifth, only those who completed the surveys 3 or 4 waves and self-reported were included in the analysis. It is possible that these analysis samples were healthier than the excluded ones. Sixth, the data were collected from the middle-aged and older people only. We cannot compare the patterns between the older and the younger people by this data.

Changes occur in smoking behavior with age, and the trajectory patterns and related factors differ for males and females. Current health promotion policy and smoking cessation strategies usually target the male population and overlook the gender differences. We suggest that health policy makers and program planners should consider these gender differences and develop strategies that are sensitive to gender.

References

1. Tian X, Tang Z, Jiang J, et al. Effects of smoking and smoking cessation on life expectancy in an elderly population in Beijing, China, 1992-2000: an 8-year follow-up study. J Epidemiol. 2011;21:376-384.

2. Appel DW, Aldrich TK. Smoking cessation in the elderly. Clin Geriatr Med.

(10)

2003;19:77-100.

3. Cui R, Iso H, Yamagishi K, et al. Relationship of smoking and smoking cessation with ankle-to-arm blood pressure index in elderly Japanese men. Eur J Cardiovasc Prev Rehabil. 2006;13:243-248.

4. Strine TW, Okoro CA, Chapman DP, et al. Health-related quality of life and health risk behaviors among smokers. Am J Prev Med. 2005;28:182-187.

5. Hernán MA, Alonso A, Logroscino G. Cigarette smoking and dementia: potential selection bias in the elderly. Epidemiol. 2008;19:448-450.

6. Peters R, Poulter R, Warner J, et al. Smoking, dementia and cognitive decline in the elderly, a systematic review. BMC Geriatr. 2008;8:36.

7. Bernat DH, Erickson DJ, Widome R, et al. Adolescent smoking trajectories: results from a population-based cohort study. J Adolesc Health. 2008;43:334-340.

8. Colder CR, Flay BR, Segawa E, et al. Trajectories of smoking among freshmen college students with prior smoking history and risk for future smoking: data from the University Project Tobacco Etiology Research Network (UpTERN) study. Addiction. 2008;103:1534-1543.

9. Juon HS, Ensminger ME, Sydnor KD. A longitudinal study of developmental trajectories to young adult cigarette smoking. Drug Alcohol Depend.

2002;66:303-314.

10. Orlando M, Tucker JS, Ellickson PL, et al. Developmental trajectories of cigarette smoking and their correlates from early adolescence to young adulthood. J Consult Clin Psychol. 2004;72:400-410.

11. Vanasse A, Niyonsenga T, Courteau J. Smoking cessation within the context of family medicine: which smokers take action? Prev Med. 2004;38:330-337.

12. Grøtvedt L, Stavem K. Association between age, gender and reasons for smoking

(11)

cessation. Scand J Public Health. 2005;33:72-76.

13. Kviz FJ, Clark MA, Crittenden KS, et al. Age and smoking cessation behaviors.

Prev Med. 1995;24:297-307.

14. Frosch ZA, Dierker LC, Rose JS, et al. Smoking trajectories, health, and mortality across the adult lifespan. Addict Behav. 2009;34:701-704.

15. Scott-Sheldon LA, Carey MP, Senn TE, et al. Smoking behavior among low- income black adults: patterns and correlates of smoking trajectories. Nicotine Tob Res. 2010;12:1019-1028.

16. Bozkurt AI, Sahinöz S, Ozçirpici B, et al. Patterns of active and passive smoking, and associated factors, in the South-east Anatolian Project (SEAP) region in Turkey. BMC Public Health. 2006;6:15.

17. Djikanovic B, Marinkovic J, Jankovic J, et al. Gender differences in smoking experience and cessation: do wealth and education matter equally for women and men in Serbia? J Public Health (Oxf). 2011;33:31-38.

18. Fukuda Y, Nakamura K, Takano T. Socioeconomic pattern of smoking in Japan:

income inequality and gender and age differences. Ann Epidemiol.

2005;15:365-372.

19. Osler M, Prescott E, Godtfredsen N, et al. Gender and determinants of smoking cessation: a longitudinal study. Prev Med. 1999;29:57-62.

20. Tsai YW, Tsai TI, Yang CL, et al. Gender differences in smoking behaviors in an Asian population. J Womens Health (Larchmt). 2008;17:971-978.

21. Giskes K, Kunst AE, Benach J, et al. Trends in smoking behaviour between 1985 and 2000 in nine European countries by education. J Epidemiol Community Health. 2005;59:395-401.

22. Haustein KO. Smoking and poverty. Eur J Cardiovasc Prev Rehabil.

(12)

2006;13:312-318.

23. Khang YH, Cho HJ. Socioeconomic inequality in cigarette smoking: trends by gender, age, and socioeconomic position in South Korea, 1989-2003. Prev Med. 2006;42:415-422.

24. Breitling LP, Müller H, Raum E, et al. Low-to-moderate alcohol consumption and smoking cessation rates: retrospective analysis of 4576 elderly ever-smokers.

Drug Alcohol Depend. 2010;108:122-129.

25. Honda K. Psychosocial correlates of smoking cessation among elderly ever- smokers in the United States. Addict Behav. 2005;30:375-381.

26. Whitson HE, Heflin MT, Burchett BM. Patterns and predictors of smoking cessation in an elderly cohort. J Am Geriatr Soc. 2006;54:466-471.

27. Pampel FC. Cigarette diffusion and sex differences in smoking. J Health Soc Behav. 2001;42:388-404.

28. Nagin DS. Group-based modeling of development. Cambridge, MA: Harvard University Press; 2005.

29. Kohout FJ, Berkman LF, Evans DA, et al. Two shorter forms of the CES-D (Center for Epidemiological Studies Depression) depression symptoms index.

J Aging Health. 1993;5:179-193.

30. Jones BL, Nagin DS, Roeder K. A SAS Procedure Based on Mixture Models for Estimating Developmental Trajectories. Sociology Methods & Research.

2001; 29:374-393.

31. Fidler J, Ferguson SG, Brown J, Stapleton J, West R. How does rate of smoking cessation vary by age, gender, and social grade? Findings from a population survey in England. Addiction. 2013; 108: 1680-1685.

32. Schneider S, Huy C, Schütz J, Diehl K. Smoking cessation during pregnancy: a

(13)

systematic literature review. Drug Alcohol Rev. 2010; 29:81-90.

33. Torchalla I, Okoli CTC, Bottorff JL, Qu A, Poole N, Greaves L. Smoking cessation programs targeted to women: a systematic review. Women Health.

2012; 52:32-54.

34. Waldron I. Patterns and causes of gender differences in smoking. Soc Sci Med.

1991;32:989-1005.

(14)

Table 1. Characteristics of study samples by gender (n=2,097)

a

at baseline

Variables

Male (n=1,043)

Female

(n=1,054) P-value

b

Smoking rate (%)

1996 53.0 3.0 p<0.001

1999 49.8 3.1 p<0.001

2003 41.8 2.8 p<0.001

2007 34.1 2.3 p<0.001

Characteristics at baseline (1996)

Age (Mean±SD) 58.55±4.94 58.30±4.73 0.245

High school or above (%) 23.4 6.1 p<0.001

Working (%) 69.4 33.1 p<0.001

With spouse (%) 89.4 80.2 p<0.001

Living alone (%) 5.6 2.9 0.003

Mainlander (%) 11.9 2.7 p<0.001

Economic satisfaction (Mean±SD) 3.21±0.87 3.20±0.87 0.856

Living in urban area (%) 37.7 38.8 0.621

Self-rated health (Mean±SD) 3.54±1.06 3.26±1.09 p<0.001 Number of chronic diseases

(Mean±SD)

0.86±1.12 1.07±1.25 p<0.001 Depressive symptoms score

(Mean±SD)

4.10±4.69 5.46±5.69 p<0.001 a. The total number of cases analyzed was 2,097 after excluding those with more than

one missing in smoking status of 1996, 1999, 2003, and 2007, and those missing in any covariate.

b. The significances were examined by t-test or Chi-square test.

(15)

Table 2. The coefficients of the unconditional model for males

Group Parameter B (SE) p-value BIC score

Males BIC score = -1813.64

(n=4,249observations)

;

BIC score = -1808.25 (n=1,106 persons) Non/rare

smokers

Intercept -4.378 (0.415) p<0.001

Quitting smokers

Intercept 2.243 (0.486) p<0.001

Linear -6.317 (1.350) p<0.001 Chronic

smokers

Intercept 2.665 (0.195) p<0.001

Linear 2.586 (0.974) 0.008 Quadratic -3.311 (0.817) p<0.001

Females BIC score = -339.77

(n=4,245 observations);

BIC score = -336.41 (n=1,104 persons) Non/rare

smokers

Intercept -7.154 (1.077) p<0.001

Smokers Intercept 0.927 (0.370) 0.012

Linear -0.0075 (1.458) 0.996

Quadratic -0.489 (1.265) 0.699

(16)

Table 3. Characteristics of subjects by gender and smoking trajectories, mean (SD) or %

Male (n=1,043) Female (n=1,054)

Non/rare smokers

Quitting smokers

Chronic smokers

P-value

a

Non/rare smokers

Smokers P-value

a

Age 58.94 (5.06) 59.11 (4.88) 57.95 (4.80) 0.004 58.23 (4.72) 59.89 (4.61) 0.021

Education (High school or above) 30.63% 18.24% 17.95% p<0.001 6.05% 6.67% 0.750

Working status (yes) 70.95% 67.92% 68.41% 0.648 33.60% 22.22% 0.144

Marital status (With spouse) 89.41% 94.34% 87.50% 0.056 80.38% 75.56% 0.445

Living arrangement (Alone) 5.63% 3.14% 6.36% 0.315 2.87% 4.44% 0.385

Ethnic group (Mainlander) 14.86% 10.69% 9.32% 0.034 2.08% 15.56% p<0.001

Economic satisfaction 0.051 0.157

unsatisfied 17.34% 16.35% 20.45% 17.94% 17.78%

fair 40.54% 49.69% 46.14% 46.78% 60.00%

satisfied 42.12% 33.96% 33.41% 35.28% 22.22%

Living area (urban) 45.50% 33.96% 31.14% p<0.001 38.65% 42.22% 0.642

Self-rated health 3.58 (1.07) 3.50 (1.02) 3.53 (1.07) 0.648 3.26 (1.09) 3.18 (1.13) 0.610 Number of chronic diseases 0.89(1.15) 0.91 (1.28) 0.81 (1.03) 0.446 1.07(1.25) 1.22 (1.35) 0.419

Depressive symptoms 15.54% 15.09% 20.45% 0.107 26.56% 17.78% 0.227

a. The significances were examined by t-test or Chi-square test.

(17)

Table 4. Factors at baseline related to smoking trajectories by gender (n=1043)

Model for Males Model for Females

Factors at baseline Non/rare smokers

a

Quitting smokers Chronic smoker Non/rare smokers

a

Smokers B (SE) p-value B (SE) p-value B (SE) p-value B (SE) p-value B (SE) p-value Intercept

-4.678 (0.526)

p<0.001 1.959 (0.370)

p<0.001 2.684 (0.2 12)

p<0.001 -7.405 (0.996)

p<0.001 1.107 (0.379)

0.004

Linear -5.256 (1.0

22)

p<0.001 2.804 (1.0 62)

0.008 -0.565

(1.560)

0.717

Quadratic --- --- -3.442 (0.8

99)

p<0.001 -0.054 (0.13

48)

0.968

Age 0.018 (0.0

25)

0.483 -0.058 (0.0 17)

p<0.001 0.043 (0.03

8)

0.254 Education (High school

or above) -0.670 (0.2

89) 0.020 -0.586 (0.1

81) 0.001 -1.036 (0.88

8) 0.243

Working status (yes) -0.204 (0.2

52)

0.420 -0.274 (0.1 74)

0.115 -0.615 (0.42

5)

0.148 Marital status (having a

spouse)

0.894 (0.5 70)

0.117 -0.160 (0.2 84)

0.574 -0.229 (0.40

8)

0.576 Living arrangement

(alone)

0.074 (0.7 18)

0.917 0.091 (0.3 79)

0.811 0.036 (0.89

1)

0.968 Ethnic groups

(Mainlanders)

-0.292 (0.3 70)

0.431 -0.083 (0.2 53)

0.742 2.516 (0.57

6)

p<0.001

Economic satisfaction (fair)

0.224 (0.3

08) 0.467 0.024 (0.2

03) 0.908 0.186 (0.45

7) 0.684

Economic satisfaction

(satisfied) -0.075 (0.3

36) 0.822 -0.174 (0.2

14) 0.416 -0.695 (0.55

9) 0.214

(18)

Living area (urban) -0.411 (0.2 31)

0.076 -0.452 (0.1 54)

0.004 -0.008 (0.35

2)

0.983

Self-rated health 0.002 (0.1

18)

0.989 0.030 (0.0 81)

0.712 0.051 (0.17

9)

0.776 Number of chronic

diseases 0.037 (0.1

02) 0.720 -0.085 (0.0

74) 0.250 0.112 (0.13

3) 0.401

Depressive symptoms -0.163 (0.3

26)

0.618 0.307 (0.2 11)

0.145 -0.672 (0.44

6)

0.132

BIC score BIC= -1789.51 (N=4006)

BIC= -1767.98 (N=1043)

BIC= -347.46 (N=4056)

BIC= -336.00 (N=1054)

a. The Non/rare smoker group was the reference group.

(19)

Figure 1. Taiwan Longitudinal Survey on Aging data and analysis samples

(20)

Figure 2. Trajectories of smoking behavior for the male and female elderly

數據

Table 1. Characteristics of study samples by gender (n=2,097) a  at baseline Variables Male (n=1,043) Female (n=1,054) P-value  b Smoking rate (%) 1996 53.0  3.0  p&lt;0.001 1999 49.8  3.1  p&lt;0.001 2003 41.8  2.8  p&lt;0.001 2007 34.1  2.3  p&lt;0.001 C
Table 2. The coefficients of the unconditional model for males
Table 3. Characteristics of subjects by gender and smoking trajectories, mean (SD) or % Male (n=1,043) Female (n=1,054) Non/rare  smokers Quitting smokers Chronic smokers P-value  a Non/rare smokers Smokers P-value  a Age 58.94 (5.06) 59.11 (4.88) 57.95 (4
Table 4. Factors at baseline related to smoking trajectories by gender (n=1043)
+2

參考文獻

相關文件

Curriculum planning - conduct holistic curriculum review and planning across year levels to ensure progressive development of students’ speaking skills in content, organisation

Relevant topics include, but are not limited to: Document Representation and Content Analysis (e.g., text representation, document structure, linguistic analysis, non-English

Teacher / HR Data Payroll School email system Exam papers Exam Grades /.

Classifying sensitive data (personal data, mailbox, exam papers etc.) Managing file storage, backup and cloud services, IT Assets (keys) Security in IT Procurement and

However, in Taiwan, swelling can frequently occur in projects involving polished homogeneous tiles because of the large seasonal differences in temperatures and certain

• I referred to curriculum standards and 4 textbooks series (children and parents are from 4 schools) to develop research-based activities suitable for parent-child Math Camp.

(1) Parents in different ages, education backgrounds, vocations, and numbers of children in school show significant differences in teacher’s changes dimension related to

Using Structural Equation Model to Analyze the Relationships Among the Consciousness, Attitude, and the Related Behavior toward Energy Conservation– A Case Study