國立臺灣大學理學院化學系 碩士論文
Department of Chemistry College of Science
National Taiwan University Master Thesis
3號位取代硫二苯胺的初步光物理特性
Rudimentary photophysical property of selected 3-substituted phenothiazines
陳孟圻 Meng-Chi Chen
指導教授﹕周必泰 博士 Advisor: Pi-Tai Chou, Ph.D.
中華民國 109 年 1 月
January 2020
致謝
自 2016 年六月從國立清華大學化學系畢業後,經歷了一年半的顛簸,我在 2018 年二月才重新 回到校園。在這一年半中,十月服完兵役、十一月申請國外研究所失利、十二月匆忙準備考國內研 究所;隔年初發現國內國外研究所皆落榜,於是決定念完碩士再出國。開始蹲研究所補習班,虛心 地將自己學識不足的地方補齊。整個 2017 年,我將大學化學完整地複習了一遍。十月申請臺大化 學碩士班甄試,在經過書面審查及口試後,儘管落在備取的安全名單內,但仍孜孜不倦地準備並報 名隔年初的碩士班考試。在 2018 年的一月,我先是得知甄試備取錄取通知,隨後參加研究所考 試,接著用甄試錄取的管道申請提早入學,並於二月初正式加入周必泰實驗室,最後於二月中得知 碩士班考試獲得正取 13 的成績。
藉由甄試與考試兩個不同性質的管道,我都能錄取臺大化學系。這並不是因為我優秀,而是一路上 有許多人的協助。其中,在準備甄試與考試的過程中,有一群在補習班認識的戰友彼此切磋砥礪。臺大 植微趙子瑄;師大化學蘇尹翔、吳世鴻、吳承軒、徐儷文、陳彥瑜、黃柏元;淡江化學陳昱涵、呂曉 旻、方博靖、賴雨岑;臺大化學顏竹君、張達生,交大化學許亮宇、輔大化學廖又潔、中原化學高琛 華、北市教大呂佳澄。以上同學讓我在準備考試的路上不孤單。另外,在給臺大化學的推薦信中,多虧 了在清華大學時的專題指導老師黃哲勳教授,以及大學期間去美國 UC San Diego 交換研究生時指導我的 博後 Dr. Juan Luis Bosch 的大力支持,我才能夠申請順利。
進入周必泰實驗室的第一年,我在奈米組做量子點的研究。第二年轉入光譜組,進行本論文的研 究。奈米組的周尚威博士、胡育愷、陳晏誼、周克駿、李衍毅、黃智炫、劉怡均,及羅子軒,都給我許 多支持。光譜組的劉士弘博士、陳怡安博士、陳怡廷博士、陳登高、劉宗穎、魏佑臣、張凱信、鄭郁 璇、曾聖茗、黃俊穎、林家安、王致惟、周大喆、林千妍、陳奕云、盧宥霖、Seb Jackson,及吳秀剛,
在實驗上給我許多協助。我想特別提一下陳登高學長,他給我許多研究上的幫助,在我看來,他不只是
位博士生,而是位已經有助理教授學識與氣度的科學家。有機組的陳怡博士、孟繁翌博士、劉俊騏、李 曜麟、何偲愉、楊雨軒、彭宇強,及何嘉哲,也讓我成長不少。
周必泰老師是位刀子嘴豆腐心的好老師。表現不佳時他罵得很難聽,是希望我們可以進步。老師百 忙之中還願意幫我寫國外研究所跟獎學金的推薦信,我十分感動。實驗室助理林佳貞幫助大家處理報帳 等行政工作,讓大家可以專心於研究。系辦許慧禎小姐從我提早入學時的申請,到我畢業時的口試與離 校都給予許多協助。
先父陳守文在我畢業半年前因腎臟病末期辭世,我很開心他可以看見我大學畢業,可惜無法看見我 碩士畢業。處理父親後事的過程,身為獨生子的我責無旁貸。喪假期間周老師及實驗室同仁的包容我沒 齒難忘,請假去參與後續法事老師也十分寬容。當我在龍巖為父親守靈時,李曜麟同學還不忘以電郵及 電話不斷地督促我整理數據並盡快撰寫期刊草稿,真是令人動容。
家人方面,阿嬤陳蔡阿嬌、先父陳守文,及母親張麗玲提供了一個可以自由追夢的家,讓我專心於 學業、研究,及申請國外大學。雙親生給我健全的身體,讓我可以忍受追求知識的過程中必要之身心靈 的壓力。每天開車上下班的呂佳燕對我這個每天騎腳踏車上下學的男友不離不棄,如此寬大的胸襟實在 是有容乃大。這一路走來我接受的幫助實在是太多了,孟圻在此向各位深深一鞠躬。
摘要
無論在藥物、染料敏化太陽能電池,或是有機發光二極體上,硫二苯胺(phenothiazine,PTZ)
都有許多的應用。但由於它螢光量子產率低(在環己烷中小於 1%),在應用上受到部分限制。
有趣的是,當這個低螢光量子產率與硝基(-NO2),一個普遍公認螢光淬滅體,結合形成 3-硝
基硫二苯胺(3-nitrophenothiazine,PTZ-NO2)時,竟有極高的螢光量子產率(在環己烷中
100%)。為了更進一步調查此現象及其背後的物理化學機制,我們設計並合成了一系列的 C3 取代硫二苯胺來做比較,其中取代基包含拉電子的腈基(-CN)、甲醯基(-CHO),及硝基(-
NO2),以及推電子的甲氧基(-OMe)。與無取代的硫二苯胺及加了推電子基的硫二苯胺相比,
拉電子基造成螢光量子產率明顯提高。在化學計算的幫助之下,我們發現 π 到 π*的電子躍遷在
PTZ 及 PTZ-OMe 中是部分禁制躍遷,因其 π*與硫上的未鍵結軌域混合;相反地,由於拉電子 基降低了 LUMO 的能量,使它不再與未鍵結軌域混合,而造成 π 到 π*變為容許躍遷。此研究展 示了如何利用分子設計一窺 PTZ 中 HOMO 跟 LUMO 的能量,進而達到高螢光量子產率。
關鍵字:硫二苯胺、硝基、量子產率、螢光。
Abstract
Phenothiazine (PTZ) is a versatile compound that possesses many applications in pharmaceutical chemistry, dye-sensitized solar cell, etc. However, its weak-fluorescent character (quantum yields less than 1% in toluene) impedes its further applications. Besides, the nitro group (-NO2) is widely considered as a fluorescence quencher. Interestingly, we can obtain a highly fluorescent chromophore by combining these two moieties, forming 3-nitrophenothiazine (PTZ-NO2). To make a fair comparison, a series of PTZ substituted with various electron-withdrawing groups (cyano -CN and formyl -CHO) and electron- donating group (methoxy -OMe) group at C3-position was designed and synthesized. As we observed, the three molecules with different electron-withdrawing groups exhibit brilliant quantum yields compared with the non-substituted PTZ and electron-donating group substituted derivative. With the aid of computational approaches, the results reveal that the electronic transitions in PTZ and PTZ-OMe are partially forbidden π to π* transition, in which the π* orbital is mixed with the nonbonding orbital character of the sulfur atom. On the contrary, the transitions in the electron-withdrawing substituted analogies show allowed π to π* transition, which is due to the addition of electron-withdrawing group lowering the energy level of LUMO to diminish their mixing with non-bonding orbitals. This work demonstrates a judicious chemical design to exploit the energy level of HOMO and LUMO in PTZ analogies to achieve the high quantum yields.
Keywords: phenothiazine, nitro, quantum yield, fluorescence.
Contents
Introduction ... 15
Motivation ... 17
Experiments ... 18
Synthesis ... 18
Absorbance... 19
Photoluminescence... 19
Quantum yield ... 20
Time-Correlated Single Photon Counting (TCSPC) ... 21
Extinction coefficient ... 21
Thermal vapor deposition ... 22
Results and Discussion ... 24
Structural Characterization ... 24
Solid state photophysical property of PTZ-NO2 ... 24
Photophysical properties ... 25
Cyclic voltammetry analysis ... 28
Computational approaches ... 30
Conclusion ... 33
Spectra, computed frontier orbitals, and additional tables ... 34
Absorption and Fluorescence in cyclohexane, toluene and dichloromethane ... 34
Absorption and Fluorescence in toluene, ethanol, and acetonitrile ... 35
... Extinction coefficient in toluene 36 Experimental Stokes shift ... 36
Excited-state-optimized and ground-state-optimized structure and orbital ... 37
Fluorescence decay ... 38
Quantum yield, Lifetime, and rate constant ... 41
Supplementary Information ... 42
Compound appearance ... 42
Solid spectrum of PTZ-NO2 ... 42
Synthesis procedure ... 43
1. Synthesis of PTZ-NO2 ... 43
2. Synthesis of PTZ-NH2 ... 45
3. Synthesis of PTZ-CHO ... 47
4. Synthesis of PTZ-CN ... 49
5. Synthesis of DPA-OMe ... 51
6. Synthesis of PTZ-OMe... 53
Cyclic Voltammetry ... 55
1. Cyclic Voltammetry graph ... 55
2. HOMO LUMO energy ... 56
Computational approach ... 57
1. Ground state and excited state optimized structure ... 59
2. Ground state optimized orbital ... 59
3. Distance definition of 𝑟𝑐, 𝑟𝐷 +, and 𝑟𝐴 − ... 59
Crystal data and structure refinement ... 60
1. Crystallography of PTZ-OMe ... 60
2. Crystallography of PTZ ... 62
3. Crystallography of PTZ-CHO ... 64
4. Crystallography of PTZ-NO2 ... 66
Reference ... 68
Content of Figure, Scheme, and Table
Figure 1. Normalized absorption and photoluminescence spectra of five entitled molecules. Notes that red, yellow, and green lines represent toluene (TOL), ethanol (EtOH), and acetonitrile (ACN),
respectively. ... 34
Figure 2. Normalized absorption and photoluminescence spectra of five entitled molecules. Notes that orange, blue, and purple lines represent toluene (TOL), ethanol (EtOH), and acetonitrile (ACN), respectively. ... 35
Figure 3. Excited-state-optimized structure (1st row), ground-state-optimized structure (2nd row), as well as excited-state-optimized HOMO (3rd row) and LUMO (4th row) orbitals of the titled molecules computed by m062x/6-31+g(d,p) with cyclohexane as solvent. ... 37
Scheme 1. Chemical structures of phenothiazine and analogues modified at C3-position. 17 Scheme 2. Synthesis route of five entitled molecules. ... 18
Table 1. Excitation wavelength and standard dye of titled molecules 19 Table 2. Experimental and calculated optical characteristics for the titled molecules a ... 25
Table 3. Electrochemical properties and free energy of photoinduced electron transfer of the three entitled molecules with charge transfer. ... 28
Figure S1. Molar absorption coefficients of five entitled molecule measured in toluene. ... 36
Figure S2. Fluorescence decay spectrum of PTZ-OMe in five different solvent. ... 38
Figure S3. Fluorescence decay spectrum of PTZ in five different solvent. ... 38
Figure S4. Fluorescence decay spectrum of PTZ-CN in five different solvent. ... 39
Figure S5. Fluorescence decay spectrum of PTZ-CHO in five different solvent. ... 39
Figure S6. Fluorescence decay spectrum of PTZ-NO2 in five different solvent. ... 40
Figure S7. The appearance of entitled compounds under regular indoor light. ... 42
Figure S8. (a) Absorption spectra of PTZ-NO2 in toluene (brown dash) and in 110 nm film made by vacuum deposition. Orange solid line is the PL spectrum of PTZ-NO2 in s toluene. Green, Blue, and Purple dot lines are PL spectra of PTZ-NO2 in solid film and powder form excited by different light source and collected by different detector. There are no meaningful peaks observed in solid PL spectrum of PTZ-NO2. No florescence when shine with hand-held UV light. (b) Appearance of PTZ- NO2 in toluene. (c) Appearance of PTZ-NO2 in 300 nm thick vacuum deposited film. ... 42
Figure S9. 1H NMR of PTZ-NO2. ... 44
Figure S10. 13C NMR of PTZ-NO2. ... 44
Figure S11. 1H NMR of PTZ-NH2. ... 46
Figure S12. 13C NMR of PTZ-NH2. ... 46
Figure S13. 1H NMR of PTZ-CHO. ... 48
Figure S14. 13C NMR of PTZ-CHO. ... 48
Figure S15. 1H NMR of PTZ-CN... 50
Figure S16. 13C NMR of PTZ-CN. ... 50
Figure S17. 1H NMR of DPA-OMe. ... 52
Figure S18. 13C NMR of DPA-OMe. ... 52
Figure S19. 1H NMR of PTZ-OMe. ... 54
Figure S20. 13C NMR of PTZ-OMe. ... 54
Figure S21. Cyclic voltammograms of five entitled molecules. Reduction curves of PTZ derivatives are irreversible since they are easily oxidized. ... 55 Figure S22. Ground state and excited state optimized structure, with bending angle shown. Red plane was calculated from six carbons in the left benzene ring, green plane was calculated from six carbons in
the right benzene ring, and the bending angle was defined as the smaller angle between red and green
plane. ... 59
Figure S23. Ground state optimization of LUMO (upper) and HOMO (lower) orbitals for PTZ-OMe, PTZ, PTZ-CN, PTZ-CHO, and PTZ-NO2 in cyclohexane. ... 59
Figure S24. Ground state optimized structures in dichloromethane with the definition of 𝑟𝑐, 𝑟𝐷 +, and 𝑟𝐴 −. A centroid of 22 atoms without the substituted group was calculated as D, the red sphere; another centroid of the substituted group was calculated as A, the green sphere. 𝑟𝑐 is the 𝐷𝐴 distance, 𝑟𝐷 + is the 𝐷𝐶3 distance, and 𝑟𝐴 − is the 𝐶3𝐴 distance. ... 59
Figure S25. X-ray crystal structure of PTZ-OMe. ... 61
Figure S26. X-ray crystal structure of PTZ. ... 63
Figure S27. X-ray crystal structure of PTZ-CHO... 65
Figure S28. X-ray crystal structure of PTZ-NO2. ... 67
Scheme S1. Synthetic route of PTZ-NO2. ... 43
Scheme S2. Synthetic route of PTZ-NH2. ... 45
Scheme S3. Synthetic route of PTZ-CHO. ... 47
Scheme S4. Synthetic route of PTZ-CN. ... 49
Scheme S5. Synthetic route of DPA-OMe. ... 51
Scheme S6. Synthetic route of PTZ-OMe. ... 53
Table S1. Stokes shifts of five titled molecule in five different solvent a in unit of wavenumber calculated from the experimental peak wavelength of absorbance and photoluminescence spectrum. 36 Table S2. Excitation, monitoring wavelength as well as quantum yield, lifetime, and rate constate of the entitled molecules... 41
Table S3. HOMO LUMO energy calculated from CV and PL data. Usually, HOMO = −4.8 + 𝐸𝑜𝑥𝑖𝐷 − 𝐸𝑜𝑥𝑖𝐹𝑐 and LUMO = −4.8 + 𝐸𝑟𝑒𝑑𝐴 − 𝐸𝑟𝑒𝑑𝐹𝑐. However, PTZ is easily oxidized when measuring reduction potential, so the calculation of LUMO was adjusted as LUMO = HOMO + E𝑃𝐿 𝑜𝑛𝑠𝑒𝑡, where E𝑃𝐿 𝑜𝑛𝑠𝑒𝑡 is the energy converted from the wavelength of onset of PL spectra,
which is 420 nm is our case. ... 56
Table S4. Calculated wavelength (λ), oscillator strength (f) and orbital transition for five entitled molecules with m062x. ... 57
Table S5. Calculated wavelength (λ), oscillator strength (f) and orbital transition for five entitled molecules with b3lyp. ... 58
Table S5. Crystal data and experimental details for PTZ-OMe. ... 60
Table S6. Crystal data and experimental details for PTZ. ... 62
Table S7. Crystal data and experimental details for PTZ-CHO. ... 64
Table S8. Crystal data and experimental details for PTZ-NO2. ... 66
Introduction
Phenothiazine (PTZ) was first emerged in its derivative from, methylene blue, a medication as well as a dye that was prepared by Heinrich Caro in 1876 at BASF, a Germany-based European chemical company.1, 2 PTZ possesses a handful of biological activities and is widely known for its medical applications including insecticidal,2 antifungal,3 antibacterial,4 and anthelmintic5 (expel parasitic worms and other internal parasites from the body) properties.
Phenothiazine (PTZ) has drawn great attention in both medical and optoelectronic fields since it was synthesized and characterized, and it has been used in a variety of aspects such as pharmaceutical chemistry,6-9 dye-sensitized solar cells (DSSCs),10-13 molecular designs in the thermally activated delayed fluorescence (TADF) molecules,14-18 organic light-emitting diode,19-22 and supramolecular host- guest system.23, 24 PTZ is known as an anthracene-shaped heterocyclic compound with electron-rich nitrogen and sulfur atom in the middle six-member ring (see Scheme 1). Therefore, owing to the electron sufficient sulfur atom, its electron density is more abundant than that of other heterocyclic compounds, such as phenoxazine, acridan and carbazole.18, 25 Moreover, PTZ could transform between three different states: neutral , cation radical (by losing an electron), and oxygenated sulfoxide state (by losing one more electron and double-bonding of sulfur atom to an oxygen atom) under suitable photoionization, providing another perspective in pharmaceutical fields.26, 27
Such bio-synthetic versatility intrigues us to mull the potential of applying PTZ derivatives in luminescence-based bio-sensing. However, low photoluminescence quantum yields (PLQY) in both solution and solid of parent PTZ (PLQY = 0.16% in cyclohexane) and a number of PTZ derivatives were reported.28, 29 In sharp contrast, replacing sulfur in PTZ by the oxygen atom, forming phenoxazine (POZ), renders good to higher emission yield(PLQY = 2.7% in cyclohexane).30 The result manifests the role of sulfur atom in harnessing the emission yield. The relatively soft sulfur atom may lift the energy of lone pair electrons. As a result, the nπ* state is in close proximity to the ππ* state in parent PTZ,
leading to the state mixing that reduces the transition moment. This, together with the nonplanar of the phenothiazine and hence the twisting motions that enhance the non-radiative decay pathways, should account for the low emission yield for PTZ (vide infra).
Motivation
In this study we report the design and syntheses of PTZ derivatives in an aim to harvest the emission in terms of yield and energy by harnessing the substituent at the PTZ moiety. Note that this approach is much distinct from the recent studies in which the whole PTZ moiety is used as an electron donating group to construct a D-bridge-A type thermally activated delay fluorescence (TADF) materials.14-17, 31 Realizing that sulfur long pair electron and twist along the sulfur-carbon bond play a key role, we intend to anchor various electron-withdrawing groups (EWG), including formyl (-CHO), cyano (–CN) and even nitro (–NO2) functional groups at the meta- position with respect to the sulfur atom to lower the lone pair electron energy via the inductive effect. On the other hand, these EWG are intentionally added in the para- position of the phenothiazine nitrogen atom, rendering a potential for charge transfer (CT).
We thus anticipate that the CT effect may lean the PTZ moiety toward a planar configuration to suppress the non-radiative twisting effect. For a fair comparison we also synthesized methoxy (–OMe) PTZ to represent the electron-donating group (EDG). As a result, the introduction of EDG and EWG reveals large effect on the luminescence properties, which are also supportive by the corresponding theoretical approaches. Remarkably, exploiting the –NO2 group that is conventionally thought to be good emission quencher, the PTZ-NO2 achieve 100% PLQY in nonpolar solvents. Detail of results and discussion are elaborated below.
Scheme 1. Chemical structures of phenothiazine and analogues modified at C3-position.
Experiments
Synthesis
Scheme 2. Synthesis route of five entitled molecules.
Organic synthesis and NMR characterization was performed by my colleague, Yao-Lin Lee, who was a third-year doctoral student in our group as I wrote this thesis.
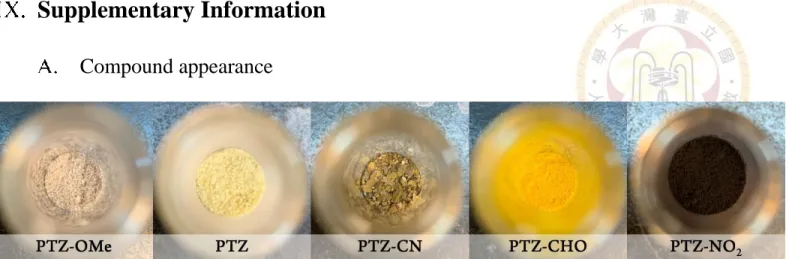
Firstly, PTZ was dissolved in THF and nitrated into PTZ-NO2 with concentrated sodium nitrite aqueous solution in ice bath.32 The nitro group were further reduced with active metal in an aqueous ethanol overnight to yield PTZ-NH2. PTZ-CHO was synthesized through a Duff reaction, i.e., the hexamine aromatic formylation, by dissolving PTZ with hexamine in an acetic acid solution and reflux overnight.33 Further, PTZ-CHO was converted to PTZ-CN via an improved Schmidt conversion34 by dissolving purified PTZ-CHO with sodium azide in acetonitrile and add triflic acid during fast stirring. The synthesis of PTZ-OMe was performed from a mixture of 4-methoxyaniline and bromobenzene in dry toluene through a palladium-catalyzed coupling reaction to yield DPA-OMe (see Scheme 2),35 which then underwent a ring-closure process by reacting with sulfur and iodine in 1,2-dichlorobenzene overnight to yield PTZ-OMe.32 All five titled compounds were characterized by 1H and 13C NMR (see Synthesis procedure on p.43), and the appearance of five titled compounds were recorded in Figure S7 (Compound appearance on p.42). Single crystal of selective compounds has been successfully obtained.
Absorbance
Prior to experiment, the double-beam spectrophotometer (U3310, manufactured by Hitachi) were turned on to allow the lamps to reach a stable condition. Two quartz cuvettes (dimension: 1×1×4.5 cm, manufactured by Purshee Experiment in China) were cleaned with acetone, dried by hair blower, and whipped with acetone-damped Kimwipe. In the sample compartment of, both reference slot and sample slot were placed with quartz cuvette, and filled with desired solvent to half-full. Parameters, set in Method section of the program, were configured to allow U3310 to scan from 900 nm to 300 nm at a 600 nm/min speed. After baseline, the pure solvent was measured without any modification to ensure the baseline correction is good. Then, the sample that were dissolved in desired solvent in advanced were added into the cuvette in the sample slot. The absorbances at intend excitation wavelength, as shown in Table 1, usually around the first absorption peak (longest in wavelength), were adjusted in a range of 0.10 to 0.11 for quantum yield analysis. For lifetime measurement and better absorption and photoluminescence spectrum, the absorbance was adjusted between 0.30 and 0.5.
Table 1. Excitation wavelength and standard dye of titled molecules
Titled molecule Excitation wavelength (nm) Standard dye (CAS #)
PTZ-NH2, PTZ-OMe, PTZ 320 POPOP (1806-34-4)
PTZ-CN 380 C480 (171615-15-9)
PTZ-CHO, PTZ-NO2 430 DCM (51325-91-8)
Photoluminescence
Before experiment, lamp and detector cooler of FS980 were turned on, slits were set at desired values, and suitable filter were selected to reduce second harmonic signal. Sample dissolved in desired solvent with reasonable concentration were placed in fluorescence spectrometer (FS980, manufactured by Edinburgh Instruments). Excitation wavelength were chosen at the peak wavelength of the first
absorption peak. For example, PTZ has its absorption spectrum peaks at 318 nm when using cyclohexane as solvent. Therefore, the concentration was adjusted at U3310 so that the absorbance at 320 nm is in a range of 0.10 to 0.11. In FS980, PTZ was excited at 320 nm, and scan from 310 nm to 630 nm, which included the excitation peak to ensure its correct, and 630 nm is 10 nm less than twice of the excitation wavelength to avoid second harmonic signal. To scan beyond 630 nm, a 380 nm long-pass filter was place between the sample and the detector to block the excitation light scatters onto the detector and generate second harmonic signal.
Quantum yield
The two common methods to measure quantum yield are integrating sphere method and comparative method, we adapted the latter one. Suitable standard dyes that possess emission at similar wavelength band to the sample were chosen, as shown in Table 1. The concentration of sample and dye were adjusted in a range of 0.10 to 0.11. The absorbance spectrum and photoluminescence spectrum of dye and sample were both measured on the same day under the same condition (temperature, slit, filter, etc.). The calculation of quantum yield is based on the following equation:
ϕ(S)
Abs(S)∙ Area(S)∙ n(S)2 = ϕ(R)
Abs(R)∙ Area(R)∙ n(R)2 Eq. 1
, where 𝜙 is the quantum yield, 𝐴𝑏𝑠 is the absorbance at the excitation wavelength, 𝐴𝑟𝑒𝑎 is the integrated area of photoluminescence intensity to wavenumber (cm−1), and 𝑛 is the reflection index of the solvent used. The subscript (𝑆) and (𝑅) represent sample and reference dye, respectively. In Eq. 1, only 𝜙(𝑆), the quantum yield of sample, is unknown, so it can be calculated.
Time-Correlated Single Photon Counting (TCSPC)
A 532 nm 80 MHz green pulse laser was generated by Millennia eV (manufactured by Spectra-Physics), a DPSS (diode-pumped solid-state) laser. The laser then passed through Tsunami (manufactured by Spectra-Physics), a flexible, high performance, ultrafast Ti:Sapphire oscillator, which offer the tuning range of 700 nm to 1080 nm. We used the 720 nm to generate the second harmonic frequency at 360 nm for the experiments in this work. 80 MHz of pulse laser only allow a measurement window of 12.5 ns;
therefore, the 80 MHz 360 nm pulse laser then passed through Model 3980 (manufactured by Spectra- Physics), a pulse-selector that is able to reduce the frequency down to 8 MHz. Sample were dissolved in desired solvent with proper concentration (absorbance around 0.3 at excitation wavelength) and put into the sample holder. The laser passes through several adjusting mirrors and illuminate the sample.
Emission was collected at a 90° angle with respect to the laser, and a 420 nm long-pass filter were placed between the sample and the detector. The detector was a MCP-PMT (microchannel plate photomultiplier tube), R3809U-50 (manufactured by Hamamatsu Photonics, assembled by Edinburgh Instruments). The collected data were fitted by Edinburgh’s software.
Extinction coefficient
According to Beer-Lambert’s law, absorbance (A) equals to the product of extinction coefficient (𝜀 in M−1cm−1), cuvette length (b in cm), and concentration in (c in M), as shown in Eq. 2.
A = ε b c Eq. 2
Prior to experiment, a 20 ml volumetric flask was cleaned by soap water followed by acetone, and left dry in atmosphere. One can never dry volumetric container in an oven or use hair blower, since the heat will distort the glass and change the calibrated volumes.
A small amount (1.0 to 10.0 mg) of purified compound in powder form was weigh preciously in a 20 ml volumetric flask and dilute with desired solvent (toluene) to calibration line. The best electrical balance
in our lab has a readability of 0.1 mg; therefore, this step is critical since only two digits can be measured.
If I use a larger volumetric flask (e.g. 200 ml), the measurement of compound weight is more precise.
However, it cost 10.0 to 100.0 mg of compound to do this experiment.
If compound hadn’t fully dissolved when about 80% of the solvent was added, ultrasound was used to assist the dissolve process. Certain amount of solvent and compound solution were transferred into empty cuvette using micropipette of 100 μL and 1000 μL to achieve a dilution ratio of 1/21 and 1/31. The absorbance from several measurements were recorded, and an extinction coefficient of certain value can be calculated.
Thermal vapor deposition
Thermal vapor deposition was performed by my colleague, Zhi-Xuan Huang, who was a first-year master student in our group as I wrote this thesis.
Six pieces of alkali-free glasses was cleaned ultrasonically; firstly, brush the glasses as vigorously as possible and then ultrasonicated with detergent water, acetone, isopropanol, deionized water sequentially and each for 20 min. Following the cleaning step, dry the cleaned glasses with strong nitrogen gas flow.
Last, the glasses were treated with UV Ozone plasma for 15 min before vapor deposition.
The inner walls of vacuum deposition machine were covered with Al foil to prevent cross contamination.
Approximately 10 mg of PTZ-NO2 powder was transferred to the cleaned quartz crucible as source material, which is then placed on the filament heater inside the chamber. Six pieces of alkali-free glasses were placed on the substrate rotor with a rate of 20 rpm. Vacuum environment was established by two- stage vacuum system. First stage is mechanical pump, which decreased the pressure down to 10-2 torr or further, and turbo pump would turn on automatically to further reduce the pressure to 10-6 torr. After the desired vacuum is completed, Source substrate was heated by 20 amps of current at 1 volt, which heated the compound to 50°C. The deposition rate of such organic compound was usually range from 0.3 to 0.5
Å /s. To ensure packing stability, we set the deposition rate to 0.3 Å /s. Therefore, it took 10000 s to deposit a 300 nm film.
Thickness monitoring was fulfilled by quartz crystal resonator which was based on piezoelectric effect.
A quartz crystal that were placed near the substrate was applied with a free-running RF voltage and it starts vibrating at its natural frequency. As more and more substrate deposited onto the crystal, its natural frequency decrease. This response can be modeled by a mathematical relationship, and the thickness of the sample substrate can be calculated.
Results and Discussion
Structural Characterization
Single crystal of PTZ-OMe, PTZ, PTZ-CHO, and PTZ-NO2 has been successfully obtained and analyzed with Xcalibur, Atlas, Gemini ultra diffractometer. Detailed crystallography data were included in SI (See Crystal data and structure refinement on p. 60). The crystal of PTZ-OMe and PTZ are both monolithic with a space group of P21/c; the crystal of PTZ-NO2 and PTZ-CHO are both orthorhombic with a space group of Pna21. PTZ-NO2 has a Herringbone packing,36 which indicates that there is a strong π-π interaction between different layers in solid state.
Solid state photophysical property of PTZ-NO
2As shown in Figure S28 (p. 67), the strong π-π interaction caused by the Herringbone packing absorbs a significant amount of light, making the solid powder appears to be black (Figure S7 on p.42).
Additionally, as shown in Figure S8(c) on p. 42, thin film of PTZ-NO2 made via thermal deposition appears to be purple, which corresponds to its solid absorbance peaks at 530 nm. Last, with in-built Xe light source or external laser, neither thin film or powder of PTZ-NO2 shows meaningful fluorescence peaks in visible and IR regime. Therefore, PTZ-NO2 is almost non-fluorescent in solid state.
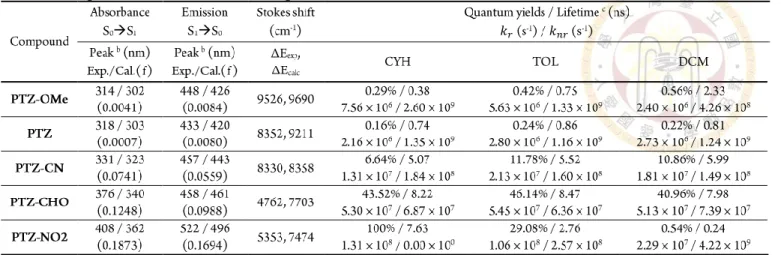
Table 2. Experimental and calculated optical characteristics for the titled molecules a
→ → 𝑘𝑟 𝑘𝑛𝑟
c Lifetime were measured by TCSPC and excited at 360 nm for all five compounds.
Photophysical properties
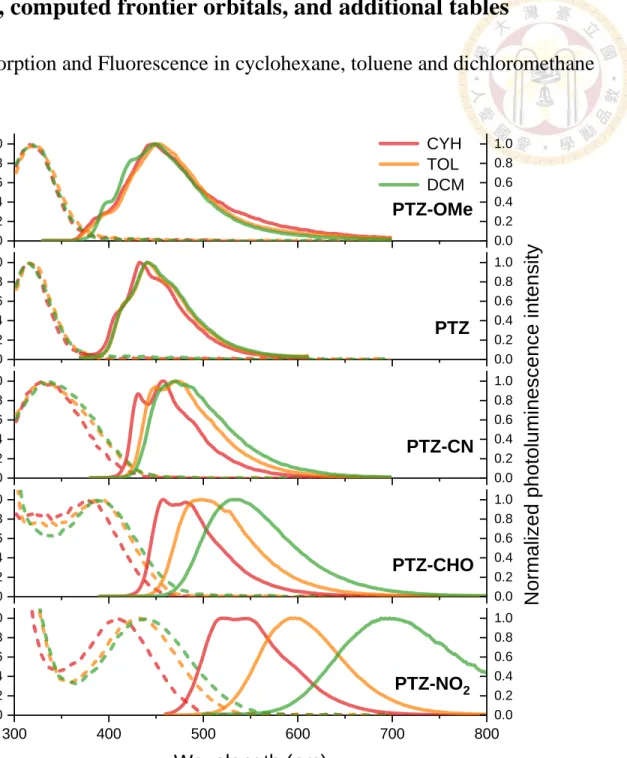
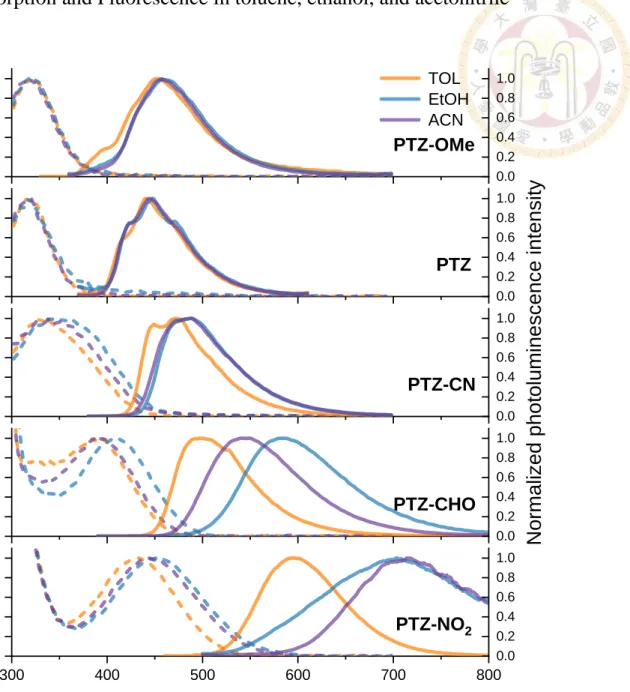
The steady-state absorption and emission spectra of the title compounds in three solvents, cyclohexane (CYH), toluene (TOL) and dichloromethane (DCM), are depicted in Figure 1 (p. 34), and in other solvents, toluene (TOL), ethanol (EtOH), and acetonitrile (ACN), are depicted in Figure 2 (p. 35). The selected photophysical properties are summarized in Table 2 (p. 25), Table S1 (p. 36), and Table S2 (p.
41).
As shown in Figure 1 (p. 34), the absorption peak of the EDG substituted PTZ-OMe around 320 nm can be ascribed to the π-π* transition of PTZ chromophore. Further, the emission peaks of PTZ-OMe are not varied by employing different polarity solvents and show mirror-imagined emission with respect to the lowest lying absorption band, affirming the locally excited (LE) emissive character with vibronic profile. Similar results can be observed in PTZ with absorption maximum at 320 nm and vibronic progressive emission maximized at 440 nm in all three solvents.
In sharp contrast, as substituted by the EWG at the C3-position, PTZ-CN shows a red-shifted absorption peak around 340 nm (cf. PTZ). By varying the solvent polarity, the emission peaks of PTZ-CN are observed at 450, 460 and 470nm in cyclohexane, toluene and dichloromethane solutions, respectively,
revealing solvatochromism effect. The result clearly indicates that the lowest lying electronic transition of PTZ-CN is no longer dominant by the LE transition but incorporates with noticeable CT transition.
The observation is further supported by introducing formyl and nitro EWGs. For PTZ-CHO, the wavelength of the longest absorption tail (shoulder) is apparently red shifted upon increasing solvent- polarity, showing a typical character of intramolecular charge transfer (ICT) absorption band.
Furthermore, the emission peaks are recorded at 470, 510, and 540 nm in cyclohexane, toluene, and dichloromethane solutions, respectively. More impressively, PTZ-NO2, having its strongest electron withdrawing -NO2 group, the emission band is red shifted from 540 nm in cyclohexane to as far as 700 nm in CH2Cl2, showing the most prominent excited-state ICT character. Hence, the strength of ICT effect of non-substituted and substituted PTZ analogies, based on the result of solvatochromism, is increased in the order of PTZ-OMe ≈ PTZ < PTZ-CN < PTZ-CHO < PTZ-NO2, which correlates well with the electron withdrawing strength of the substituent. The transformation from LE to CT character is further supported by the frontier orbital analyses elaborated in the section of computational approaches (vide infra).
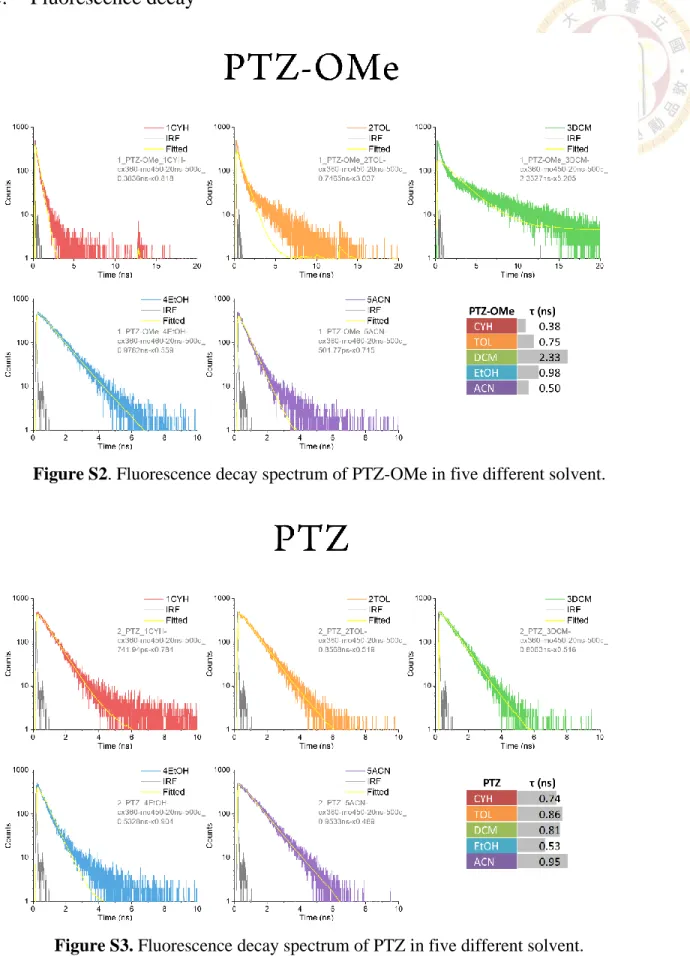
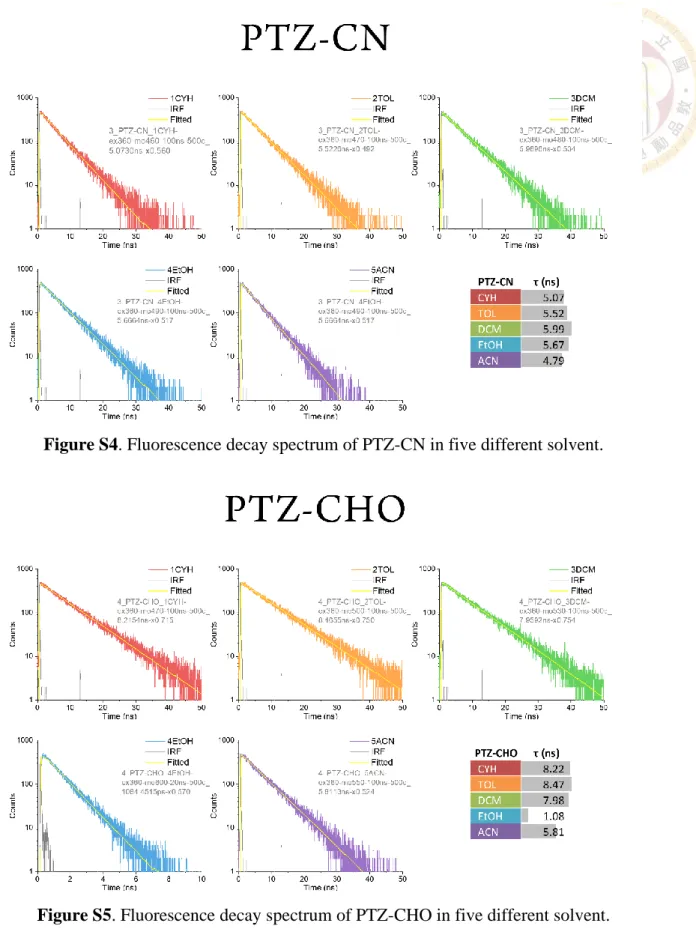
The above results, though intriguing, may not be surprising in terms of interconversion between LE and CT states. What is even more important, to our viewpoint, is that the corresponding PLQY increases significantly from EDG to EWG substituted PTZ. For example, it is widely accepted that -NO2 is a strong fluorescent quencher owing to its high energy level of nonbonding orbital with lone pair electrons (vide supra). To our surprise, however, PLQY of PTZ-NO2 is nearly 100% in the nonpolar solvents such as cyclohexane, which is in sharp contrast to the rather low PLQY for PTZ (0.16%) or PTZ-OMe (0.29%) in the same solvent (see Table 2 on p. 25). To gain further insight, the fluorescence decay dynamics were measured by time-correlated single photon counting (TCSPC). The photoluminescence decays for all title compounds in various solvents are shown from Figure S2 (p. 38) to Figure S6 (p. 40) with pertinent data listed in Table 2 (p. 25). As a result, PLQY can be expressed as PLQY = 𝑘𝑟⁄ 𝑘𝑜𝑏𝑠 = 𝑘𝑟⁄ (𝑘𝑟+ 𝑘𝑛𝑟) where 𝑘 , 𝑘 and 𝑘 denote the experimentally observed decay rate constant, the radiative decay rate
constant and the non-radiative decay rate constant, respectively. Combing PLQY and 𝑘𝑜𝑏𝑠 acquired experimentally, 𝑘𝑟 and 𝑘𝑛𝑟 can thus be deduced and listed in Table 2 (p. 25). As shown in Table 2, in a qualitative manner, it seems that increase of the electron withdrawing strength of substituent causes the increase of kr but decrease of 𝑘𝑛𝑟. For example, 𝑘𝑟 of PTZ radiative decay rate is calculated to be 2.2 × 10⁶ s-1, which is ~60 times as small as that of 1.3 × 10⁸ s-1 in PTZ-NO2. This, together with the largest 𝑘𝑛𝑟 of 1.3 × 10⁹ s-1 for PTZ in cyclohexane, leads to its relatively much weaker emission compared with the PTZ-EWG molecules. In fact, 𝑘𝑟 of 2.2 × 10⁶ s-1 in PTZ manifests its forbidden-like lowest lying transition. Moreover, 𝑘𝑟 increases as increasing the electron withdrawing strength (see Table 2 on p. 25), indicating the more allowed lowest-lying transition. The results, on the one hand, implies increasing energy of the forbidden nπ* character upon increasing the electron-withdrawing strength, proving the concept of lifting the nπ* transition (vide supra) that is separated from the ππ* state. On the other hand, in cyclohexane, the decrease of 𝑘𝑛𝑟 may imply the more planar of the PTZ moiety upon increasing the CT property. Support of these viewpoints is elaborated in the section of theoretical approach.
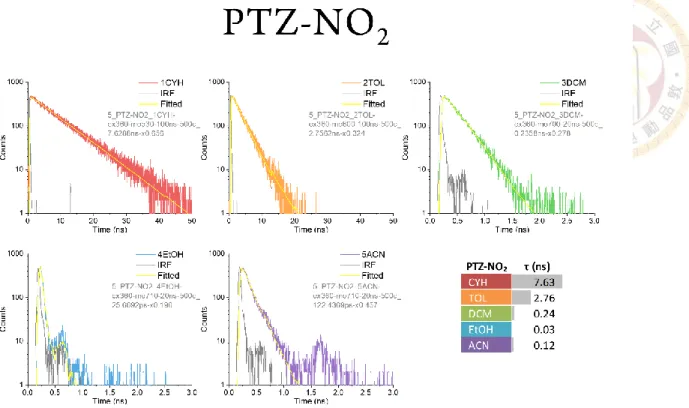
The above results and discussion are in the nonpolar solvent. In polar solvent, much decrease of PLQY for the PTZ-EWG molecules was observed upon increasing the solvent polarity (see Table 2 on p. 25).
Especially, for PTZ-NO2, PLQY decreases from 100% in cyclohexane to 0.54 % in CH2Cl2. Knowing that emission of PTZ-NO2 has been red shifted to 700 nm, another non-radiative decay channel, i.e., the quenching of the S1 electronic wave function by the overlap with ground-state high-frequency vibrational modes, is expected to be dominant. This so-called quenching rate operated by the energy gap law increases with decreasing energy gap, rendering the low PLQY in high polar solvent.37-40
Cyclic voltammetry analysis
Cyclic voltammetry (CV) analysis was also conducted to verify their intrinsic electronic properties, for which the corresponding CV diagram are shown in Figure S21 on p. 55 and the numeric data are organized in Table 3. In the CV analysis, Ag/Ag+ (0.01M AgNO3) electrode was selected as a reference electrode. The oxidation potentials were measured using a platinum (Pt) and glassy carbon electrode, respectively. Both experiments were conducted with 0.1 M of NBu4PF6 in dichloromethane and a gold wire with 0.1 M of NBu4PF6 in tetrahydrofuran as working electrode. The potentials were further referenced externally to the ferrocenium/ferrocene (Fc+/Fc) couple.
Table 3. Electrochemical properties and free energy of photoinduced electron transfer of the three entitled molecules with charge transfer.
Compound 𝐸𝑜𝑥𝑖𝐷 (V) 𝐸𝑟𝑒𝑑𝐴 (V) HOMO (eV) LUMO (eV) ∆G 𝑘𝑐𝑎𝑙 𝑚𝑜𝑙⁄
PTZ-OMe 0.49 -2.12 -4.80 -1.85 2.01
PTZ 0.63 -2.02 -4.94 -1.99 3.16
PTZ-CN 0.83 -2.12 -5.14 -2.19 -8.77
PTZ-CHO 0.80 -1.68 -5.12 -2.16 -13.69
PTZ-NO2 0.84 -1.00 -5.16 -2.20 -21.22
𝐸𝑜𝑥𝑖𝐷 and 𝐸𝑟𝑒𝑑𝐴 are anodic and cathodic peak potentials using Fc+/Fc as reference. HOMO =
−(4.8 + 𝐸𝑜𝑥𝑖𝐷 − 𝐸𝑜𝑥𝑖𝐹𝑐) and LUMO = HOMO + 𝐸𝑜𝑛𝑠𝑒𝑡𝑃𝐿 , where 𝐸𝑜𝑛𝑠𝑒𝑡𝑃𝐿 is the energy converted from the wavelength of onset of PL spectra, which is 420 nm is our case. Free energy, ∆G𝑃𝐸𝑇, is calculated by the following equation based on Marcus theory.
As tabulated in Table 3, the recorded HOMO are gradually shifted to the more negative side in an order of PTZ-OMe (-4.8 eV) > PTZ (-4.9 eV) > PTZ-CN (-5.1 eV) ≈ PTZ-CHO (-5.1 eV) > PTZ-NO2 (-5.2 eV), which is consistent with the overall trend of electron donor capability (EDG > non-substituted >
EWG). Moreover, as we computed the energy levels of LUMOs by adding the energy gap of the absorption onset, we obtained the associated values in an order of PTZ-OMe (-1.50 eV) > PTZ (-1.53 eV) > PTZ-CN (-2.30 eV) > PTZ-CHO (-2.48 eV) > PTZ-NO2 (-2.84 eV) as shown in Table 3, which was correlated (in a reverse manner) with the sequence of the HOMO and electron donor capability. In this regard; on the one hand, CV analysis verifies our observation from computational approaches (vide
supra) and gives a direct evidence that the EWGs strongly lower down the energy level of the frontier orbitals in the substituted aromatic ring. On the other hand, the modifications in energy levels of LUMOs are believed to have a major effect to the π* orbitals, in which the decreased energies may make the mixing of nonbonding orbitals of sulfur atom and π orbitals of the aromatic ring energetically unfavorable.
Computational approaches
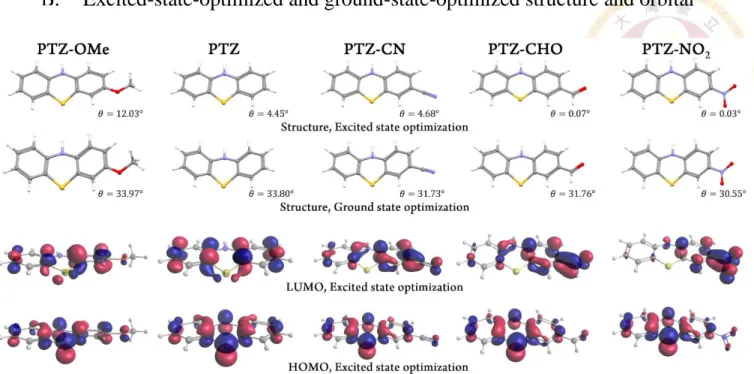
To gain in-depth insight into the electronic transition character of the title molecules, computational approaches were conducted using time-dependent density functional theory (TD-DFT) on the basis of m062x functional associated with 6-31+G(d,p) basis sets (see Supplementary Information on p. 42 for details). Although b3lyp is more widely accepted for calculation of charge transfer cases, the absorbance and emission wavelength calculated with m062x shown less deviation from the experimental result. Thus, we provided the result of m062x in manuscript, and attached the results of both m062x and b3lyp in the SI. The computed energy gaps and the associated frontier orbitals are recorded in Table 2 (p. 25) and Figure 3 (p. 37). After geometric optimization in their ground states (S0), the title molecules all exhibit a bending type geometry owing to the existence of the electron-sufficient sulfur atom as shown in Figure 3. However, as we defined the bending angle (θ) as the angle intercepted by the two planes averaged from the six carbons on both side of the six-membered ring of phenothiazine, there exists a trend toward planarization in ground state optimized structure, which the angle is in the order of PTZ-OMe > PTZ >
PTZ-CN ≈ PTZ-CHO > PTZ-NO2. The EWG reduce the electron density on sulfur atom, which decrease the size of its lone-pair, causing the bending angle to decrease. Moreover, the highest occupied molecular orbitals (HOMOs) of the title molecules are mainly localized at the middle of PTZ core as shown in Figure S22 on p. 59.
With an aim to investigate their emissive properties, we then conducted the geometric optimization in their lowest lying excited state (S1), their relative structural characters and frontier orbitals are shown in Figure 3 (p. 37) and Figure S22 to Figure S24 (p. 59), respectively.41 As shown in Figure 3, the lowest unoccupied molecular orbitals (LUMOs) of the EDG substituted PTZ-OMe and parent PTZ are still mainly localized on the PTZ main core, revealing a LE transition character. More importantly, the contribution of the nonbonding orbitals from the sulfur atom is non-negligible in their LUMOs. The
results indicates that the lowest lying transition contains ππ* overlapping with certain degrees of non- bonding character from sulfur atom.42 In sharp contrast, upon introducing EWGs on PTZ, the energy level of the substituted aromatic rings decreases, resulting in the lower energy of HOMO compared with the non-substituted PTZ. From another perspective, the EWGs make the substituted six-membered ring mainly contributing to LUMOs, diminishing the mixing between ππ* and nπ* states. Accordingly, LUMOs of EWG substituted analogies (PTZ-CN, PTZ-CHO and PTZ-NO2) are mainly ascribed to the substituted functional groups; the net results reveal CT character.
Combine the above results, the rationalization of the transformation from LE to CT character may be offered in a quantitative manner based on the Marcus-Weller equation expressed below (eq. 1) to deduce the associated free energy (∆G) of charge transfer in the excited state.43. The equation is listed below:
∆𝐺 = 𝐸𝑜𝑥𝑖𝐷 − 𝐸𝑟𝑒𝑑𝐴 − 𝐸00− ( 𝑒2
4𝜋𝜀0𝜀𝑠𝑟𝑐) − (𝑒2
8𝜋𝜀0) (1
𝑟𝐷++ 1
𝑟𝐴−) ( 1
𝜀𝐷𝐶𝑀−1
𝜀𝑠)
where 𝐸𝑜𝑥𝑖(𝐷) and 𝐸𝑟𝑒𝑑(𝐴) are the oxidative and reductive potential, respectively, measured by cyclic voltammetry; 𝐸00 are recorded from the 0-0 transition of the title molecules where charge transfer process start to take place; 𝜀0, 𝜀𝑠, and 𝜀𝐷𝐶𝑀 are dielectric constants in vacuum, desired solvent and dichloromethane, respectively; 𝑟𝑐 are recorded the distance between donor and acceptor; 𝑟𝐷+ and 𝑟𝐴− are the ionic radii of donor and acceptor, respectively. The definitions of 𝑟𝑐, 𝑟𝐷+, and 𝑟𝐴− are visually shown in Figure S24 (p. 59). Though it is not common to adapt this equation that were originally designed for photoinduced electron transfer (PET) to our charge transfer (CT) case, we found the result quiet convincing.
Employing all the recorded values to eq. 1. The corresponding ∆G for undergoing charge transfer are recorded in Table 3 on p. 28. Accordingly, ∆G for the title molecules are in the order of PTZ (3.16 kcal/mol) > PTZ-OMe (2.01 kcal/mol) > PTZ-CN (-8.77 kcal/mol) > PTZ-CHO (-13.69 kcal/mol) >
PTZ-NO2 (-21.22 kcal/mol). It is thus reasonable to expect that the exergonicity of the title molecules undergoing charge transfer follow the order of PTZ-OMe ≈ PTZ < PTZ-CN < PTZ-CHO < PTZ-NO2.
Additionally, it is worth to note that the uncertainty of this assessment should be appreciable in recording the emissive energy gap in solution and CV potentials. Also, the definition of 𝑟𝐷+ and 𝑟𝐴− is ambiguous, which is only localized at the donor and acceptor sites. Nevertheless, PTZ-OMe and PTZ show positive
∆G, which indicates that the CT process is thermodynamically unfavorable, consisting with their LE emission concluded experimentally. On the contrary, the experimentally estimated ∆G of the EWG substituted PTZ analogies are all negative, indicating the accessibility of charge transfer process and resulting the CT emission. The trend of the exergonicity correlates with the experimental results.
Last but not the least, it is worth to note that upon geometric optimization in their excited states, PTZ core may undergo certain degrees of excited state structural planarization to enhance its π-conjugation, which is a general observation in PTZ and other heterocyclic derivatives such as phenazine.41 Accordingly, the more planar configuration upon increasing the electron withdrawing group (see Figure S22 on p. 59) gives less twisted motion, and hence the decrease of non-radiative decay rate, rationalizing the ~100% PLQY for PZT-NO2 in the nonpolar solvent.
Conclusion
In conclusion, a series of PTZ analogies were strategically designed and synthesized in an aim to boost the emission intensity. PTZ and the EDG substituted PTZ-OMe exhibit partially forbidden transitions because their π* are mixed with nonbonding orbitals on S atom. This, together with nonplanar structure that activates the twisting non-radiative deactivation, rationalizes their weak emission. Conversely, introducing EWGs lowers the energy level of LUMO and diminish the mixing of nonbonding orbitals to facilitate the allowed π--π* transition. Also, the EWGs substitution induces excited-state charge transfer, which suppresses the twisting non-radiative deactivation to enhance the emission. Among them, a widely considered fluorescent quencher functional group (-NO2) was also employed in this work. PTZ-NO2
exhibits brilliant photophysical properties with 100% Q.Y. in nonpolar solvents (e.g., cyclohexane), which also shows significant solvatochromism in polar solvents, covering the visible region from 500 to 700 nm.
Spectra, computed frontier orbitals, and additional tables
Absorption and Fluorescence in cyclohexane, toluene and dichloromethane
0.0 0.2 0.4 0.6 0.8 1.0
0.0 0.2 0.4 0.6 0.8 1.0
0.0 0.2 0.4 0.6 0.8 1.0
0.0 0.2 0.4 0.6 0.8 1.0
300 400 500 600 700 800
0.0 0.2 0.4 0.6 0.8 1.0
PTZ-OMe CYH TOL DCM
PTZ
Ab sorbance ( a.u.)
PTZ-CN
PTZ-CHO
Wavelength (nm)
PTZ-NO2
0.0 0.2 0.4 0.6 0.8 1.0
0.0 0.2 0.4 0.6 0.8 1.0
0.0 0.2 0.4 0.6 0.8 1.0
Normali ze d ph otol umine sc enc e i nten si ty
0.0 0.2 0.4 0.6 0.8 1.0
0.0 0.2 0.4 0.6 0.8 1.0
Figure 1. Normalized absorption and photoluminescence spectra of five entitled molecules. Notes that red, yellow, and green lines represent toluene (TOL), ethanol (EtOH), and acetonitrile (ACN),
respectively.
Absorption and Fluorescence in toluene, ethanol, and acetonitrile
0.0 0.2 0.4 0.6 0.8 1.0
0.0 0.2 0.4 0.6 0.8 1.0
0.0 0.2 0.4 0.6 0.8 1.0
0.0 0.2 0.4 0.6 0.8 1.0
300 400 500 600 700 800
0.0 0.2 0.4 0.6 0.8 1.0
PTZ-OMe TOL EtOH ACN
PTZ
Ab sorbance ( a.u.)
PTZ-CN
PTZ-CHO
Wavelength (nm)
PTZ-NO2
0.0 0.2 0.4 0.6 0.8 1.0
0.0 0.2 0.4 0.6 0.8 1.0
0.0 0.2 0.4 0.6 0.8 1.0
Normali ze d ph otol umine sc enc e i nten si ty
0.0 0.2 0.4 0.6 0.8 1.0
0.0 0.2 0.4 0.6 0.8 1.0
Figure 2. Normalized absorption and photoluminescence spectra of five entitled molecules. Notes that orange, blue, and purple lines represent toluene (TOL), ethanol (EtOH), and acetonitrile (ACN), respectively.
Extinction coefficient in toluene
300 400 500 600 700 800
0 2 4 6 8 10 12 14
Extinction coe fficien t ( 10
3·M
-1·cm
-1)
Wavelength (nm)
PTZ-OMe PTZ PTZ-CN PTZ-CHO PTZ-NO
2In toluene.
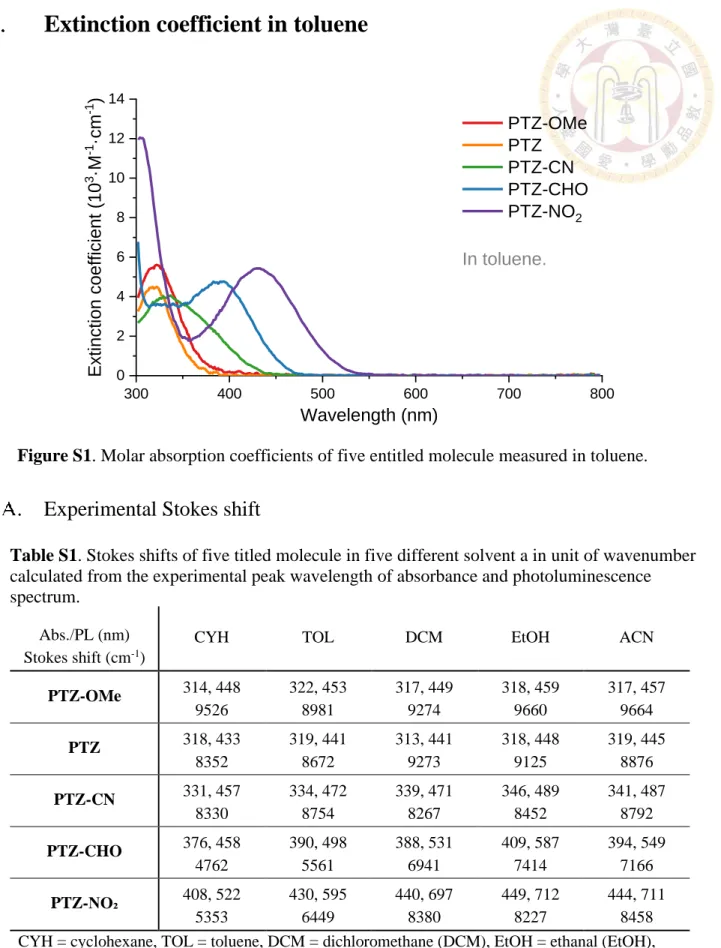
Figure S1. Molar absorption coefficients of five entitled molecule measured in toluene.
Experimental Stokes shift
Table S1. Stokes shifts of five titled molecule in five different solvent a in unit of wavenumber calculated from the experimental peak wavelength of absorbance and photoluminescence spectrum.
Abs./PL (nm) Stokes shift (cm-1)
CYH TOL DCM EtOH ACN
PTZ-OMe 314, 448 9526
322, 453 8981
317, 449 9274
318, 459 9660
317, 457 9664 PTZ 318, 433
8352
319, 441 8672
313, 441 9273
318, 448 9125
319, 445 8876 PTZ-CN 331, 457
8330
334, 472 8754
339, 471 8267
346, 489 8452
341, 487 8792 PTZ-CHO 376, 458
4762
390, 498 5561
388, 531 6941
409, 587 7414
394, 549 7166 PTZ-NO₂ 408, 522
5353
430, 595 6449
440, 697 8380
449, 712 8227
444, 711 8458 CYH = cyclohexane, TOL = toluene, DCM = dichloromethane (DCM), EtOH = ethanal (EtOH), and ACN = acetonitrile.
Excited-state-optimized and ground-state-optimized structure and orbital
Figure 3. Excited-state-optimized structure (1st row), ground-state-optimized structure (2nd row), as well as excited-state-optimized HOMO (3rd row) and LUMO (4th row) orbitals of the titled molecules computed by m062x/6-31+g(d,p) with cyclohexane as solvent.
Fluorescence decay
Figure S2. Fluorescence decay spectrum of PTZ-OMe in five different solvent.
Figure S3. Fluorescence decay spectrum of PTZ in five different solvent.
Figure S4. Fluorescence decay spectrum of PTZ-CN in five different solvent.
Figure S5. Fluorescence decay spectrum of PTZ-CHO in five different solvent.
Figure S6. Fluorescence decay spectrum of PTZ-NO2 in five different solvent.
Quantum yield, Lifetime, and rate constant
Table S2. Excitation, monitoring wavelength as well as quantum yield, lifetime, and rate constate of the entitled molecules.
Compound Solvent a Ex./Mon. b
(nm) Q.Y.c (%) Lifetime d (ns) 𝑘𝑟 (𝑠−1) e 𝑘𝑛𝑟 (𝑠−1) f
PTZ-OMe
CYH TOL DCM EtOH ACN
320 / 450 320 / 450 320 / 450 320 / 460 320 / 460
0.29 0.42 0.56 0.26 0.27
0.38 0.75 2.33 0.98 0.50
7.56 × 10⁶ 5.63 × 10⁶ 2.40 × 10⁶ 2.66 × 10⁶ 5.38 × 10⁶
2.60 × 10⁹ 1.33 × 10⁹ 4.26 × 10⁸ 1.02 × 10⁹ 1.99 × 10⁹
PTZ
CYH TOL DCM EtOH ACN
320 / 450 320 / 450 320 / 450 320 / 450 320 / 450
0.16 0.24 0.22 0.51 0.48
0.74 0.86 0.81 0.53 0.95
5.63 × 10⁶ 2.40 × 10⁶ 2.66 × 10⁶ 5.38 × 10⁶ 2.16 × 10⁶
1.33 × 10⁹ 4.26 × 10⁸ 1.02 × 10⁹ 1.99 × 10⁹ 1.35 × 10⁹
PTZ-CN
CYH TOL DCM EtOH ACN
320 / 460 320 / 470 320 / 480 320 / 490 320 / 490
6.64 11.78 10.86 14.97 11.64
5.07 5.52 5.99 5.67 4.79
2.40 × 10⁶ 2.66 × 10⁶ 5.38 × 10⁶ 2.16 × 10⁶ 2.80 × 10⁶
4.26 × 10⁸ 1.02 × 10⁹ 1.99 × 10⁹ 1.35 × 10⁹ 1.16 × 10⁹
PTZ-CHO
CYH TOL DCM EtOH ACN
380 / 470 380 / 500 380 / 530 380 / 600 380 / 550
43.52 46.14 40.96 6.48 35.42
8.22 8.47 7.98 1.08 5.81
2.66 × 10⁶ 5.38 × 10⁶ 2.16 × 10⁶ 2.80 × 10⁶ 2.73 × 10⁶
1.02 × 10⁹ 1.99 × 10⁹ 1.35 × 10⁹ 1.16 × 10⁹ 1.24 × 10⁹
PTZ-NO₂
CYH TOL DCM EtOH ACN
430 / 530 430 / 600 430 / 700 430 / 710 430 / 710
100 29.08 0.54 0.14 0.35
7.63 2.76 0.24 0.03 0.12
5.38 × 10⁶ 2.16 × 10⁶ 2.80 × 10⁶ 2.73 × 10⁶ 9.57 × 10⁶
1.99 × 10⁹ 1.35 × 10⁹ 1.16 × 10⁹ 1.24 × 10⁹ 1.87 × 10⁹
a CYH = cyclohexane, TOL = toluene, DCM = dichloromethane (DCM), EtOH = ethanal (EtOH), and ACN = acetonitrile. b Ex. is the excitation wavelength for measuring quantum yield. Mon. is the monitoring wavelength when measuring lifetime. c Q.Y. is the quantum yield measured comparatively with POPOP, C480, and DCM as standard dye. d Lifetime were measured with TCSPC and excited at 360 nm for all five compounds. e 𝑘𝑟 is radiative decay rate constant. d 𝑘𝑛𝑟 is non-radiative decay rate constant.
Supplementary Information
Compound appearance
Figure S7. The appearance of entitled compounds under regular indoor light.
Solid spectrum of PTZ-NO
2Figure S8. (a) Absorption spectra of PTZ-NO2 in toluene (brown dash) and in 110 nm film made by vacuum deposition. Orange solid line is the PL spectrum of PTZ-NO2 in s toluene. Green, Blue, and Purple dot lines are PL spectra of PTZ-NO2 in solid film and powder form excited by different light source and collected by different detector. There are no meaningful peaks observed in solid PL spectrum of PTZ-NO2. No florescence when shine with hand-held UV light. (b) Appearance of PTZ-NO2 in toluene. (c) Appearance of PTZ-NO2 in 300 nm thick vacuum deposited film.
Synthesis procedure
1. Synthesis of PTZ-NO2
Scheme S1. Synthetic route of PTZ-NO2.
To the solution of phenothiazine (1 g, 5.02 mmole, 1 equiv.) in the THF (5 ml) and acetic acid (1.5 ml) in the ice bath was added a concentrated solution of sodium nitrite (1.08 g, 15.06 mmole, 3 equiv.) in water (2 ml) dropwise and stirred in the room temperature overnight. After completion of reaction, the reactant was extracted by ethyl acetate and brine. The organic layer was separated, dried over the MgSO4
and concentrated by rotavapor. The crude product could be purified by silica column (ethyl acetate:
hexane = 1: 3 with 1% TEA). The pure product PTZ-NO2 was black powder (3.75 mmole, 0.915 g, 75
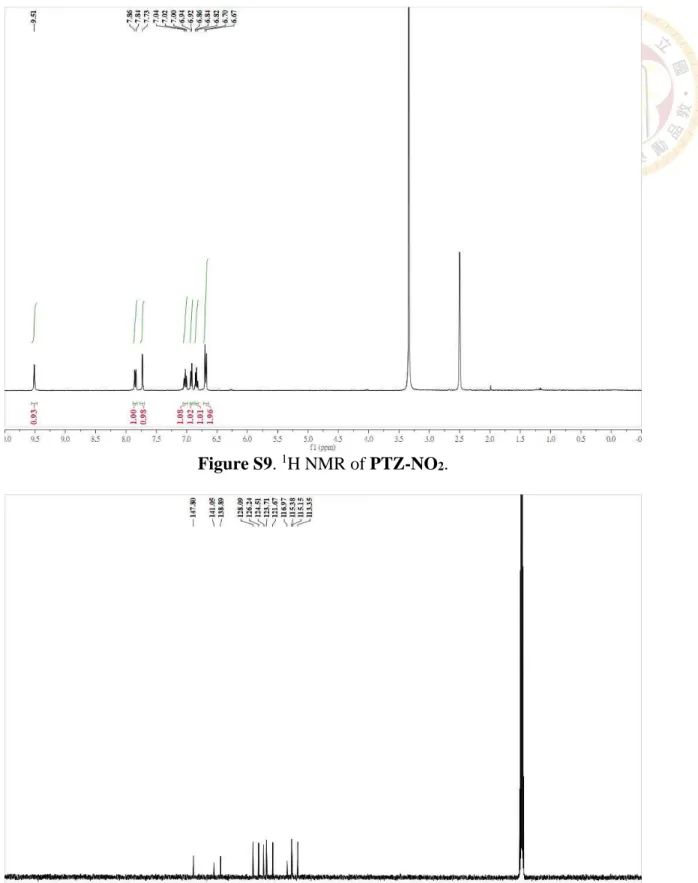
%) mp = 182°C, FT-IR (cm-1): 3475, 3318, 1567, 1537, 1326, 734. 1H NMR (400 MHz, DMSO) δ 9.51 (s, 1H), 7.85 (d, J = 11.4 Hz, 1H), 7.73 (s, 1H), 7.02 (t, J = 7.6 Hz, 1H), 6.93 (d, J = 7.7 Hz, 1H), 6.84 (t, J = 8.0 Hz, 1H), 6.69 (d, J = 8.9 Hz, 2H). 13C NMR (101 MHz, DMSO) δ 147.75, 140.97, 138.79, 128.16, 126.27, 124.68, 123.66, 121.60, 116.92, 115.41, 115.25, 113.35. HRMS (ESI-TOF) m/z: [M+H]+ Calc’d for C12H8N2O2S [245.03]; Found 245.03.
Figure S9. 1H NMR of PTZ-NO2.
Figure S10. 13C NMR of PTZ-NO2.
2. Synthesis of PTZ-NH2
Scheme S2. Synthetic route of PTZ-NH2.
To the solution of 3-nitrophenothiazine (0.3g, 1.23mmole, 1equiv.) in the ethanol 12 ml and water (3ml), Fe (0.69g, 12.3mmole, 10equiv.) and NH4Cl (0.26g, 4.92mmole, 4equiv.) were added. The system was heated to 80oC and reacted for 6 hours. After completion of reaction, the reaction solution was evaporated by rotavapor and then extracted with ethyl acetate and brine. The organic layer was separated, dried over MgSO4 and concentrated by rotavapor. The crude product could be purified by silica column (ethyl acetate: hexane= 1: 1). The pure product PTZ-NH2 was black powder (0.184g, 0.86mmole, 70%). mp = 134-136oC. FT-IR (cm-1): 3436, 2063, 1638, 1475, 1315, 739. 1H NMR (400 MHz, DMSO) δ 8.08 (s, 1H), 7.00 – 6.91 (m, 1H), 6.87 (d, J = 9.1 Hz, 1H), 6.67 (d, J = 7.5 Hz, 1H), 6.62 (d, J = 7.9 Hz, 1H), 6.44 (d, J = 8.3 Hz, 1H), 6.31 – 6.18 (m, 2H), 4.65 (s, 2H). 13C NMR (101 MHz, DMSO) δ 143.77, 143.34, 131.72, 127.22, 126.10, 120.60, 116.80, 116.02, 115.15, 113.91, 113.20, 111.67. m/z: [M+H]+ Calc’d for C12H8N2O2S [214.06]; Found 214.06.
Figure S11. 1H NMR of PTZ-NH2.
Figure S12. 13C NMR of PTZ-NH2.