國立臺灣大學生物資源暨農學院農業經濟學系 碩士論文
Department of Agricultural Economics College of Bio-Resources and Agriculture
National Taiwan University Master Thesis
布吉納法索出口芝麻的績效與因素
Sesame Seed Exports in Burkina Faso: Performance and Determinants
艾書立
Kafando Wendata Achille
指導教授:張靜貞 博士
Advisor: Ching-Cheng, Chang Ph.D.
中華民國 108 年 3 月 March, 2019
i
Acknowledgments
“When times are good, be happy; but when times are bad, consider: God has made the one as well the other. Therefore, a man cannot discover anything about his future”
(Ecclesiastes 7, 14). Praise be to the Almighty God for the live He has given to me.
I am profoundly grateful to Professor Ching-Cheng Chang and Professor Shih-Hsun Hsu for their advices, orientations and suggestions throughout the completion of this research. They have been an inestimable support and more than advisors to me. This has marked my life in Taiwan, and for me, it will be an unforgettable memory for the rest of my life.
I would like to especially thank Professor Shih-Hsun Hsu, Professor Deng-Hsing Huang and Professor Chia-Sheng Hsu who have been the committee members for their insights, which contributed significantly to complete this work.
I am also grateful to all the department professors for their training and kindness, which prepared me to be a master.
I would like also to thank the administration staff of the department and my classmates for their help throughout the process of this thesis.
Finally, I am most grateful to my parents, brothers and sisters for their daily love and prayers. They are the source of my force and determination.
“Goal-Determination-Humility-Love”
Table of Contents
Acknowledgments ... i
Table of Contents ... ii
List of Tables ... iii
Abbreviations ... iv
Abstract v Chapter I: Introduction ... 1
1.1 Introduction ... 1
1.2 Background and Motivations ... 1
1.3 Objectives and Outline ... 5
Chapter II: An overview of sesame seed production and trade across the world ... 6
2.1 Agronomic practices, different uses and worldwide trend of sesame seed Production ... 6
2.2 World Major Exporters and Importers of sesame seed ... 9
2.3 Sesame seed sector in Burkina Faso ... 11
2.4 Market Opportunities and Tariff Advantages for BFA... 14
Chapter III: Literature review ... 16
2.1 Theoretical modeling on export determination ... 16
2.2 Empirical modeling on agricultural exports ... 17
2.3 Factors affecting agricultural exports in Sub-Saharan Africa... 19
Chapter IV: Research Methodology and Data ... 23
4.1 Analytical Framework ... 23
4.2 Empirical Model Specification and Definition of Variables ... 24
4.3 Regression Technique: Johansen Co-integration approach ... 26
4.4 Sources and Descriptive Statistic of the data ... 29
Chapter V: Empirical Results and Discussion ... 32
5.1 Empirical Results ... 32
5.2 Interpretation of the VECM Results and Discussion ... 33
iii
5.7 Granger Causality-Wald Test within the VECM ... 38
Chapter VI: Conclusions and Policy Recommendations ... 43
6.1 Concluding remarks ... 43
6.2 Policy Recommendations ... 43
6.3 Limitation of the study and Areas for future research ... 45
References ... 47
Appendix ………53
List of Tables Table 1. Sesame export quantities and values of BFA (2012-2016) ... 4
Table 2. Worldwide Trend of Sesame Production and Major Producers 2007-2016 ... 8
Table 3. World export volume and major exporters of sesame seed between 2007 and 2016 ... 10
Table 4. World import and major importers of sesame seed between 2007 and 2016 ... 10
Table 5. BFA's sesame production trend from 2007 to 2016 ... 12
Table 6. Trend of BFA's sesame seed export from 2007 to 2016 ... 13
Table 7. Major market destinations of BFA's sesame seed from 2007 to 2016 ... 14
Table 8. Target markets tariffs on sesame seed ... 15
Table 9. Statistical Description of the data ... 31
Table 10. Stationary test at level form I (0) ... 39
Table 11. Stationary test result at first difference I (1) ... 40
Table 12. Results of Johansen's Co-integration test ... 41
Table 13. The short-run dynamics of the VECM ... 41 Table 14. Long-run results of the VECM ... 42 Table 15. Granger Causality-Wald Test results ... 42
Abbreviations
AGR Average Growth per year
AGSDS Accelerated Growth and Sustainable Development Strategy BFA Burkina Faso
CEP Comparative Export Performance ECT Error Correction Term
FAO Food and Agriculture Organization FCFA Burkina Faso Currency
GDP Gross Domestic Product
INSD National Institute of Statistics and Demography (Burkina Faso) Log Natural logarithm
NPESD National Program of Economic and Social Development OLS Ordinary Least Square
SSA Sub-Saharan Africa
SAP Structural Adjustment Program
v
SFCP Strategic Framework to Combat Poverty
UNCTAD United Nations Conference on Trade and Development USD United State Dollar
VAR Vector Auto-Regressive
VECM Vector Error Correction Model
WAEMU West African Economic and Monetary Union
Abstract
Following recent tremendous growth in volume and value of sesame seed exports from BFA, and with an unequaled performance observed, we deemed it necessary to identify through a co-integration approach the effects of key determinants and their magnitude on sesame exports performance. Purposely, this thesis specified export earnings of sesame seed as the independent variable to analyze the country export performance using time series data for the period of 47 years (1970-2016). One co- integration vector is observed in the system. Thereby the Vector Error Correction Model (VECM) is performed in order to tie the short-run dynamics to the long-run equilibrium.
The empirical results reveal that nominal exchange rate, producer price, world export volume of sesame seed as a proxy of world demand, and world export price are key factors affecting the country’s exports performance in the short-run. Moreover, the empirical results show that nominal exchange rate, the production, producer price and world demand are factors affecting positively exports performance of sesame seed in the long-run. However, the effects of producer price and world demand are insignificant. The long-run results show evidence of a significant and negative effect of international prices
on sesame exports performance in the long-run. Both the negative effects and the insignificant effects could be caused by the unaddressed short-run inefficiencies and development constraints in the sector. Identifying and critically addressing these inefficiencies is necessary for the country to keep its exports competiveness in the future.
The Error Correction Term (ECT) adjusts any deviation from the long-run to the equilibrium by 36.86% within a year.
Key words: BFA, Exports of Sesame seed, Determinants, Co-integration, VECM, Granger Causality.
1
Chapter I: Introduction
1.1 Introduction
Historically, Sub-Saharan Africa (SSA) is seen as supplier of raw materials, and countries’ economies have continued to produce primarily crop for export. These countries have comparative advantage in exporting agricultural commodities due to the low cost of labor, the availability of natural resources and tropical climate. Thus, agriculture is still the most important single activity for the SSA countries, engages almost 80% of the population; contributes on average of 30%-60% of the Gross Domestic Product (GDP) and about 30% of the export earnings Bruntrup et al. (2009). Both industry and services are dependent on the performance of agriculture, which provides raw materials, generates foreign currency for the import of essential inputs and food for the fast growing population. Among the tropical agricultural commodities exported by SSA countries, sesame seed represents an important export product. The seed is widely cultivated across the world; however, it constitutes a major export crop for West and East African countries where the seed is voluminously produced. The major producers of sesame seed in Africa are Tanzania, Sudan, Nigeria, Ethiopia and Burkina Faso (BFA).
Their production represents 57% worldwide. The growing demand in the world market for sesame seed and the available capacity to expand production could make sesame seed sector ultimately turn into one of engines of economic growth of African producing countries.
1.2 Background and Motivations
As many other SSA countries, trade liberalization policies were instituted in 1980s in BFA. The persistent decline in economic growth recorded in post mid-1960s led to the
implementation of trade policy reforms to salvage the economy from collapse.
Specifically, BFA implemented the SAP in 1983, which aimed to reposition the economy on the path of desired economic growth. The trade reform in 1983 and its fortification in 2000 by the SFCP, and the adoption of the AGSDS later in 2011 resulted principally in reducing poverty, sustaining the economic growth and diversifying the agricultural sector.
Moreover, the principal vision of the current economic program of BFA (NPESD) is still to promote export-led growth through agriculture and to enhance its international competitiveness.
Yet, agriculture remains an important sector of BFA economy and contributes between 35% and 40% of the GDP. The sector engages 80% of the population and is the backbone of economic growth, poverty reduction and sustainable development.
Agricultural exports are cotton, livestock products, groundnuts, sesame seed, green beans, shea butter, and fruits among others. In 2016, total exports value of BFA was worth of 2.4 billion USD (20% of GDP), with 37.5% attributed to total agricultural exports (UN Comtrade data). Cotton industry, the first and the biggest industry, alone contributes to 60% to agricultural export earnings. However, the cotton sector is facing many serious difficulties caused by the downward pressure on world prices and internal problems, which partly led farmers to switch in other cash crops production. After the cotton, sesame is considered as the second major cash crop for export in BFA, and the country is one of the world largest producer and exporter. Sesame in BFA is grown entirely under rainfed conditions with little or no use of machinery or modern inputs under the traditional farming system. The seed is cultivated throughout the country but the major growing areas are located in western, central and eastern regions.
The sesame sector is relatively young in BFA, and over the past decade, the sector has been characterized by a tremendous growth caused by the increasing world demand.
3
The demand principally comes from the oil industry and the confectionary sector.
However, recently the sesame oil is not only for human consumption (cooking), but is also used in cosmetic products (soaps paints, perfumes...), pharmaceuticals, and insecticides. These have induced a surplus of demand for the sesame seed worldwide.
Consequently, the increasing world demand of sesame seed induced significant variations in BFA’s sesame sector both in production and in exports. Sesame seed is a cash crop and the country exports nearly 80% of its production. According to FAO database total export quantity increased from 20,600 tons in 2007 to 160,000 tons in 2016 (average growth of 22.75% per annual). In terms of value, sesame seed exports value maintained an average growth of 18.5% per year over the decade (2007-2016) and export earnings reached 103 billion FCFA (170 million USD) in 2015. BFA’s export markets for sesame are quite concentrated in Asia such as Japan, Singapore, China and South Korea. Within Africa, BFA’s performance in the sesame sector (growth in terms of export quantities and value) compared to its major competitors (Nigeria, Ethiopia, Tanzania, Sudan) is unequaled.
With nearly 10% in world total export of sesame and with an unequaled performance, BFA ranked eighth and fifth as world and Africa largest exporter of sesame seed in 2016 respectively (FAO database).
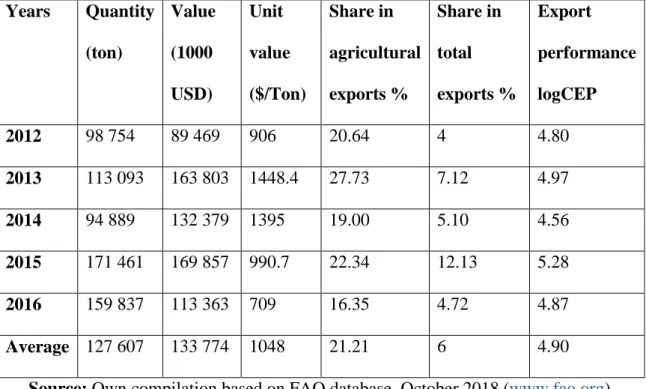
Further, according to the Households’ Survey on Living Conditions in BFA, carried out in 2003 by INSD it indicated that sesame contributes on average of 1.4% to the household’s (farmers) monetary income with a different importance according to the region. This statistic has certainly evolved over the years; however, it points out both the impact that sesame seed export could have in boosting farmers’ income, reducing poverty in the rural sector and sustaining the economy growth. Table 1 below shows sesame exports quantities, values, and share during the period 2012-2016. Sesame exports in 2012-2016 accounted for about 21% of agricultural exports and about 6% of total export,
on average. In addition, the logCEP1 for the sesame sector is greater than one, which highlights the competitiveness of the country in exporting sesame. Sesame exports are becoming source of agricultural exports diversification, an emerging economic sector;
and one of the leading export commodities in BFA since the cotton sector is facing many difficulties. Despite the double-digit contribution of sesame exports to the earnings of agricultural exports and its impacts on farmers’ income, there has been no study conducted to investigate the factors that determine sesame exports in the country. It turs out to be relevant to ask these questions are: what are the factors that determine sesame seed exports in BFA? , and what can be done to enhance the earnings of sesame exports for BFA? Concisely, this study intends to answer these questions.
Table 1. Sesame export quantities and values of BFA (2012-2016) Years Quantity
(ton)
Value (1000 USD)
Unit value ($/Ton)
Share in agricultural exports %
Share in total exports %
Export performance logCEP
2012 98 754 89 469 906 20.64 4 4.80
2013 113 093 163 803 1448.4 27.73 7.12 4.97
2014 94 889 132 379 1395 19.00 5.10 4.56
2015 171 461 169 857 990.7 22.34 12.13 5.28
2016 159 837 113 363 709 16.35 4.72 4.87
Average 127 607 133 774 1048 21.21 6 4.90
Source: Own compilation based on FAO database, October 2018 (www.fao.org)
1 CEP: Comparative Export Performance =
XiA: value of world exports of sesame seed, XiB: value of sesame seed exports from BFA, XB: total value of agricultural exports from BFA, XA: total value of world agricultural exports
5
1.3 Objectives and Outline
This paper attempts principally to identify and quantify the effects of possible factors that affect sesame exports in BFA through the application of the co-integration analysis.
The study sources to achieve the following specific objectives:
1- To identify key external and internal factor-drivers of sesame exports in BFA for the period 1970-2016
2- To quantify the effects and analyze the magnitude of these factors on export performance
3- To inform relevant policy prescriptions and agricultural trade recommendations based on the findings.
This paper is structured into six chapters. The following chapter i.e. second chapter presents an overview of sesame seed production and trade across the world (production, export and import, with an emphasis on Burkina Faso). The third chapter goes through the literature on the determinants of agricultural exports while stressing on factors affecting agricultural exports in SSA. The fourth chapter presents the methodology used in this study, model specification and justifies the variables employed. The fifth chapter tables the empirical results, interprets and discusses. Finally, the sixth chapter comes up with concluding remarks and proposes some policy recommendations.
Chapter II: An overview of sesame seed production and trade across the world
2.1 Agronomic practices, different uses and worldwide trend of sesame seed Production
Sesame (Sesamum indicum L. 2n=26), member of the family Pedaliaceae, is known as one of the oldest and the most traditional oilseeds crop to mankind (Raemaekers, 2001).
It is an annual crop with quadrangular stem, which height varies between sixty (60) and two hundred (200) centimeters depending on the variety. The seeds have been growing in tropical regions (hot and humid) with temperatures around 27 Celsius degree and precipitation of 625 -1100mn. The crop is intolerant to water logging (excessive rainfall) or poor drainage, and can be grown on soil types ranging from fertile soils to sandy soils.
Sesame seeds color varies from white (cream-white), yellow, red, to brown but it is mainly white or black and is highly valued for its high-quality seed oil. The production of sesame is for oil and margarines. Particularly, the crop contains up to 60% oil of a very high quality and up to 25% protein. Sesame seeds are used whole or processed to produce oil and meal while in Africa sesame seeds are made into porridges and soups (Gooding, Murdoch, & Ellis, 2000). The quality of oil is determined by the fatty acid compositions of the total oil. Its oil is used for salad and cooking dishes. Moreover, the oil is especially important in the Far Eastern cuisine, mainly Japan and china.
World production of sesame seed is estimated by FAO at 6.1 million metric tons in 2016, an increase of 68.5% based on year 2007 (Table 2), with declines observed in 2015 (-4.6%) and 2016 (-1.6%). Over the decade (2007-2016), world production of sesame seed is increasing with an average growth of 5.35% per year. The increase in world production is mainly due to an extension of cultivated area given that, on average, yield
7
rarely exceeds 500kg per hectare for most producers. Asian countries are generally the largest producers of sesame seed. From 2007 to 2016, on average, Myanmar, India and China are the world largest producers of sesame seed (Table 2). These three countries shared 43% of global production worldwide. They are followed by African countries i.e.
Tanzania, Nigeria and Ethiopia, which as a whole shares 30% of worldwide production.
It should be noticed that data about Sudan are not completely available since the countries is divided into two independent countries (Sudan and the South Sudan), and for this reason, Sudan data are not included in this analysis. According to FAO data, the volume of sesame seed produced in Africa represents between 50% and 55% of worldwide production since 2012. Asian production of sesame seed (grouped by India, Myanmar and China) is declining due to land scarcity principally in countries such as India and China. In addition, in these countries sesame seed productivity/yield is decreasing due to changing climate patterns, and also due the cultivation of more diversified cash crop (e.g.
Myanmar) Raitzer et al. (2015). For instance, the three Asian largest producers; Myanmar, India and China totalized 37% of world sesame seed production in 2016 compared to 54%
in 2009.
Table 2. Worldwide Trend of Sesame Production and Major Producers 2007-2016 (measured in ton)
*AGR = Average growth per Year
Year 2007 2008 2009 2010 2011 2012 2013 2014 2015 2016 Average AGR%
World 3627068 3725531 3865092 4321616 4712193 5406592 6005553 6529085 6172368 6111548 5047664.6 5.35 India 756900 64030 588400 893000 810000 685000 715000 828000 850000 797700 756430 0.52 Ethiopia 149388 186772 260534 327741 244783 181376 220216 288770 302273 267867 242972 6.00 Tanzania 155794 46767 90000 144420 357162 456000 1050000 1113982 1174589 940221 552893.5 19.70 Nigeria 117700 121610 119710 149410 229167 994800 584980 434990 432900 460988 364625.5 14.63
Myanmar 701100 840000 790100 787400 832100 794600 817100 801600 828270 812952 800522.2 1.50 China 557537 586701 622905 587947 605770 639989 624831 632108 642427 649589 614980.4 1.54
Source: FAO database, October 2018 (www.fao.org)
9
2.2 World Major Exporters and Importers of sesame seed
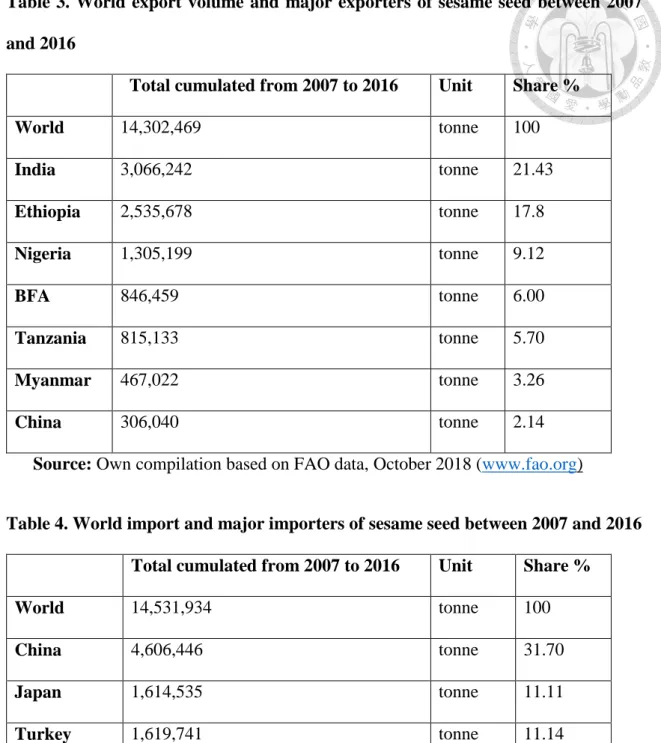
Since 2000s, world export of sesame seed or world sesame seed supply have been increasing steadily and ragged between 25% and 30% of total world sesame seed production. Between 2007 and 2016, world export volume or world demand of sesame seed has been increasing at a growth of 6.28% per year (Table 3). Nonetheless, on detailed level, world export volume showed certain variability because of year-to-year rainfall fluctuations and other natural factors. India, Ethiopia, Nigeria, BFA, Tanzania, Myanmar and China are the seven larger exporters of sesame seed in the world between 2007 and 2016. These seven countries share 65% of world market of sesame seed.
Moreover, in recent years the global supply of sesame seed is quite concentrated in Africa that shares more than 55% of global export market (FAO database, 2018).
On the other hand, and historically China, Japan and Turkey are the world largest importers of sesame seed. As indicated in table 4, they are still the world largest importers of sesame seed and share 54% of world import market. During the period (2007-2016), the average growth per year of for China’s imports (15.70%) exceeded that of the world (6.72%). However, Japan recorded a slight decrease in quantities imported over the period, which can be explained partly by some fluctuations in the production of its suppliers.
Based on ICT trademap data, the concentration of supplying countries in the main importing markets is quite strong. Typically, 70% of China’s imports of sesame seeds is supplied by three countries and this proportion is 75 % for Turkey imports. The sesame market appears to be concentrated in view of the large number of importing countries.
Table 3. World export volume and major exporters of sesame seed between 2007 and 2016
Total cumulated from 2007 to 2016 Unit Share %
World 14,302,469 tonne 100
India 3,066,242 tonne 21.43
Ethiopia 2,535,678 tonne 17.8
Nigeria 1,305,199 tonne 9.12
BFA 846,459 tonne 6.00
Tanzania 815,133 tonne 5.70
Myanmar 467,022 tonne 3.26
China 306,040 tonne 2.14
Source: Own compilation based on FAO data, October 2018 (www.fao.org)
Table 4. World import and major importers of sesame seed between 2007 and 2016 Total cumulated from 2007 to 2016 Unit Share %
World 14,531,934 tonne 100
China 4,606,446 tonne 31.70
Japan 1,614,535 tonne 11.11
Turkey 1,619,741 tonne 11.14
South Korea 746,782 tonne 5.13
Israel 475,657 tonne 3.27
Source: Own compilation based on FAO data, October 2018 (www.fao.org)
11
2.3 Sesame seed sector in Burkina Faso
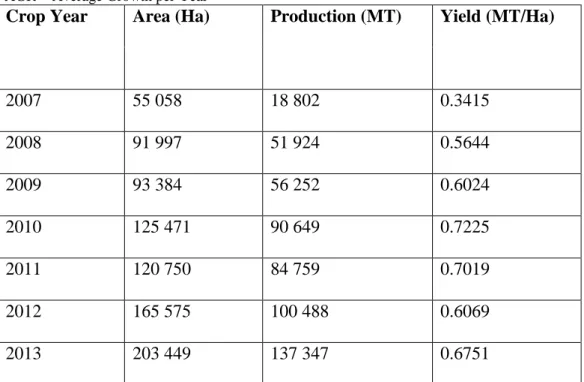
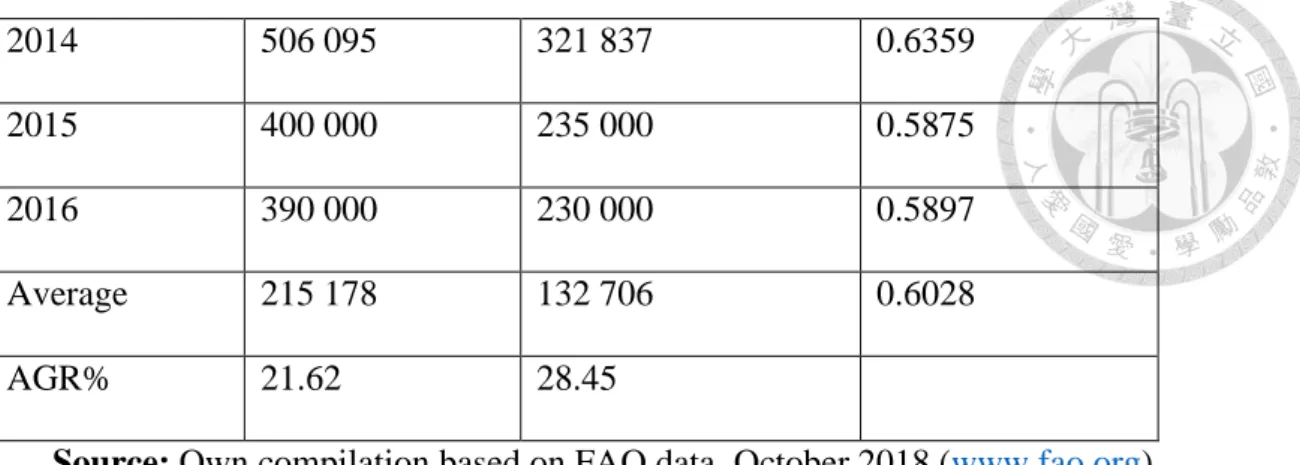
The diversified agro-ecology of BFA makes the country suitable for sesame production. Sesame is both a secondary crop and a cash crop for most farmers in BFA, and is grown throughout the country either in pure culture (82% of parcels) or in association with other crops (groundnuts, beans etc.). The sesame sector in BFA is a relatively young sector that has been characterized by a tremendous growth over the past two decades both in terms of area and production volume (Table 5). Total production stepped up from 18,802 metric tonne in 2007 to 230,000 tonnes in 2016, corresponding an average growth of 28.45% per year. This is an outstanding performance among Africa’s larger producers given that Nigeria, Ethiopia and Tanzania recorded an average growth of 14.63%, 6% and 19.70% per year respectively during the same period. In 2016, BFA was the second in West Africa, the fifth in Africa and the eighth largest producer in the world, with production representing respectively 28%, 7% and 4%. Nevertheless, BFA recorded a low yield in sesame production compared to other producing countries which was averagely 603 kg/ha. Further, the production was characterized by a strong variability over the period; which is mainly due to the rainfall conditions and the adjustment between sesame and cotton acreage. However, sesame seed production in BFA possesses promising aspects including good future prospects; land suitability for sesame production; abundant labor, and a growing amount of sesame research and development.
BFA exports nearly 80% of its total production on average (FAO data). Table 6 shows a rising trend for both export quantities and exports value of sesame seed. Over the decade (from 2007 to 2016), BFA’s export quantities and exports value of sesame seed recorded respectively an average growth of 22.75% and 18.5% per year. There have been some fluctuations as the case of global trend but the export performance of the country is
well above the global average (6.28%). Comparatively, from 2007 to 2016, the average growth of sesame seed export quantities was 10.6%, 7.72% and 18.30% per annual for Ethiopia, Nigeria, and Tanzania respectively; while that of export value was 11.20%, 12%
and 22.5% respectively.
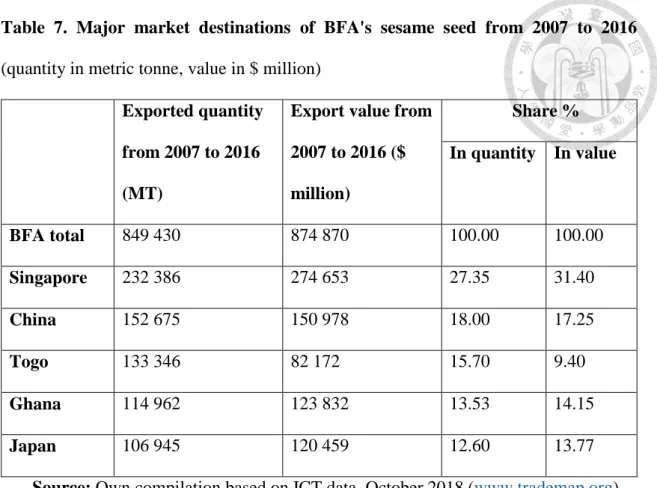
On the other hand, the top market destinations of BFA’s sesame seed are Singapore, China, and Japan in Asia; Togo and Ghana in West Africa based on the total volume of sesame seed imported by these countries from 2007 to 2016 (Table 7). Taken the cumulative from 2007 to 2016, Asian market (Singapore, China and Japan) shares 58%, 62.5% of BFA’s exports quantity and value respectively. Chinese’s market recorded the fastest growth value in importing BFA’s sesame seed up to 58% between 2011 and 2016 (ICT data, 2018). Togo and Ghana account for about 29% of BFA’s exports market;
however, this proportion might related to the fact that Togo and Ghana are countries with ports serving BFA to export.
Table 5. BFA's sesame production trend from 2007 to 2016 (area in hectare and production in ton)
*AGR = Average Growth per Year
Crop Year Area (Ha) Production (MT) Yield (MT/Ha)
2007 55 058 18 802 0.3415
2008 91 997 51 924 0.5644
2009 93 384 56 252 0.6024
2010 125 471 90 649 0.7225
2011 120 750 84 759 0.7019
2012 165 575 100 488 0.6069
2013 203 449 137 347 0.6751
13
2014 506 095 321 837 0.6359
2015 400 000 235 000 0.5875
2016 390 000 230 000 0.5897
Average 215 178 132 706 0.6028
AGR% 21.62 28.45
Source: Own compilation based on FAO data, October 2018 (www.fao.org)
Table 6. Trend of BFA's sesame seed export from 2007 to 2016
*AGR = Average Growth per Year
Year Export quantity (Metric Tonne) Export value ($ million)
2007 20 600 20 898
2008 21 331 25 056
2009 49 518 47 524
2010 61 298 55 791
2011 58 650 56 730
2012 98 754 89 469
2013 113 093 163 803
2014 94 889 132 379
2015 171 461 169 857
2016 159 837 113 363
Average 84 943 87 487
AGR % 22.75 18.5
Source: Own compilation based on FAO database, October 2018 (www.fao.org)
Table 7. Major market destinations of BFA's sesame seed from 2007 to 2016 (quantity in metric tonne, value in $ million)
Exported quantity from 2007 to 2016 (MT)
Export value from 2007 to 2016 ($
million)
Share % In quantity In value
BFA total 849 430 874 870 100.00 100.00
Singapore 232 386 274 653 27.35 31.40
China 152 675 150 978 18.00 17.25
Togo 133 346 82 172 15.70 9.40
Ghana 114 962 123 832 13.53 14.15
Japan 106 945 120 459 12.60 13.77
Source: Own compilation based on ICT data, October 2018 (www.trademap.org)
2.4 Market Opportunities and Tariff Advantages for BFA
Based on ICT trademap data, BFA has a yearly export potential untapped of sesame seed. The markets with greatest untapped potential for BFA’s exports of sesame seed are Japan, China, Egypt, Turkey, Germany and France. These markets, as a whole, show the largest absolute difference between potential and actual exports in value terms, leaving room to realize additional exports worth of 32 million USD yearly. Ultimately, it is important for BFA to intensify sesame production, increase quality and diversify market destinations in order to take advantage of this untapped potential.
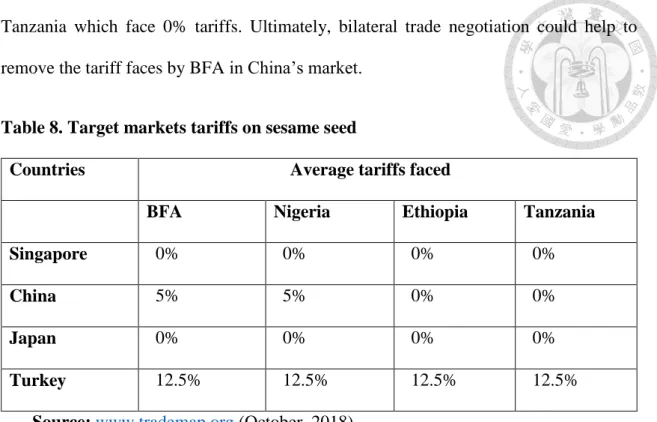
In terms of tariff advantages, analysis from Trademap data showed that tariffs are practically the same in the exporting markets of sesame seed. It can be seen from table 8 that BFA and other competitors face the same tariffs in the markets. However, BFA is disadvantaged in China’s market compared to others competitors such as Ethiopia and
15
Tanzania which face 0% tariffs. Ultimately, bilateral trade negotiation could help to remove the tariff faces by BFA in China’s market.
Table 8. Target markets tariffs on sesame seed
Countries Average tariffs faced
BFA Nigeria Ethiopia Tanzania
Singapore 0% 0% 0% 0%
China 5% 5% 0% 0%
Japan 0% 0% 0% 0%
Turkey 12.5% 12.5% 12.5% 12.5%
Source: www.trademap.org (October, 2018)
Chapter III: Literature review
2.1 Theoretical modeling on export determination
The technological approach of trade pioneered by the classics and their proponents explain that, specialization of countries in international trade can be explained by differences in productivity in these countries. The theory of absolute advantage developed by Adam Smith in 1776 expresses the idea that a country gains to specialize in the production and export of products for which it has an absolute advantage, i.e. conditions of production better than the other countries. However, David Ricardo (1817) criticized the principle of absolute advantage, which is neither necessary nor sufficient for mutually beneficial trade Krugman et al. (2009). The concept of comparative according to David Ricardo (1817) is that, the exchange between two countries is favorable to each of them from the moment the relative cost (or opportunity cost) of produced goods differs. The model developed by Ricardo assumes constant productivity with only one factor of production (labor), and therefore constant opportunity cost that leads to complete specialization. However, international trade is a result of other factors of production such as capital and natural resources, which are can be source of comparative advantage. In order to respond to the limited classical approach in explaining international trade, the HOS theorem (developed by Hecksher (1919) and Olhin (1933), perfected by Samuelson) stressed that international exchange results from the abundance or scarcity of production’s factors (capital, labor, land). According to the HOS theorem, a country possesses a comparative advantage in the production of a commodity that uses the relatively abundant resource in that country more intensively. International trade must lead to a tendency to level prices of these factors: trade will level what was scarce and expensive.
17
In the perspective of comparative advantage, international trade would result in automatic way and static differences in productivity or factor endowments. In that sense, it will be impotent for a country, which is endowed in labor and deficient in capital to voluntarily invest in capital and thereby increase its production. The static approach of the international trade is unrealistic in its assumptions (perfect competition, constant returns, stability of trade and industrial policies…), and presented inconstancies in empirical work (Carbaugh (2002) cited by Anaman and Mahmod (2003)). In addition, in the analysis of factors endowment, the context of imperfect competition and the presence of economies of scale cannot hold neither as assumptions nor a condition created by the factor endowment. Because, a potent industrial policy or a proactive government that puts up better policies (in infrastructure or education sector) can lower production costs thereby providing economies of scale to the country. The existence of dynamic economic factors such as large domestic market (demand), and/or some policy-induced accessibility to a larger market outside the country (for example due to customs union) can lower production cost and may boost or create a comparative advantage (Linnemann, 1966), (Hong, 2000). It follows that comparative advantage based on resource endowment like capital or labor cannot longer explain international trade. These comparative advantages are neither static nor automatic and can be created voluntarily or provoked.
2.2 Empirical modeling on agricultural exports
In developing countries, international trade is often motivated by the accessibility of foreign markets and the capacity to supply. However, the supply of primary export of developing nation is price inelastic (i.e. the quantities supplied do not respond very much in their price) because of international rigidities, the instability of the international demand and inflexibilities in resource used in most developing nations specially in case
of agricultural products that involve long gestation periods. The supplies of developing nations are unstable or swinging because of weather conditions, pests, and other climatic hazards. Large exporters (usually large landowners or large farmers) and medium- sized local business engaged in foreign trade stand to benefit the most. Huge benefit to exporters will encourage them to supply more. Therefore, foreign exchange rate system of the country will determine the export supply of that country (Salvatore, 2008). The effect of exchange rate on export depends on the price elasticity of export supply because real exchange rate should incorporate the price effect on export. Thus, the higher the price elasticity, the more competition face exports of a particular country on the world market (Roshan, 2007).
Models developed latterly on international trade provide a foundation for investigating the importance of supply capacity in determining the export performance of a country. Supply capacity depends on local conditions; factors that affect the supply capacity may include location related elements that could affect the access to raw materials and other resources. It may also depends upon determinants such as infrastructure, labour costs, and capital. Even with factor endowments, these costs are primarily the outcome of economic policy and the access to technology that is likely to affect productivity can be another determinant of supply capacity (Fugazza, 2004). In addition, according to the endogenous growth theory, countries with a large domestic market can grow faster because of economies of scale. The point is that, countries with population spread (proxy of a large domestic market) over large geographical areas can gain from distinct regional specialization, by extension, to a large mix of national export diversification (Barro & Sala-i-Martin, 2004).
Furthermore, institutional factors mentioned by UNCTAD (UNCTAD, 2005) study could affect export sector development at early stage. UNCTAD study has been carried
19
on a short period of time (1988-1991) and therefore could have some limits in emphasizing significantly the contribution of institutional factors at such a stage. Because, these factors are related to the general macroeconomic environment and the contribution of Foreign Direct Investments (FDI). However, the study indicated that institutional factors matter more at a higher level of export. The quality of institutional framework comes in as an essential competitiveness ingredient and better institutions are expected to guarantee better protection of property rights, which becomes essential as production becomes more and more capital-intensive. UNCTAD’s study also pointed out that infrastructural development in any country, especially in developing countries, would reduce production costs, increase efficiency and productivity and thereby to maximize export profitability. Adequate infrastructure, especially in developing countries, comes with a very strong stimulus to private sector development and product diversification.
Thereby, good infrastructure is a necessary condition for foreign investors to operate successfully and boost exports (Wheeler & Mody, 1992).
2.3 Factors affecting agricultural exports in Sub-Saharan Africa
Determinants of agricultural exports in SSA countries are still a controversial issue in economics, and studies on the determinants of agricultural exports in developing countries produced mixed results. In general, export sector is affected by multiplicity of factors in low-income countries especially in Sub-Saharan African countries. Fugazza (2004) as Allaro (2011) classified determinants of export performance into external and internal, where external factors are related to market access conditions and other factors affecting import demand. Apart from trade barriers and competition factors foreign market access is also determined by transportation costs, which include geography and
physical infrastructures. On the other hand, internal/domestic factors refer to supply side conditions or factors affecting supply capacity such as domestic policies.
Several studies have been conducted so far towards determining drivers of exports for various agricultural commodities in SSA and have yielded quite interesting findings in economic, business and trade literature. As a key supply side determinant, higher level of production has been found as an important factor for stimulating exports in many studies on export trade (Bertil, 1968). In an open economy, increased production offers an opportunity for export development through surpluses, which consequently earn foreign exchange, revenue and taxes for the exporting country. The rich and cultivable land availability (factor endowment) enables BFA to specialize in tropical products exportation (e.g. sesame seed) in which it has advantage comparative in the production.
BFA having adopted a more liberal trading environment (open economy), increased production of sesame seed a priori expected to yield beneficial implications for exports performance. This expectation is in line with Ngeno (1966), Boansi (2013) and Boansi et al. (2014) which revealed that the production is a key factor affecting significantly export supply.
In the same vein, Boansi et al. (2014) conducted a study on Chad cotton exports by using the VECM. The author used external and supply side factors for a period of 31 years and discovered that, world export (proxy of world demand) volume of the commodity under study and the export competiveness (measured by comparative export performance index) of the product significantly determine cotton lint exports from Chad and Mali.
Anwar et al. (2010) using the VECM on cotton lint exports in Pakistan including similar variables as Boansi et al. (2014). The study revealed that the export of cotton lint is positively driven by increasing world demand for cotton and export competitiveness of the country. Similarly, Kumar et al. (2007) in a study using the same variables as Anwar
21
et al. (2010) concluded that a one percent increase in volume of world export volume of the commodities under study leads to a 5.96 percent increase in demand for exports from India.
As stated by Dercon (1993), prices generally serve as conduct through which relevant economic policies can affect agricultural variables such as production, exports supply and income. In investigating the determinants of export growth in Uganda for the period 1987-2006, using the co-integration analysis, Agasha (2009) found a positive effect of foreign export prices on export performance in the short-run. However, an unexpected sign was found between foreign prices level and exports in the long-run.
Edward (2004) studied on the determinants of agricultural exports using the gravity model in South Africa. The author found significant and positive effect of foreign export prices on export supply of South Africa. In addition, Allaro (2011) conducted a study on oilseed exports performance in Ethiopia using the VECM and the author ended with a positive effect of foreign export prices on oilseed exports in the short and long-run. Ndulu and Lipumba (1990) in Tanzania revealed that foreign prices of primary commodities significantly affect the export performance of country’s involved in their production.
Moreover, a good producer price matching with foreign export price has a positive impact on the agricultural export earnings. Tijani et al (1999) conducted a study on export supply in Nigeria using the co-integration approach. The empirical finding revealed that producer price has a long-run equilibrium relationship with the cocoa exports in Nigeria, and high producer price leads to accumulation of ample revenue to producers. The author concluded that high price induces producers to increase production of the given product and thus assures the supply and availability of products to export.
Likewise, various studies have also shown domestic exchange rate depreciation (foreign exchange rate appreciation) makes export products cheaper in the international
market resulting into their increased demand. Fang et al (2006) analyzed the impact of exchange rate depreciation on exports for eight Asian economies and they found that depreciation contributes to exports performance for most countries. In addition, the study of Edward (2004) on the determinants of agricultural exports using the gravity model in South Africa found a positive association between nominal exchange rate and agricultural exports. The study conducted by Allaro (2011) using the VECM in Ethiopia found a positive effect of nominal exchange rate on oilseed exports in the short and long-run.
Contrary, Amoro et al (2012) in a study on the determinants of agricultural exports in Cote d’Ivoire using the Ordinary Least Square, found a significant and negative effect of nominal exchange rate on cocoa and rubber exports in Cote d’Ivoire. This means that a devaluation of the nominal exchange rate of a country produces the same effects as the depreciation and enable an increase of its export products. For this reason, WAEMU2 in 1994 devaluated the Union’s currency, which aimed to stimulate the exports and competitiveness of the member States.
So far, in the literature, various variables have been identified as factors affecting agricultural exports in developing countries. In as much as some of the findings conform with economic and trade theories, others either are mixed signals or tend to disprove existing theories. However, in either case, knowing the factors that affect agricultural exports is key to drafting and implementing appropriate policy measures to further stimulate exports and boost social and economic development in SSA and particularly in BFA.
2 West African Economic and Monetary Union (Benin, Bissau Guinea, Burkina Faso, Ivory Coast, Mali,
23
Chapter IV: Research Methodology and Data
4.1 Analytical Framework
After trade liberalization, numerous actions and studies have been taken to estimate the responses of production and export supply in various industries, aiming to frame policy decisions in developing countries and worldwide. Throughout such analytical works, the co-integration approach has received an important attention in economic, business and trade literature. Contrary to other techniques used to estimate supply and production responses such as panel and gravity model, the co-integration technique is superior and helping to estimate both short-run and long-run dynamics of changes in relevant development variables (C. J. Granger, 1986). The Engle-Granger two-step estimation technique (Engle & Granger, 1987), the Phillips-Ouliaris residual-based test (Phillips & Ouliaris, 1988) and the Johansen Full Information Maximum Likelihood test (Johansen & Juselius, 1990) are three principal approaches suggested in the literature for executing co-integration analysis. However, the Engle-Granger two-step estimation technique is unperfected by small-sample biases even though it is proven simple. This imperfection is partly due to the fact that, estimating long-run coefficients in the first stage, the technique nearly ignores short-run dynamics, thus performing short-run coefficients that are unguided by long-run estimates (Stock, 1987). Despite the many variables that a system might have, the Engle-Granger two-step estimation technique and the Phillips-Ouliaris residual-based test cling to the assumption of a single co-integrating equation between variables. This does not consider the reality since the relations between economic variables can exhibit n-1 number of co-integrating equations among n variables.
The Johansen Full Information Maximum Likelihood test through its approach of co-
integration addresses suitably the drawbacks of the Engle-Granger two-step estimation technique and the Phillips-Ouliaris residual-based test.
In empirical studies, the VECM through Johansen co-integration technique is theoretically driven approach useful for estimating both short and long-run effects. Allaro (2011) used the Johansen co-integration technique to study on export performance of oilseeds and its determinants in Ethiopia for the period 36 years. The author found evidence of long-run equilibrium between the system’s variables. Karim (2015) in modeling factors constraining sesame exports in the Sudan used the Johansen co- integration approach for the period of 44 years, and the author found evidence of long- run equilibrium between the system’s variables. Other studies such as Boansi et al. (2014) in Mali; Idsardi (2010) in South Africa; J Kingu (2014) in Tanzania also used the VECM through Johansen co-integration technique to analyze agricultural commodities exports.
The Johansen Full Information Maximum Likelihood estimator requires specification of the complete model and the basis of asymptotic theory; it appears to be the best estimator (Goldstein & Khan, 1978). Since the main interest of this study is to determine empirically the factors that explain the exports of sesame seed in BFA, the Johansen co- integration approach suitably will be adopted.
4.2 Empirical Model Specification and Definition of Variables
This study focuses on investigating the factors that determine the export earnings of sesame seed in BFA. Lütkepohl et al. (2004) propose to use relevant variables when using the co-integration technique even if the system will contain few variables Therefore, from the literature; possible factors have been identified relevantly according to data availability. The export supply models for the various crops are modelled following from Goldestien and Khan (1978) adopted and used in numerous studies such as Islam et al.
25
(1989), Lukonga (1994), Anagaw et al. (2001), Allaro (2011) and J Kingu (2014) . Suitably, the model used in this paper is expressed as fallow:
Xearnings= f (Exchrate, Prod, Pdprice, Wexprice, Wexpvol) (1)
At estimation stage, taking log-linear of the variables in equation (1) and differentiating with respect to time gives as:
logXearningst = βo + β1logExchratet + β2logProdt + β3logPdpricet + β4logWexpricet + β5logWexpvolt + (2)
Where β are parameters, t is time, the error term and:
- logXearningst (export earnings of sesame seed, measured in USD) is the log of export earnings. It is the dependent variable since the research intends to investigate the factors that determine BFA’s export earnings of sesame seed. Karim (2015) and J Kingu (2014) specified export earnings as dependent variables for studies on export determinants of sesame and cotton in Ethiopia and Tanzania respectively. In addition, the variable, export earnings of sesame seed is preferred (and not export quantity) to measure systematically the performance of the sesame sector.
- logExchratet is the log of the nominal exchange rate (USD to FCFA) and the more the local currency (FCFA) depreciates (or appreciation of international currency, USD), the more exports performance improves. In other words, the nominal exchange rate captures the average effect of the dollar variations on sesame export earnings. Edwards et al.
(2004); Amoro et al. (2012) and Allaro (2011) included nominal exchange rate to investigate the determinants of agricultural exports respectively in South Africa, Cote d’Ivoire and Ethiopia. A positive correlation (β1 >0) is expected between sesame seed export earnings and the nominal exchange rate.
- logProdt is the log of the production (quantity produced of sesame seed measured in ton). Being a key variable, it is included to measure the effects of the supply on export earnings of sesame seed. Following Ngeno (1966), Boansi (2013) and Amoro et al. (2012) it is expected that an increase in quantities produced (through yields or area) will have a positive effect on export earnings (β2 > 0)
- logPdpricet (log of producer average price, measured in USD/ton) and logWexpricet
(log of world export price or foreign price, measured in USD/ton) are included to measure the effect of prices’ variation on export earnings of sesame seed. Allaro (2011) included producer price and foreign price as world export price in evaluating the factors that affect sesame export performance in Ethiopia. Ceterus paribus, it is anticipated that any increase either in producer average price or in world export price will increase export earnings of sesame seed (β3, β4 >0). World export price is calculated as it follows:
Wavprice = [(world export value) / (world export volume)] x 1000 (3) - logWexpvolt is the log of world export volume (a proxy of world demand of sesame seed). Following Anwar et al. (2010), Kumar et al. (2007), Edwards et al. (2004) and Boansi et al. (2014); world export volume of sesame seed stands to capture the effects of international trade or world demand of sesame seed on BFA’s export earnings. An increasing world demand of sesame seed is anticipated to positively affect export earnings (β5 >0).
4.3 Regression Technique: Johansen Co-integration approach
In adopting the Johansen co-integration approach, two requirements must be satisfied for variables to be co-integrated, i.e. an equilibrium relationship exists. First, the time series data for each variable involved should exhibit similar statistical properties, that is, be integrated to the same order; and second, a stationary linear combination must
27
exist (Malik, 2010). These requirements must be satisfied because most economic time series data are flawed by non-stationarity and time volatility; and any regression on these series may produce spurious, meaningless and irrelevant results (C. W. Granger &
Newbold, 1974).
i) Stationarity test
A stationary time series (free of unit root) is thus a series in which the mean, variance and covariance remain constant over time or in other words do not change or fluctuate over time and there may be an equilibrium relation between these series (Wooldridge, 2015). Moreover, a non-stationary time series can become stationary after differentiated p times; and is said to be integrated of order p, noted I(p) (Gujarati, 2009).
To test for stationarity, this study uses the Augmented Dickey-Fuller (ADF) (1979, 1981) test, which is most notable and commonly used. The general regression equation in performing the stationarity test is stated in the following form:
Yt = + t + Yt-1 + + (4)
Where, and t are respectively the constant and the time trend, m is the lag order of the autoregressive process, Yt = Yt - are first differences of Yt, , are changes in lagged values, and is the white noise. In practice, the ADF test can be carried out either with a constant and trend, or with constant and drift on the variable in level or differentiated form. The unit root is tested by setting:
H0: = 0; the time series
Y
t is not stationary (presence of unit root) and H1: < 0; the time seriesY
tis stationary (absence of unit root)The ADF is a lower-tailed test; so if the test statistic is less than the chosen critical value, then the null hypothesis of unit root is rejected and the series is stationary. If the test statistic is greater than the chosen critical value, then the null hypothesis cannot be rejected and the series has unit root.
ii) Johansen’s Test of co-integration
The Johansen approach to co-integration analysis begins with the definition of a vector auto-regression given as follows:
= +
(5)Where Yt = (Kx1) vectors of I (1) variables. represents (KxK) matrix of parameters, and is a (Kx1) vector of normally distributed errors that is serially uncorrelated but has contemporaneous covariance matrix π. Johansen’s procedure relies on the rank of and its characteristics roots. However, in practice, the test for the number of co-integrating equations is performed using the two Johansen’s likelihood ratio (LR) test. These are the Trace test statistic and the Maximal-eigenvalue test. The Trace test statistic is expressed as follows:
trace (r) = -T (6)
Where ... are the (K-r) smallest estimated Eigen values, and T the number of observations. The trace test attempts to determine the number of co-integrating vectors between the variables by testing the null hypothesis (H0) that r ≤ 0 against the alternative (H1) that r > 0 or r ≤ 1 (r equals the number of co-integrating vectors).
The Maximal-eigenvalue test statistic is expressed as follows:
29
max (r, r+1) = -T ln (1- (7)
The Maximal-eigenvalue test separates tests on the individual eigenvalues for a null hypothesis that the number of co-integrating vectors is r, against an alternative of r+1.
iii) The Error Correction Model
Once the co-integrating relationships between variables is confirmed, the vector auto-regression (VAR) model as specified in equation (5) is inappropriate. A special parameterization that supports analysis of Johansen co-integration structures must be considered. The resulting model after subtracted on both side of equation (5) is called vector equilibrium model or Vector Error Correction Model (Lütkepohl et al.
(2004)), and is stated as fallow:
= + (8)
Where the series
Y
tand the matrix are stationary at level p (p = 1, 2...n) in order for the equation to be valid and meaningful. Moreover, the matrix can be decomposed into two sub-matrices i.e. and . The term is the Error Correction Term or the rate at which deviations from long-run equilibrium are adjusted and contains r co- integrating vectors. In equation (8), contains short-run dynamic terms while represents long-run estimates.4.4 Sources and Descriptive Statistic of the data
This study uses quantitative and qualitative data that are time series data covering 47 years, from 1970 to 2016. These series are secondary yearly data collected from various sources. Export earnings of sesame seed, world export price of sesame seed,
world export volume of sesame seed data are entirely collected from FAO open data. Data on producer price are compiled from FAO data. However, data on producer price are completed from the Statistical Yearbook of INSD (Institute of National Statistics and Demography, INSD BFA). Moreover, data on nominal exchange rate are gathered from World Bank Indictor open data.
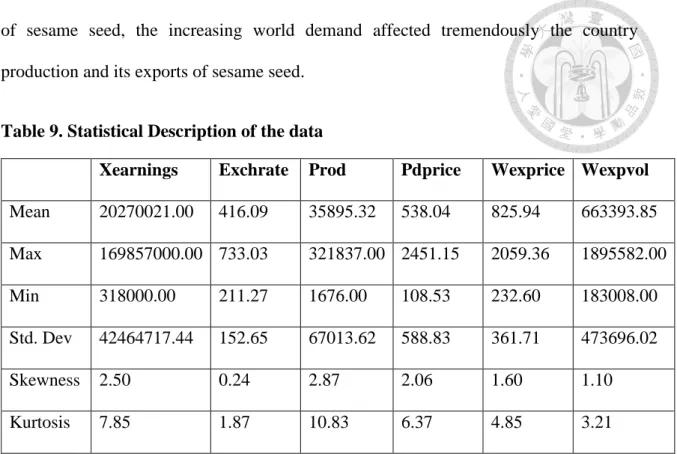
Before we provide the econometric analysis, the study gives a brief statistical description of the data. The table 9 below reports the descriptive statistic of the data used.
The average export earnings of sesame seed is 20.27 million USD, and from 2009 to 2016 export earnings have been above its mean value. The mean value of producer price is USD 538/ton, and since 2006, producer price is above its mean value. On average, the official exchange rate (USD to FCFA) is 416.10 FCFA annually. However, from 1994 onward, exchange rate value evolved above its mean value. This could attributed principally to the devaluation of the national currency (FCFA), which happened in January 1994. Sesame production in BFA averages 36000 tons per year over the period.
From 1970 to 2007, production has been below its mean value, but after that period onward, the production of sesame seed experienced tremendous increase above its mean value. This drastic increase in production can be attributed to the fall in international prices of cotton, which led farmers to switch in producing more sesame seed in order to secure their income. In fact, farmers’ decisions to extend sesame production is likely to be affected by the cotton price level of the last period. In addition, the increased production is a response of the increasing world demand and its price. On average, world export volume of sesame seed (proxy of world demand of sesame seed) is 663393 tons annually. The global demand evolved above its mean value since 2000s, while world price of sesame seed averages 826 USD per ton. Over the period, both world demand and world price have been increasing steadily. Since BFA is a major producer and exporter
31
of sesame seed, the increasing world demand affected tremendously the country production and its exports of sesame seed.
Table 9. Statistical Description of the data
Xearnings Exchrate Prod Pdprice Wexprice Wexpvol Mean 20270021.00 416.09 35895.32 538.04 825.94 663393.85 Max 169857000.00 733.03 321837.00 2451.15 2059.36 1895582.00
Min 318000.00 211.27 1676.00 108.53 232.60 183008.00
Std. Dev 42464717.44 152.65 67013.62 588.83 361.71 473696.02
Skewness 2.50 0.24 2.87 2.06 1.60 1.10
Kurtosis 7.85 1.87 10.83 6.37 4.85 3.21
Source: Author, computed from Eviews 10
Chapter V: Empirical Results and Discussion
5.1 Empirical Results
In this study, it was our purpose to identify and analyze factors determining sesame export performance in BFA. In this section, we will examine the empirical results obtained from the Johansen co-integration technique. In testing for stationary, co- integration and estimating the model, this study used STATA 15 and Eviews 10 software (English window). Following the definition of the VAR model, the optimal choice of one (1) lags order is selected by the use of Schwarz Criterion (SC) and the Hannan-Quinn Information Criterion (HQ) (see appendix, A1). This study uses 47 years of observations;
therefore, a unit root test with structural change (break) is applied in order to detect possible breaks in the data. For that purpose, the study used Zivot-Andrews unit root test with structural change. The results (see in appendix) show that the series have unit root with break points. In order to control for short-run structural change, the study created four dummy variables (d1-d4) which take one at the break point time. These dummies are included as exogenous variables in the co-integration test specification and in the VECM.
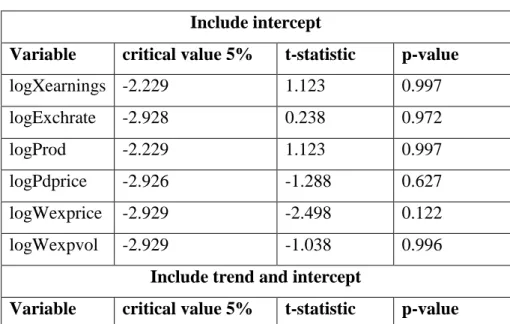
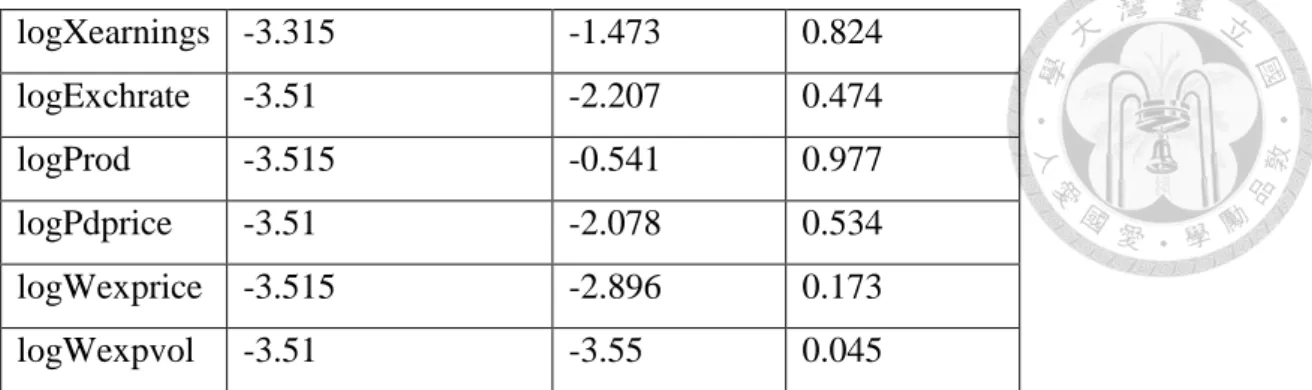
The Augmented Dickey-Fuller (ADF) test of stationarity applied on the series at level revealed that none of the variables is stationary at raw level (Table 10). After first difference of all series, the null hypothesis of the non-stationary test is rejected, meaning that all variables are integrated of order one I (1) (Table 11). Therefore, there is a possibility for these variables to exhibit an equilibrium in the long-run. The application of Johansen co-integration test on the series revealed that the system contains one co- integrating vector. In empirical work, the use of the trace test statistic according to Harris (1995) shows more robustness to both skewness and excess kurtosis in the innovations than the maximal-eigenvalue test. The trace statistic of 54.35 is less than 5% critical value
33
of 60.06 (Table 12). The null hypothesis of zero co-integrating vector is rejected. Thereby, the system exhibits long-run relationship and the equation (8) stated above as VECM is fittingly regressed.
In order to check the accuracy of the results, this study has checked for residuals autocorrelation by using the Breusch-Godfrey serial correlation LM test. The null hypothesis of no autocorrelation at lag order is accepted. In all our results, the null hypothesis of homoskedasticity is accepted; therefore, the errors are homoscedastic. In addition, the residuals test for normality is performed. The null hypothesis of normality distributed is accepted, meaning the residuals are independent and normally distributed.
The study also checked the model stability through the CUSUM test and the CUSUM squares. These tests have been validated meaning that the model’s coefficients are stable over time (Tables and graphs of residuals diagnostic tests are in the appendix).
5.2 Interpretation of the VECM Results and Discussion
i) Interpretation of Short-run Dynamics and Discussion
The short-run coefficients of the VECM have expected signs for all the variables.
(Table 13). As equation (2) is specified in log form, therefore the coefficients are elasticities.
The log of nominal exchange rate has the expected sign (+) and is significant. It can be projected that a 1% depreciation in nominal exchange rate (or 1% increase in the value of the USD) will increase export earnings by 2.30% in the short-run. Although quite elastic, this finding is in line with Diakosavvas et al. (1990). Allaro (2011) also found positive and significant short-run effect of nominal exchange rate on oilseed exports in Ethiopia. Similarly, log of producer average price has expected sign (+) and is statistically significant. For producer price, a 1% increase in farm gate price will increase export
earnings by 0.58% in the short-run. Allaro (2011) found also a significant short-run effect of producer price but negative on oilseed exports in Ethiopia. At the same time, the production of sesame seed is positively associated with export performance. A 1% in the production of sesame seed increases export earnings by 0.1%; however, the effect is statistically insignificant.
The log of export price (foreign price) of sesame has expected sign (+), statistically significant and quite elastic. Based on the findings, a 1% increase in world price of sesame seed increases export earnings of BFA by 1.30% in the short-run. This result is in line with Boansi et al. (2014) which found that, in short-run; world price causes cotton exports performance in Mali. This result also reinforces supply theory of which a higher price causes higher supply, and therefore will cause higher gain ceterus paribus. According to the principles of trade theory, an inverse association is usually expected between prices and world exports volume (proxy of world demand for commodity under study). Thereby, whenever prices in the international market increase, international consumers are expected to demand less, while exporting countries on the other hand are expected to export more. Having stated all factors constant, an elastic, positive and significant effect of world demand of sesame seed on the performance of sesame exports is observed in this study. This is an indicator of the country short-run competiveness in sesame exports. A 1% increase in world demand of sesame seed will increase export earnings of BFA by 2.11% in the short-run. Once again, this confirms the undying world demand of sesame seed and relatively higher demand for exports from BFA; and the finding is in line with Boansi et al. (2014) and Anwar et al. (2010) which found positive and significant effect of world demand (of the product under study) on exports performance, respectively in Mali and in Pakistan. The outcome also reinforces the international trade theory for which, and without any inefficiency in the supply side, an increasing international demand or