୯ҥᆵεᏢᙴᏢଣᙴᏢᔠᡍᄤғނמೌᏢس ᅺγፕЎ
Department of Clinical Laboratory Sciences and Medical Biotechnology College of Medicine
National Taiwan University Master Thesis
PCDH10 ܭεဉޔဉᕎߦಒझΫ
Ϸځ୷Ӣմନϐ
Study of proapoptotic activity and allelic deletion of PCDH10 in colorectal cancer
ᄃഩݒ Hoi-Yan Lio
ࡰᏤ௲: ླྀॳ റγ Advisor : Ya-Chien Yang, Ph.D.
ύ҇୯ 100 ԃ 2 Д February, 2011
i
Acknowledgement
ਔ໔ޑၸޑࡐזǴவךখٰѠಃԃǴᙯ൩ςࢂಃΎԃΑǶ೭Ύԃ๏Α ךΓғࡐӭऍӳޑӣᏫǶ२ӃךाགᖴךޑР҆ᒃаϷ܌ԖޑৎΓǴᡣך೭Ύԃ ӧѠёаคኁคቾޑᏢಞǴޑࡐགᖴգॺǶௗΠٰाགᖴךޑࡰᏤ௲ɡླྀ
ॳԴৣǶவεΟ໒ۈ൩ޔӧԴৣޑჴᡍ࠻ᏢಞǴόޕό൩ѤԃΑǶךॺޑ ჴᡍ࠻ޑΓᗨฅόӭǴёࢂεৎ൩ႽঁεৎኬǴ೭ޑࢂᅿᅽǶନΑᏢ
ೌБय़ǴԴৣޑΓೀШϐၰΨࢂࡐॶளךᏢಞޑǶགᖴޑ၉Ǵ҉ᇻᇥόֹǴ
ϪᅰӧόقύǶௗाགᖴךޑα၂ہǺ݅లԴৣǵ߲݊ؼԴৣаϷጰֻܴ
ᙴৣǶᖴᖴԴৣॺ๏ϒךჴᡍБӛޑࡰᏤаϷᔅշǴᡣךᕇؼӭǶϐࡕाགᖴ ჴᡍ࠻܈ჴᡍࡰᏤ܈ᔅշၸךޑΓǺλᅴǵߓఃǵǵࡿᐇǵߓੀǵࡏ։ǵ ఌܴǵߪ݇ǵ◖ǵદᆝǵѯѭǵБैǵഩૈǵ᪳ዅǵलᆺǵࡹસǵඳՉǵ։ǵ ֆ׆ണǵᆬଈаϷη⪭ǶᅅޑΓޑፎόाϟཀǶӆٰฅाགᖴӧךङࡕᓨ ᓨЍךޑኑ϶ॺǺSfcfdbǵKpmjfǵNbhhjfǵTboesbǵCIǵCfuuz!XpohǵLbuiz کॳଶǶᗋԖځдࡐӭޑܻ϶ॺǴλጩݒǵTfmfobǵΟಔϖޑգॺǴϖࢃǴ
ؒԖᒤݤठᖴǴՠך࣬ߞգॺܴқޑǶନԜϐѦǴฅाձགᖴ᐀ҏǴ
ଆوΑϤԃѠεޑᏢಞਓำǴךҗ૱ӦགᖴၡԖգޑഉՔаϷᔅշȐգΨ
ޑᔅΑךϼӭΑȑǴ࣬ߞӧգيᜐޑΓǴۓགڙډգ๏дॺޑǼךઔᅽ
գ҉ᇻ۩ᅽזǼനࡕǴךाགᖴѠεаϷᙴמسޑ܌ԖԴৣǶѠεගٮΑঁ
ࡐӳޑᏢಞᕉნǴ๏ϒᏢғаϷႾғࡐӭᏢಞޑᐒаϷၗྍǶགᖴᙴמسޑ܌
ԖԴৣǴᙴמسࢂঁࡐྕཪޑس܌Ǵགᖴ܌ԖԴৣၡޑᔅԆаϷྣ៝Ƕቪ ډ೭္ϝԖࡐӭΓགྷाགᖴǴϝԖࡐӭགᐟޑ၉གྷᇥǴတ㚊ޔԖाགᖴޑΓ
Ǵ࣬ߞךࢂঁࡐ۩ᅽޑΓګǼᖴᖴ๏ך۩ᅽޑ܌ԖգॺǴᖴᖴǼ!
ᖴᖴ"ӭᖴ"Uibol!zpv"!Ubdl!ubdl"!!
ii
ᄔ ᄔा
ਥᏵѠՉࡹଣፁғ 2008 ԃԝӢीၗǴεဉޔဉᕎӧت܄܈ζ܄ύࢂ
௨ӜಃΟՏޑᕎੱԝӢǶϐҁࣴز࠻ଞჹεဉޔဉᕎဍዦᔠᡏՉಃѤဦࢉՅ ᡏ ϐ ༾ ፁ ࢃ ว ғ Ѩ ౦ ӝ ܄ (loss of heterozygosity, LOH) ޑ ϩ Ǵ ว
4q25-4q28.3ύԖ 3 ঁวғᓎၨଯ(23.1%-28.0%)ޑմନୱǶԶӧځдᕎੱҭ
ൔᏤಃѤဦࢉՅᡏϐߏᖉ(q arm)ԖวғմନޑຝǴԶፕಃѤဦࢉՅᡏёૈ
Ӹӧᕎ୷ӢǶӧҁࣴز࠻วޑঁᓎၨଯޑմନୱ(4q28.3)ǴӸӧಒझ
֎ߕϩη Protocadherin 10 (PCDH10)୷ӢǶҞޕၰ PCDH10 Ԗٿᅿ RNA ౢނǴ ϩձࣁ PCDH10 variant 1 (PCDH10 V1)ک PCDH10 variant 2 (PCDH10 V2)Ƕ߈ٰ
ޑࣴزวӧځдᕎੱύǴPCDH10 ёૈתᄽᕎ୷ӢޑفՅǶନΑࢉՅᡏ ޑմନǴҁࣴز࠻ϐଞჹ PCDH10 ܭεဉޔဉᕎύ୷ӢࡕғᒪঅႬޑࣴزǴ ว PCDH10 ୷Ӣ௴η(promoter)ԖၸࡋҘ୷ϯޑຝǶӆޣǴځ mRNA ӧε ဉޔဉᕎޑဍዦಔᙃϐ߄ǴܴᡉӦКځԋჹϐ҅தᗹጢಔᙃၨեǶϐࡕҭଞჹ
PCDH10ՉΑфૈ܄ޑǴว PCDH10 ӧεဉޔဉᕎಒझਲ਼ύӆࡋ߄
ࡕǴёаڋᕎಒझߟҍаϷဂပԋǴᡉҢ PCDH10 ёૈࣁᕎ୷ӢǶ ҁፕЎճҔख़ཥࡷᒧޑ PCDH10 V1 ک PCDH10 V2 ϐᛙۓ߄ಒझਲ਼ǴӃՉಒ झቚғޑჴᡍǴว PCDH10 V1 ܭεဉޔဉᕎಒझӆ߄ਔǴڋಒझޑ ғߏǴՠӆ߄ PCDH10 V2 ߾ᢀჸόډӕኬޑຝǶϐࡕӆՉߦಒझΫ ޑჴᡍǴคፕࢂ PCDH10 V1 ܈ࢂ PCDH10 V2 ࣣёߦಒझΫǶନԜϐѦǴճ Ҕᛰނ camptothecin ೀ PCDH10 V1 ܈ PCDH10 V2 ӆ߄ϐಒझਲ਼Ǵ่݀ᡉҢ
PCDH10 Ӹӧਔቚуᕎಒझჹᛰނޑགڙ܄ǶќѦǴҁፕЎҭीѤঁϩթ ӧ PCDH10 ୷Ӣ 5 ᆄک 3 ᆄޑ༾ፁࢃǴଞჹεဉޔဉᕎဍዦ PCDH10 วғჹଽ୷ӢલѨ(allelic deletion)ޑǶܭ 191 ঁεဉޔဉᕎဍዦᔠᡏύǴԖ
57 ঁ(29.8%)วғ PCDH10 ჹଽ୷ӢޑલѨǴӕਔǴԜ୷Ӣᡂ౦ᆶεဉޔဉᕎࡕ
iii
යޑᙯ౽࣬ᜢǴЪੰΓϐӸࢲҭၨৡǶҗܭࣴز࠻ϐමଞჹ PCDH10 Չ୷ ӢࡕғᒪঅႬޑǴࡺճҔځ่݀Ǵଛӝჹଽ୷ӢલѨᆶցǴՉੰΓӸࢲ ϩǴԶӕਔԜٿᅿ୷ӢᡂϯਔǴځᆶੰΓޑӸࢲ٠ؒԖᡉޑ࣬ᜢ܄Ƕ നࡕǴҁፕЎҭճҔ DNA ኧᔠෳ(copy number assay)аࣴزεဉޔဉᕎဍዦύ
PCDH10 ୷Ӣኧޑᡂ౦Ǵ٠ᆶ LOH ࣴزޑ่݀࣬КၨǴ่݀ᡉҢԜΒБݤޑ
่݀٠όֹӄ಄ӝǶᆕӝа่݀ǴPCDH10 ޑӆ߄ёаߦεဉޔဉᕎಒझ ϐΫǴӕਔԜ୷ӢӧεဉޔဉᕎဍዦύԖଯКٯϐဍዦวғჹଽ୷ӢલѨޑ
ຝǴࣣЍ PCDH10 ӧεဉޔဉᕎϯၸำύڀԖᕎޑфૈǶ
ᜢᗖຒǺεဉޔဉᕎǵѨ౦ӝ܄ǵPCDH10ǵಒझΫǵ ჹଽ୷ӢલѨ
iv
Abstract
Colorectal cancer (CRC) is the third leading cause of cancer death for both genders in Taiwan according to the report by the Department of Health, Executive Yuan, R.O.C., in 2008. Our previous investigation of allelic losses of microsatellites at chromosome 4q25-4q28.3 in CRC revealed three regions with higher frequency (23.1%-28.0%) of incidences. Deletions of chromosomal 4q were also reported in various carcinomas, suggesting putative tumor suppressor genes may exist within the chromosome region.
Protocadherin 10 (PCDH10) is located at 4q28.3, which is one of the three common
deletion regions defined. There are two transcript variants of PCDH10, namely PCDH10 variant 1 (PCDH10 V1) and PCDH10 variant 2 (PCDH10 V2). Recent
studies of PCDH10 in multiple carcinomas suggested that it may be a candidate tumor suppressor gene. Besides genomic deletion, studies of PCDH10 at our lab also indicated that PCDH10 may be regulated by epigenetic modification in CRC cells.
Consistently, PCDH10 mRNA expression was significantly lower in CRC tumor tissues compared with the paired normal mucosae. Functional studies, such as invasion assay and colony formation assay, also indicated that PCDH10 as a tumor suppressor.
In the present study, new single stable clones of PCDH10 V1 and PCDH10 V2 were selected. A reduction in cell proliferation was observed when PCDH10 V1, but not PCDH10 V2, was re-expressed in CRC cells. Investigation of proapoptotic activities of
PCDH10 V1 and PCDH10 V2 revealed increased apoptosis and enhanced camptothecin susceptibility when either one was re-expressed in CRC cells. On the other hand, PCDH10 allelic deletion was studied by using four newly designed microsatellite markers flanking the 5’ and 3’ regions of the gene. Out of the 191 CRC studied, 57 (29.8%) tumors exhibited allelic deletion of PCDH10. Importantly, the genetic alteration is correlated with distal metastasis of CRC and poorer overall
v
survival. However, simultaneous analysis of patient survival related to both the incidence of LOH and promoter hypermethylation of PCDH10 revealed no significant correlation. Copy number assay was also used to detect copy number variation of PCDH10 in CRC. Nevertheless, no positive correlation could be found between copy
number variation and the results of the LOH study. In conclusion, induction of apoptosis by PCDH10 re-expression in CRC cells and high incidence of PCDH10 allelic deletion in CRC tumors support its role as a tumor suppressor in colorectal tumorigenesis.
Keywords: Colorectal cancer, Loss of heterozygosity, PCDH10, Proapoptotic activity, Allelic deletion
vi
Content
Acknowledgement ... i
ᄔा ... ii
Abstract ... iv
Content ... vi
Abbreviation ... viii
Figure content ... ix
Table content ... xi
1. Introduction ... 1
1.1 Colon and rectum ... 1
1.2 Colorectal cancer ... 2
1.2.1 Two major pathways in colorectal carcinogensis ... 3
1.2.2 Epigenetic pathway in colorectal carcinogenesis ... 4
1.3 Protocadherin 10 (PCDH10) ... 5
1.3.1 Recent studies of PCDH10 ... 6
1.3.2 PCDH10 and apoptosis ... 8
1.3.3 Deletion of chromosome 4q28 and cancer ... 9
1.3.4 Studies of PCDH10 at our lab ... 9
2. Specific aims ... 11
3. Materials and methods ... 12
3.1 Study of cell biological functions of PCDH10 ... 12
3.1.1 Cell culture ... 12
3.1.2 Vector construction ... 12
3.1.3 Cell transfection and stable clone selection... 13
3.1.4 Western blotting ... 14
vii
3.1.5 Cell proliferation assay ... 14
3.1.6 Camptothecin treatment ... 15
3.1.7 Flow cytometry analysis for apoptosis ... 15
3.1.8 Study of epithelial-to-mesenchymal transition ... 16
3.2 Study of allelic deletion of PCDH10 ... 17
3.2.1 Patients ... 17
3.2.2 DNA extraction ... 18
3.2.3 Loss of heterozygosity study ... 18
3.2.4 Automated fluorescence-based PCR assay... 19
3.2.5 Copy number assay ... 20
3.3 Statistical analysis ... 20
4. Results ... 22
4.1 Cell biological functions of PCDH10 ... 22
4.1.1 Selection of PCDH10 variant 1 and PCDH10 variant 2 single stable clones 22 4.1.2 Apoptosis induced by PCDH10 ... 23
4.1.3 Regulation of epithelial-to-mesenchymal transition by PCDH10 ... 24
4.2 Allelic deletion of PCDH10 ... 25
4.2.1 Loss of heterozygosity of PCDH10 ... 25
4.2.2 Copy number variation of PCDH10 ... 30
5. Discussion ... 32
Figures ... 39
Tables ... 56
References ... 68
Appendix ... 72
viii
Abbreviation
Abbreviation Full name
APC BSP
Adenomatous polyposis coli
Bisulfite-sequencing polymerase chain reaction
CGH Comparative genomic hybridization
CIMP CpG island methylator phenotype
CIN Chromosomal instability
CRC Colorectal cancer
DFS Disease-free survival
DMSO Dimethyl sulfoxide
EMT FAP
Epithelial-to-mesenchymal transition Familial adenomatous polyposis
FBS Fetal bovine serum
GI tract HNPCC
Gastrointestinal tract
Hereditary non-polyposis colorectal cancer
LOH Loss of heterozygosity
MMR Mismatch repair
MSI Microsatellite instability
MSP MSS
Methylation specific polymerase chain reaction Microsatellite stable
OS Overall survival
PBMC Peripheral blood mononuclear cell
PBS Phosphate buffered saline
PCDH10 Protocadherin 10
PCDH10 V1 Protocadherin 10 variant 1 PCDH10 V2 Protocadherin 10 variant 2
PCR Polymerase chain reaction
PVDF Polyvinylidene fluoride
RT-PCR Reverse transcriptase polymerase chain reaction TBST Tris-HCl buffered saline with Tween-20
WHO World Health Organization
ix
Figure content
Figure 1. Protein expression of newly selected PCDH10 variant 1 and PCDH10 variant 2 single stable clones. ... 39 Figure 2. Cell proliferation of four new single stable clones of PCDH10 V1 using MTT assay (A) and the corresponding protein expression (B). ... 40 Figure 3. Cell proliferation of four new single stable clones of PCDH10 V2 using MTT assay (A) and the corresponding protein expression (B). ... 41 Figure 4. Re-expression of PCDH10 V1 and PCDH10 V2 induced spontaneous
apoptosis of CRC cell line, HCT116. ... 42 Figure 5. Camptothecin-induced apoptosis of PCDH10 V1 and PCDH10 V2 single stable clones. ... 43 Figure 6. Relative expression of E-cadherin in all PCDH10 single stable clones. ... 44 Figure 7. Different concentration of TGF-β treatment on CRC cell lines, SW480 and HT29, for 24 or 48h. ... 45 Figure 8. Seven microsatellite markers for the detection of allelic deletion of PCDH10 by LOH study. ... 46 Figure 9. Optimization of PCR condition for the seven markers designed. ... 47 Figure 10. Detection of polymorphisms of the seven markers in a panel of eight DNA samples from normal PBMCs. ... 48 Figure 11. Four markers designed for the study of allelic deletion of PCDH10. ... 49 Figure 12. Results of LOH study of one paired CRC sample analyzed by GeneScan. .. 50 Figure 13. Kaplan-Meier survival analysis of CRC patients according to allelic deletion of PCDH10 gene. ... 51 Figure 14. Kaplan-Meier survival analysis of CRC patients according to allelic deletion
x
of PCDH10 gene. ... 52 Figure 15. Kaplan-Meier survival analysis of CRC patients according to methylation . 53 status of PCDH10 promoter region. ... 53 Figure 16. Kaplan-Meier survival analysis of 65 CRC patients according to LOH and promoter hypermethylation (Me) of PCDH10 gene... 54 Figure 17. Copy number assay of PCDH10 gene. ... 55
xi
Table content
Table 1. Patient clinicopathological characteristics ... 56 Table 2. Primers for LOH study ... 58 Table 3. LOH frequencies of the four microsatellite markers in 211 patients with CRC 59 Table 4. Relationship between patient clinicopathological characteristics and the
incidence of LOH for each marker ... 60 Table 5. Relationship between patient clinicopathological characteristics and allelic deletion of PCDH10 gene ... 62 Table 6. Correlation of overall survival and disease-free survival with allelic deletion of PCDH10 in CRC patients ... 64 Table 7. Correlation of overall survival and disease-free survival with allelic deletion and/or promoter hypermethylation in patients with CRC. ... 65 Table 8. LOH study and copy number assay at PCDH10 gene for three CRC cases ... 67
1
1. Introduction
1.1 Colon and rectum
Colon and rectum belong to the large intestine which is the terminal part of the gastrointestinal tract (GI tract).
Colon is divided into ascending, transverse, descending and sigmoid colon.
Ascending colon ascends from the lower right side of the abdomen, turns at the right colic (hepatic) flexure, then continues to the left and makes up the transverse colon. At the left colic (splenic) flexure, the colon turns and descends to the lower left side of the abdomen which forms the descending colon, followed by the sigmoid colon and ends at the rectum. The rectum is the last part of the large intestine, with anal canal at its terminal. The opening of the anal canal is the anus.
The main function of the colon is water, ions and vitamins absorption through the absorptive cells. Bacteria inside the colon also help to break down proteins and ferment any remaining carbohydrates. Feces formed will then be eliminated from the body.
Colon is different from the small intestine in a way that there are no villi found in the mucosa, while the submucosa is similar to the rest of the GI tract. The next two layers come the muscularis and serosa, with serosa being part of the visceral peritoneum.1
2
1.2 Colorectal cancer
According to the World Health Organization (WHO), cancer is the leading cause of death worldwide which accounted for 7.9 million deaths in 2007. The WHO estimates that cancer will cause 12 million deaths in 2030.2 In Taiwan, according to the Department of Health, Executive Yuan, R.O.C. (Taiwan), cancer is the leading cause of death in Taiwan in 2008, with colorectal cancer (CRC) being the third leading cause of cancer death for both genders (Appendix Table 1 & 2).3
CRC refers to the cancer formed in the tissue of colon and rectum. Approximately 75% of CRCs are sporadic, while the remaining 25% are familial disease.4 The two most common familial CRCs are familial adenomatous polyposis (FAP) and hereditary non-polyposis colorectal cancer (HNPCC). FAP patients inherit mutated germline Adenomatous polyposis coli (APC), a tumor suppressor gene at chromosome 5q in CRC which leads to the development of hundreds to thousands colorectal adenomas and therefore, the early onset of carcinomas.5 Contrary to FAP, patients of HNPCC do not exhibit unusual number of polyps. The cause of HNPCC is due to inherited mutations in the DNA mismatch repair genes which cannot repair DNA errors whenever they occur. As a result, errors may contribute to the mutations in some tumor suppressor genes, and finally lead to the occurrence of carcinomas. HNPCC is also
3
known as Lynch syndrome.6
CRC is a multistep process, which may be resulted from genetic alterations in the oncogene such as ras gene mutations or the tumor suppressor genes inactivation, chromosomal losses or allelic losses of tumor suppressor genes, as in the case of the loss of chromosome 17p which contains the p53 gene, etc. The above multistep process was proposed as the “adenoma-carcinoma sequence” model for the tumorigenesis of sporadic CRC by Fearon and Vogelstein in 1990.7 This model states that CRC arises from adenoma which then proceeds to carcinoma with the accumulations of a series of genetic alterations.
1.2.1 Two major pathways in colorectal carcinogensis
Chromosomal instability (CIN) pathway
Chromosomal instability refers to the loss, gain or translocation of chromosomal segments. Around 85% of CRCs belong to this group. When chromosomal instability takes place where tumor suppressor gene is located, tumorigenesis may occur due to the loss of functions of the tumor suppressor gene. Deletion at 1p and 8p, as well as
loss of heterozygosity (LOH) of 17p and 18q, are frequently found in CRC.5 8 9
Microsatellite instability (MSI) pathway
4
Microsatellites are short nucleotide repeat sequences dispersed throughout the genome.
When DNA replicates, inappropriate base insertion or DNA replication slippage may occur at these repeat sequences, resulting in insertion or deletion loops formation. In normal condition, loops are usually repaired. However, if there are defects in the DNA mismatch repair (MMR) enzymes, these loops cannot be repaired and mutations tend to accumulate in these microsatellite regions, resulting in alleles of different sizes.
Microsatellite instability takes place in tumor suppressor genes may lead to the malfunction of its tumor suppressing ability, thus leading to tumorigenesis. Tumor carrying alleles of different sizes due to defect in MMR genes is called microsatellite instability (MSI) tumor. Around 15% of sporadic CRCs belong to this group and more than 95% HNPCCs have MSI identified in them.5 8 9
1.2.2 Epigenetic pathway in colorectal carcinogenesis
Hypermethylation of CpG islands in the 5’ promoter region of gene usually leads to the silencing of gene. This is known as epigenetic regulation. Recently, epigenetic modification was proposed to be involved in CRC tumorigenesis. Silencing of the tumor suppressor genes or DNA mismatch repair genes such as hMLH1 was reported. Around 30% to 50% of CRCs show evidences of CpG island hypermethylation. Tumors demonstrating hypermethylation and thus silencing of genes are known as CpG island
5
methylator phenotype-positive (CIMP) tumors.10
1.3 Protocadherin 10 (PCDH10)
Protocadherins are members of a non-classic subfamily of calcium-dependent cell–cell adhesion molecules in the cadherin superfamily. Subfamily members of protocadherins contain similar extracellular domain structure, a transmembrane domain but a different cytoplasmic tail.11 Protocadherin 10 (PCDH10/OL-PCDH /KIAA1400) is the human orthologue of mouse Pcdh10. It is located at chromosome 4q28.3. There are two transcript variants of PCDH10, namely PCDH10 variant 1 (PCDH10 V1) and PCDH10 variant 2 (PCDH10 V2). The first exon of PCDH10 V1 encodes the extracellular domain which contains six ectodomain repeats (extracellular repeat domains, EC domains), as well as the transmembrane domain and the cytoplasmic domain, while the remaining exons encode an extension for the cytoplasmic tail. On the other hand, transcript of PCDH10 V2 ends in the first intron, resulting a single exon gene that encodes the three domains stated above.11
PCDH10 is mainly expressed in the olfactory bulb, most parts of the limbic system (hence the name OL-PCDH) and in the cerebellum, suggesting its function in cerebellum development.11 Recent analysis of PCDH10 knockout mice demonstrated that the striatal neurons could not extend their axons normally in the brain. Since
6
PCDH10 was highly concentrated in the axons’ growth zones, it suggests that PCDH10
may play a role in sustaining the normal migration of striatal axons.12 13 PCDH10 is also found to be expressed in other organs such as heart, kidney, lung, trachea and colon as revealed by reverse transcriptase polymerase chain reaction (RT-PCR). 14 15
PCDH10 was also reported to induce homophilic cell-cell adhesion ability.16
However, the cell-cell adhesion ability was weaker than that of the classical cadherins, suggesting that protocadherins may be involved in other functions such as signal transduction besides physical linking of cells.
Recently, regulatory elements in PCDH10 gene promoter was further identified and characterized by Li et al. using human prostate cancer cells. It was shown that the region between nucleotides -144 and -99 was essential to the promoter activity, and within this region, a CAAT box and a GT box were found to be important to the promoter regulation.17
1.3.1 Recent studies of PCDH10
In a study by Miyamoto et al. in 2005, CpG islands in the 5’ promoter region of PCDH10 was found to be aberrantly methylated in breast cancer cell lines and in
42.8% primary breast cancer tested. On the contrary, there is no CpG islands hypermethylation found in normal human mammary epithelial cells.18 In 2006, Ying et
7
al. identified PCDH10 as a candidate tumor suppressor for nasopharyngeal, esophageal
and multiple other carcinomas with frequent methylation. Moreover, transcriptional silencing of PCDH10 could be reversed by pharmacologic demethylation drug, suggesting PCDH10 may be regulated by epigenetic modification. In the same study, ectopic expression of PCDH10 in several carcinoma cell lines (nasopharyngeal carcinoma cell line CNE-1 and the esophageal carcinoma cell line EC109) strongly suppressed tumor cell growth, migration, invasion and colony formation ability.15 In 2007, the same research group identified the frequent methylation and silencing of PCDH10 in lymphoma cell lines as well as in primary tumors but not in normal
peripheral blood mononuclear cells (PBMCs) or lymph nodes, suggesting methylation of PCDH10 may also involve in lymphomagenesis.19 Methylation of PCDH10 in gastric cancer cell lines and in 81.7% primary gastric tumors tested was reported by Yu et al. in 2009,20 supporting its role as a tumor suppressor in various carcinomas.
Monosomy 4 and hypermethylation of promoter region of PCDH10 were also reported by Narayan et al.21 and Wang et al.22 in invasive cervical cancer. However, loss of heterozygosity using microsatellite markers (D4S2423) adjacent to PCDH10 was not observed.22 Recently, Cheung et al. reported the first application of methylated DNA immunoprecipitation-chip to detect epigentically regulated regions in human testicular cancer. In this study, one of the genes identified was PCDH10 and its promoter region
8
was found to be hypermethylated in testicular embryonal carcinoma cell line NT2.23 On the other hand, Yu et al. utilized high-resolution melting analysis to detect the methylation status of PCDH10 in gastric, colorectal and pancreatic cancers and reported that the methylation level of PCDH10 was significantly higher in tumor tissues than in normal tissues in all three type of cancers, supporting its role as a tumor suppressor.24
1.3.2 PCDH10 and apoptosis
In Yu et al. study in 2009, PCDH10 re-expression in gastric cancer cell line MKN45 was found to induce apoptosis and reduce cell proliferation. cDNA array analysis of MKN45 stably transfected with PCDH10 revealed that several genes involved in apoptosis, proliferation, and invasion/metastasis pathways were modulated by PCDH10.20
Another study by Ding et al. in 2009 reported that downregulation of human brain expressed X-linked 1 (hBex1) inhibited apoptosis induced by imatinib in Bcr/Abl+ leukemic cells. Further investigations pointed out that hBex1 is associated with PCDH10, and silencing of PCDH10 also attenuated apoptosis induced by imatinib in
hBex1 transfected cells, suggesting that PCDH10 may participate in the apoptosis of cancer cells.25
9
1.3.3 Deletion of chromosome 4q28 and cancer
High loss of heterozygosity (LOH) frequency in 4q28 region was first reported in primary hepatocellular carcinoma cases by Hammond et al. in 1999, indicating important tumor suppressors within or in vicinity of this region.26 In 2004, Knösel et al.
used comparative genomic hybridization (CGH) to screen CRCs for chromosomal aberrations that were associated with metastatic phenotype. Deletions were prominent at 4q27-4q28.27 In addition, loss in copy number at 4q28.3 in pancreatic adenocarcinoma,28 a 4.5-megabase deletion at 4q28 in prostate cancer cells29 and chromosomal loss at 4q28-32 in breast cancer were also reported.30
1.3.4 Studies of PCDH10 at our lab
Previous studies of LOH at chromosome 4q25-4q28.3 identified 3 regions with high frequency of LOH; PCDH10 is located within one of these regions. Epigenetic studies of PCDH10 in CRC cell lines and patient tumor samples revealed that 5’ promoter region of PCDH10 was highly methylated when compared to the paired normal tissue.
Treatment of five CRC cell lines with demethylation drug 5-aza-2’-deoxycytidine also restored RNA expression of PCDH10, implying that PCDH10 was regulated by epigenetic modification. Investigation of PCDH10 V1 RNA expression in CRC
10
primary samples also indicated a decreased expression level in tumor than in normal tissue. However, expression pattern of PCDH10 V2 was inconsistent; though predisposed to co-express with PCDH10 V1 when the expression level of it was high.
Functional assays using PCDH10 V1 single stable expression clones in CRC cell line HCT116 showed that both proliferation and colony formation ability of cells decreased, but no similar observations were found in PCDH10 V2 single stable expression clones.
Moreover, PCDH10 V1 and PCDH10 V2 were found to co-localize in cell membrane.
In conclusion, PCDH10 may be a putative tumor suppressor gene associated with colorectal carcinogenesis.
11
2. Specific aims
Since PCDH10 was reported as a putative tumor suppressor gene in multiple carcinomas, and several functional assays by our lab and others also revealed supportive results, we therefore want to investigate the proapoptotic activity of PCDH10 in CRC cells. On the other hand, since chromosomal deletion is frequently found at chromosome 4q28 in other various carcinomas and PCDH10 is located within this region, we would like to analyze the LOH frequency of PCDH10 in CRC using four newly designed microsatellite markers flanking the 5’ and 3’ regions of the gene and to assess the clinical relevance of PCDH10 allelic deletion in CRC.
12
3. Materials and methods
3.1 Study of cell biological functions of PCDH10
3.1.1 Cell culture
Human CRC cell line HCT116 (gift from Dr. SL Yu), was cultured in RPMI-1640 (GIBCO-Invitrogen) supplemented with 10% fetal bovine serum (FBS, HyClone) without antibiotics under 95% air and 5% carbon dioxide (CO2) at 37qC. Human CRC cell lines SW480 and HT29 (purchased from the Food Industry Research and Development Institute and gift from Dr. SL Yu, respectively), were cultured in DMEM (GIBCO-Invitrogen) supplemented with 10% FBS (HyClone) without antibiotics under 95% air and 5% CO2 at 37qC.
3.1.2 Vector construction
Vector construction was done by previous senior coworkers Yen-Chun Lai and Chao-Ha Fu. Briefly, PCDH10 V1 and PCDH10 V2 cDNA was obtained from MCF7 and were cloned into the mammalian expression vector pcDNA3.1/V5-His-TOPO (Invitrogen, Appendix Figure 1). The two constructs were named as pcDNA3.1/PCDH10.v1 and pcDNA3.1/PCDH10v.2 for PCDH10 V1 and PCDH10 V2, respectively.
13
3.1.3 Cell transfection and stable clone selection
Transfection was performed using LipofectamineTM 2000 (Invitrogen) according to the manufacturer’s instructions. Briefly, 18h before transfection, 5x10⁵ cells per well of a 6-well plate were seeded (~90% confluence) in 2mL RPMI-1640 containing 10% FBS.
During transfection, LipofectamineTM 2000 and plasmid DNA were mixed in a 2.5:1 ratio (10μL LipofectamineTM 2000 and 4μg plasmid DNA purified by QIAGEN Plasmid Midi Kit). Both were diluted with 250μL of Opti-MEM Ι Reduced Serum Medium (Invitrogen) before complexing and allowed to stand at room temperature for 5 min. The diluted Lipofectamine was then mixed with the diluted plasmid DNA and incubated at room temperature for 20 min. The complexes were then added to the cells and incubated at 37qC in a 5% CO2 incubator for 6 h. Medium will be changed back to RPMI-1640 with 10% FBS only and incubated at the same condition for a further 18h (Total 24h since the time of introduction of the complexes). Part of the cells will then be collected for western blotting to confirm protein expression. For stable clone selection, 1200μg/mL G418 (Geneticin, GIBCO) was added 24h after transfection and kept selecting for at least 2-3 weeks. Single stable clones obtained were then kept at a final concentration of 600μg/mL G418.
14
3.1.4 Western blotting
Total cellular extracts were obtained by RIPA lysis buffer with protease inhibitor.
Protein concentrations were determined by the Bradford method (Bio-Rad). 4μL 4x sodium dodecyl sulfate loading dye was added to 12μL sample, and the sample was boiled for 10 min. Protein samples (50μg per lane) were separated on sodium dodecyl sulfate-polyacrylamide gel electrophoresis and transferred to polyvinylidene fluoride (PVDF) membrane (Millipore). The membrane was then blocked with 5% skim milk in Tris-HCl buffered saline containing 0.025% Tween-20 (TBST) at room temperature for 1h followed by incubation with the primary antibody for 1.5h at room temperature or overnight at 4qC. The membrane was then washed with TBST thrice (10 min per wash) and then incubated with the corresponding horseradish peroxidase-conjugated secondary antibody for 1h at room temperature. The membrane was then washed as previously described. The bands were visualized using the Western Lightning Chemiluminescence Reagent Plus (PerKinElemer) and detected by Fujifilm LAS 4000 Imager.
3.1.5 Cell proliferation assay
MTT assay for cell proliferation was performed for single stable clones of PCDH10
15
V1 and PCDH10 V2. Briefly, 3000 cells per well were seeded in a 96-well plate in four replicates. The colorimetric MTT (Amresco) assay was used to measure cell numbers at 24, 48, 72, 96 and 120h. 50μg MTT was added to each well and incubated for 90 min at 37qC, followed by dissolving the formazan by 100μL Dimethyl sulfoxide (DMSO). Absorbance at 570nm was then measured.
3.1.6 Camptothecin treatment
Camptothecin was isolated from the bark and stem of Camptotheca acuminata (Camptotheca, Happy tree). It binds irreversibly to the DNA-topoisomerase I complex, and traps the enzyme in a covalent linkage with DNA, thus depleting cellular topoisomerase I. However, due to its low solubility and adverse drug effect, it is no longer adapted in chemotherapy, though derivatives of it are developed and approved for use in chemotherapy such as irinotecan.31 Camptothecin (Sigma-Aldrich) is employed in our study to induce apoptosis in CRC cells.
3.1.7 Flow cytometry analysis for apoptosis
1 x 10⁶ cells per well were seeded in a 6-well plate or 1.5 x 10⁵ cells per well were seeded in a 12-well plate. For medium only condition, cells were incubated in RPMI-1640 with 10% FBS with or without 600μg/mL G418 for 48h. For camptothecin treatment, cells were first plated for 24h, then 10ng/mL camptothecin (Sigma-Aldrich)
16
will then be added in the medium and incubated for a further 18h. Cells treated with 0.01% DMSO at the same time interval act as the control group since camptothecin has to be dissolved in DMSO. Cells will then be collected and detected for apoptosis using ANNEXIN V-FITC Kit (Beckman Coulter) as instructed by the manufacturers. Briefly, cells were washed by cold PBS (pH7.4) twice, followed by addition of 100μL cold 1x binding buffer, and stained with 1μL of Annexin V-FITC and 5μL propidium iodide (PI). After incubation for 15 min in the dark on ice, the cells are ready to be analyzed by flow cytometry.
3.1.8 Study of epithelial-to-mesenchymal transition
TGF-β1 (PeproTech) was used to induce microsatellite stable (MSS) CRC cell lines SW480 and HT29 to undergo epithelial-to-mesenchymal transition (EMT). 32 Briefly, 5, 10 or 20ng/mL TGF-β1 was used to treat the above CRC cell lines for 24 or 48 hours with 1% or 10% FBS in order to test the optimal condition for TGF-β1 treatment.
Afterwards, cells were collected for investigation of the EMT markers, E-cadherin and vimentin by western blotting (Mouse anti-E-cadherin antibody, BD Transduction LaboratoriesTM and mouse anti-vimentin monoclonal antibody, Chemicon). For the investigation of involvement of PCDH10 in EMT pathway, cells were seeded in a 6-well plate to achieve 90% confluence for each cell line used for 18h, then either 4μg
17
pcDNA3.1/V5-His-TOPO or PCDH10 V1 plasmid was transfected to the cells. 24h after transfection (procedure as described above), 10ng/mL TGF-β1 was added to each well and incubated for a further 24h or 48h. Cells were then collected for investigation of the above EMT markers by western blotting.
3.2 Study of allelic deletion of PCDH10
3.2.1 Patients
A total of 211 patients with sporadic CRC, who underwent surgery between August 1997 and June 2009 at the Cardinal Tien Hospital, Taiwan, were recruited. Patient clinicopathological characteristics were summarized in Table 1. Median age of patients at disease diagnosis was 73 (range 37-98) years. Male to female ratio was 110:101. Out of the 211 patients, 49 patients with their tumors located at the proximal colon (cecum, ascending colon, and transverse colon), while the remaining 162 patients with their tumors located at the distal colon (descending colon, sigmoid colon, rectosigmoid junction, and rectum). Tumors were staged using the modified Dukes’ classification33. There were 22 patients in Dukes’ A, 83 in Dukes’ B, 66 in Dukes’ C and 40 in Dukes’
D. Tumor stage was further subdivided into early stage (Dukes’ A and B) and late stage (Dukes’ C and D), with 105 and106 patients, respectively. Distal metastasis (Dukes’ D) and no distal metastasis (Dukes’ A, B and C), with 40 and 171 patients, respectively.
18
For pathological differentiation, 155 tumors were graded as moderately differentiated, 54 as poorly differentiated and two without pathological reports. No patients received preoperative chemotherapy and/or radiotherapy. For disease recurrence assessment, only 140 patients with either Duke’s B or C, who underwent surgery before December 31st, 2008 were recruited. Follow-up was continued until April 2010. Out of 140 patients, there were five patients without follow-up after surgery, five patients who died of post-operative complications, and one patient without curable surgery, they were excluded from disease recurrence analysis. For the remaining 129 patients, 34 exhibited disease recurrence and 95 patients did not.
3.2.2 DNA extraction
DNA extraction was performed using the QIAamp DNA mini kit (QIAGEN) according to the manufacturers’ protocol. DNA concentration was tested by Nanodrop 2000 (Thermo Scientific). Final DNA concentration was adjusted to 10ng/μL for the polymerase chain reaction (PCR).
3.2.3 Loss of heterozygosity study
Four markers for the LOH study were newly designed flanking the 5’ and 3’ regions of PCDH10 with the help of a web software for MicroSatellite Marker Development.34
Polymorphic loci contain dinucleotide and trinucleotide were selected. Microsatellite
19
repeats were amplified by PCRusing the primers labeled with fluorescence at the 5’
end of each forward primer (Applied Biosystems) as in Table 2. Briefly, 20 ng DNA template was mixed with 5 μM of each sense and antisense primer, 2.5 mM dNTP, 10x reaction buffer and 0.3 units of HOT FIREPol DNA polymerase (Solis BioDyne).
Final reaction volume is 6μL. DNA template was amplified using the TGradient Thermocycler (Biometra).Thermal cycling consisted of initial denaturation at 95qC for 10 min, followed by 35 cycles of 95qC for 30 sec, annealing at 60°C for 30 sec, and elongation at 72qC for 30 sec, with final elongation for an additional 10 min at 72qC. If necessary, PCR products were visualized in 2% agarose gel with ethidium bromide.
(Appendix Table 3)
3.2.4 Automated fluorescence-based PCR assay
Fluorescent PCR products of the four markers were mixed in a fixed ratio (D4P1:
D4P2: D4P3: D4P4= 0.5μL: 0.5μL: 1μL: 3μL). Formamide and size standard Rox-400 (Applied Biosystems) were then added to the mixed PCR product, boiled at 94qC for 5 min and then kept on ice. Then, the mixture was subjected to ABI Prism 377 DNA Sequencer for electrophoresis-laser detection and computer analysis. Results were analyzed using the software GeneScan (Applied Biosystems). For LOH analysis, presence of heterozygous alleles was prerequisite for the evaluation of allelic losses.
20
LOH index was calculated using the formula: ratio of allele peak heights of normal tissue divided by the ratio of allele peak heights of the paired tumor tissue. When LOH index is d 0.67 or t 1.5, which corresponds to a minimal 33% decrease of the tumor allele, we defined the presence of allelic losses.35
3.2.5 Copy number assay
Copy number assay (Taqman®Copy number assay, Applied Biosystems) was performed according to the manufacturers’ protocol. Briefly, 20ng DNA was mixed with 2x TaqMan® Genotyping Master Mix, fluorescence labeled probe targeting exon 4 of PCDH10 and fluorescence labeled probe targeting endogenous reference gene RNaseP, which is known to be present in two copies in a diploid genome. The reaction is a duplex real-time PCR. The instrument used is the 7500 Fast System. Data is analyzed by the CopyCallerTM software from ABI.
3.3 Statistical analysis
For continuous variables, Students’ t-test was used. For categorical variables, Fisher’s exact test or chi-square test was used. Overall and disease-free survival was estimated by the Kaplan-Meier method and the survival curve was compared by the Log-Rank test. Statistical significance was considered when p value <0.05. All statistical analyses
21
were performed using SPSS 17.0 software package (SPSS, IL, USA) for Windows and GraphPad Prism (GraphPad Software, Inc.).
22
4. Results
4.1 Cell biological functions of PCDH10
4.1.1 Selection of PCDH10 variant 1 and PCDH10 variant 2 single stable clones
Protein level of both PCDH10 V1 and PCDH10 V2 single stable clones selected earlier dropped rapidly which were no longer suitable for functional assays. This may be a result of re-expression of PCDH10 which was disadvantageous to tumor cell growth.
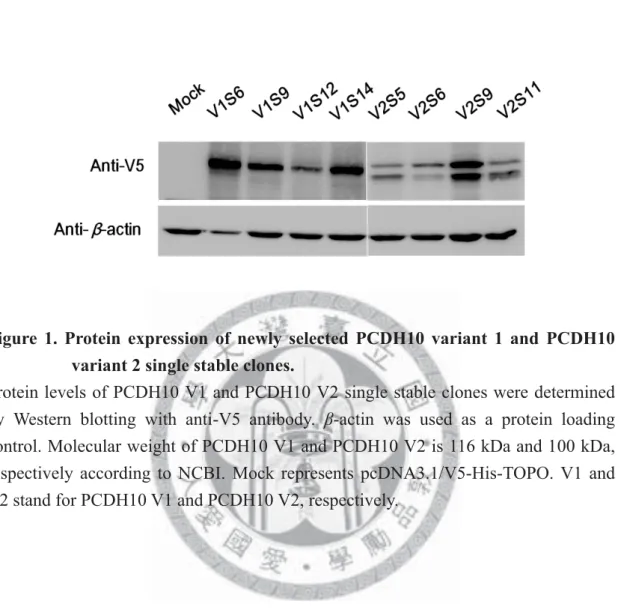
Therefore, new single stable clones for both variants were re-selected. For PCDH10 V1, there were four new single stable clones, namely PCDH10 V1S6, PCDH10 V1S9, PCDH10 V1S12 and PCDH10 V1S14. For PCDH10 V2, there were also four new single stable clones, namely PCDH10 V2S5, PCDH10 V2S6, PCDH10 V2S9 and PCDH10 V2S11. The stable cell line transfected with pcDNA3.1/V5-His-TOPO vector only will be abbreviated as “Mock” in the followings. Protein expression was confirmed by western blotting (Figure 1). Expression level of PCDH10 was the strongest in PCDH10 V1S6 for PCDH10 V1 and PCDH10 V2S9 for PCDH10 V2.
Since the previous results of proliferation assay from senior coworkers were controversial about the effect of PCDH10 expression. Therefore, we would like to perform the MTT proliferation assay with the newly selected single stable clones to
23
confirm the effect of PCDH10 re-expression (Figures 2 and 3). Since protein expression might decrease during cell subculturing, protein level was detected in parallel for each assay. The MTT assay of PCDH10 V1 single stable clones showed that the proliferation rate of all single stable clones with PCDH10 V1 re-expression decreased significantly when compared to Mock. However, for PCDH10 V2 single stable clones, the proliferation rates were all similar to Mock.
4.1.2 Apoptosis induced by PCDH10
Since PCDH10 was hypothesized as a putative tumor suppressor gene, we would like to investigate whether overexpression of PCDH10 can induce apoptosis in CRC cells or not. PCDH10 V1 and PCDH10 V2 single stable clones were recruited for the apoptosis study. The experiment was repeated three times independently.
Firstly, the ability of PCDH10 to induce apoptosis was tested using PCDH10 V1 and PCDH10 V2 single stable clones without any drug treatment. Outcomes of PCDH10 single stable clones were then compared with Mock, which is HCT116 with pcDNA3.1/V5-His-TOPO vector only. Results were shown in Figure 4. Apoptosis increased with the re-expression of PCDH10, regardless of PCDH10 V1 or PCDH10 V2, when compared to Mock. Meanwhile, Mock showed similar apoptosis percentage to the parental cell line, HCT116.
24
Secondly, we used camptothecin (10ng/mL) to induce apoptosis in PCDH10 V1 and PCDH10 V2 single stable clones to see whether re-expression of PCDH10 would increase the susceptibility of CRC cells to drug treatment. Since camptothecin has to be dissolved in DMSO, therefore, a control group using the same single stable clones treated with 0.01% DMSO was prepared to offset the effect of DMSO. Outcomes were compared with Mock treated with DMSO. Results were shown in Figure 5. The results indicated an increase to drug susceptibility of CRC cells when PCDH10 was re-expressed.
4.1.3 Regulation of epithelial-to-mesenchymal transition by PCDH10
Since PCDH10 is a transmembrane protein related to cytoskeleton, therefore, we would like to investigate whether PCDH10 played a role in EMT or not. One of the hallmark EMT marker, E-cadherin,36 was investigated in all PCDH10 single stable clones including both PCDH10 V1 and PCDH10 V2. Results were shown in Figure 6.
However, no significant differences were found between Mock and PCDH10 expressing single stable clones. As a result, other strategies for studying EMT were employed.
A study of Pino et al. revealed that SW480 and HT29 were responsive to TGF-β –induced EMT32. Therefore, we recruited these two cell lines for the following
25
EMT study. We tested the optimal condition for the experiments by using different concentration of TGF-β1 (5, 10 and 20ng/mL) to treat SW480 and HT29 for different time points (24h or 48h) to induce EMT (Figure 7). Protein expression of the mesenchymal marker, vimentin, cannot be detected in TGF-β-untreated or -treated HT29 cells in out lab, which was different from Pino’s report. Therefore, we excluded this cell line for our study. As for TGF-β treatment in SW480, the results showed more prominent changes in E-cadherin and vimentin protein expression with 5 or 10 ng/mL of TGF-β treatment for 24h. Finally, condition using 10ng/mL TGF-β treatment for 24h was employed for the study of PCDH10 involvement in EMT, which was the same concentration used as in previous studies. The parental CRC cell line used for PCDH10 transfection, HCT116, is a microsatellite unstable cell line, and harbors biallelic mutational inactivation of TGF-βR҈.37 As a result, HCT116 is insensitive to the treatment of TGF-β. Therefore, the PCDH10 expressing cell clones are not suitable for the TGF-β-induced EMT study.
4.2 Allelic deletion of PCDH10
4.2.1 Loss of heterozygosity of PCDH10
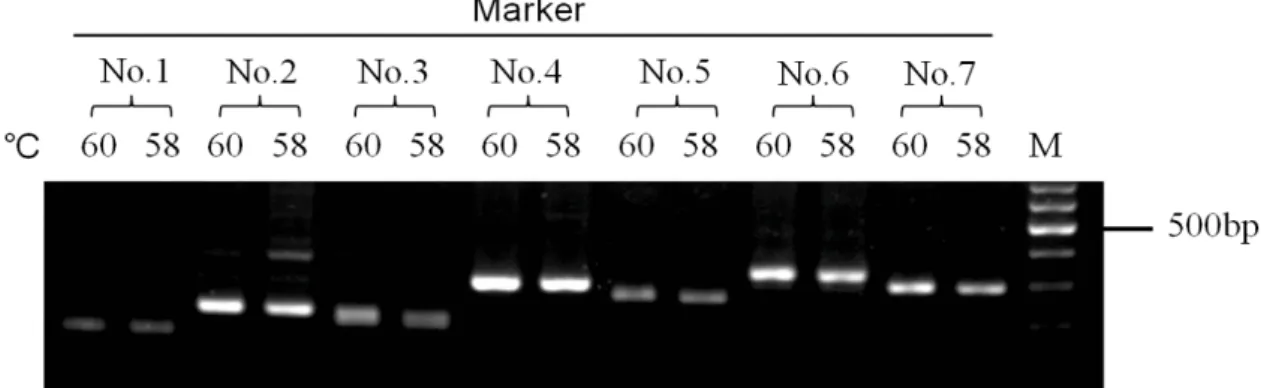
Seven microsatellite markers were recruited for the establishment of gene deletion study of PCDH10 (Figure 8A). Primers were designed to amplify the seven
26
microsatellite regions. PCR was then performed to check whether the primers can be used to amplify the desired products (Figure 8B). Since all the primers can be used for PCR, therefore, optimization of the PCR condition was performed (Figure 9). A panel of eight individual DNA from normal PBMCs was used to detect the polymorphism in each marker. Five out of eight markers (Marker No.1, 3, 4, 5 and 6) showed polymorphisms in primary screening (Figure 10). Two markers at each side flanking PCDH10 upstream and downstream regions were chosen for the study (Marker No.1
and 3, and Markers No.4 and 6, respectively). The markers were renamed as D4P1 for Marker No.1, D4P2 for Marker No.3, D4P3 for Marker No.4 and D4P4 for Marker No.6 (Figure 11). LOH study was carried out by fluorescence-based PCR using ABI Prism 377 DNA sequencer. Figure 12 showed the results analyzed by the software GeneScan. For the calculation of the LOH index, only heterozygous markers were considered as informative. Table 3 showed the summary of the number of informative samples and the LOH frequency for each marker. There were 211 cases in total, except for D4P4 marker which contained only 209 cases due to failure in the PCR amplification for two samples. The four markers displayed a heterozygosity rate ranging from 56.9% to 72.2%, while the LOH frequency ranged from 15.8% to 32.8%.
Among the four markers, marker D4P3, which is located nearest to the PCDH10 gene, displayed the highest frequency of LOH (32.8%).
27
Next we try to correlate the relationship between clinicopathological characteristics of patients and the incidence of LOH for each marker. Table 4 showed the statistical results. Markers D4P2 and D4P3 showed statistically significant correlation between incidence of LOH and distal metastasis of tumor (p=0.0383 and p=0.0440, respectively). For the other variables, there is no statistical significance (p>0.05) between the groups that are compared with LOH (+) and LOH (-) for each marker.
The four markers surrounding PCDH10 allow us to determine whether allelic deletion of PCDH10 occurred. Therefore, analysis of relationship between patient clinicopathological characteristics and the incidence of allelic deletion at PCDH10 was performed (Table 5). Only patients who obtained curable surgery before December 31st, 2008, were recruited for the study. Out of 211 pairs of CRC samples, ten were collected after the above date, so only 201 samples remained. Among these 201 samples, ten were identified as non-informative due to homozygosity in all the four markers studied, therefore, these ten cases were also excluded from the analyses. Out of the 191 cases, 57 cases were defined as having allelic deletion at the PCDH10 gene.
The correlation between distal metastasis of tumor and the incidence of LOH was statistically significant (p=0.0250). For the other variables, there is no statistical significance between the groups that are compared with PCDH10 allelic deletion (+) and allelic deletion (-).
28
Overall survival (OS) analysis was performed on 174 patients out of 191 because of five patients without follow-up after surgery and 12 patients died of postoperative complications. Disease-free survival (DFS) was performed on 118 patients because only patients with Dukes’ B or C were recruited (Table 6 and Figure 13). Allelic loss of PCDH10 gene predicted poor OS (p=0.0082). Among 54 patients with allelic deletion,
the OS was 55.6% and had a mean survival of 35 months, while the other 120 patients without allelic loss had OS of 72.5% and mean survival of 49 months. However, there was no statistically significant correlation between allelic loss and DFS among Dukes’
B and C patients (p=0.6135).
Previously our lab had identified the methylation status of the 5’ promoter region of PCDH10 of 74 pairs of CRC samples. Here, relationship between incidence of LOH
and promoter hypermethylation on patients’ survival was analyzed. Survival analysis was first independently performed depending on the incidence of LOH or methylation status of these 74 pairs. Among the 74 patients, two died of postoperative complications, three were without follow-up after surgery, and four had non-informative results in the LOH study; therefore, these nine cases were excluded from the survival analysis relating LOH. OS analysis was performed for the remaining 65 pairs of CRC samples depending on the incidence of LOH (Table 7 and Figure 14A). For DFS analysis, only 47 patients in Dukes’ B and C were recruited (Table 7
29
and Figure 14B). No significant correlations were found between incidence of LOH and OS or DFS survival (p=0.1273 and p=0.4680, respectively). For correlation between promoter methylation and survival, 69 patients were included for the study because two died of postoperative complications and three were without follow-up after surgery. For DFS analysis, only 51 patients with Dukes’ B and C were recruited.
Results as shown in Table 7 and Figure 15. No statistically significant correlations were found between promoter hypermethylation and OS or DFS survival (p=0.3212 and p=0.1354, respectively).
Combined influence of incidence of LOH and promoter methylation on OS was investigated. Out of the 74 patients, as in the above OS analysis related to the LOH status, only 65 patients were recruited for the analysis. Patients were divided further into four groups: neither with the presentation of LOH nor promoter hypermethylation of PCDH10, with presentation of LOH but no promoter hypermethylation, with no presentation of LOH but with promoter hypermethylation, and with presentation of both of LOH and promoter hypermethylation. Results as shown in Table 7 and Figure 16A. There was no statistically significant correlation between the incidence of LOH and promoter hypermethylation with OS (p=0.4655). Then, patients were divided into two groups: neither with the presentation of LOH nor promoter hypermethylation of PCDH10, and with presentation of LOH and/or promoter hypermethylation of
30
PCDH10. Results as shown in Table 7 and Figure 16B. There was also no statistically
significant correlation between the two groups and OS (p=0.7704).
4.2.2 Copy number variation of PCDH10
Ten normal PBMC samples were recruited to investigate the copy number variation of PCDH10 in normal individuals. Results were shown in Figure 17A. Normal PBMCs
revealed a copy number of two for PCDH10. In addition, five pairs of CRC samples defined as having allelic deletion at PCDH10 by LOH study, and five pairs of CRC samples without, were also selected to validate the copy number assay (Figure 17A).
Results showed that only one tumor sample (CRC19T, copy number=1) exhibited corresponding results as that in LOH study. The rest showed a copy number of two regardless of the incidence of LOH. Copy number assay was also performed in a panel of CRC cell lines, which included HCT116, HCT15, HT29, COLO205, SW480, SW620, KM12, Caco2, SW48 and LoVo (Figure 17B). Only Caco2 revealed a change in copy number (copy number=3), the others had a copy number of two. Previous study of PCDH10 V1 expression using RT-PCR revealed no expression of PCDH10 V1 in Caco2. In addition, RT-PCR showed that PCDH10 V1 expressed in HCT116.
Methylation study of PCDH10 in Caco2 and HCT116 by Methylation-specific PCR (MSP) showed that the CpG sites investigated were methylated. In addition,
31
bisulfite-sequencing PCR (BSP) study on these two cell lines also revealed high percentage of methylated CpG sites.
Since it was unable to observe a positive correlation between LOH study and copy number assay, samples with apparent LOH indexes were recruited for a final validation of the copy number assay. An apparent LOH index often reflects low contamination of tumors with normal cells. A total of 13 CRC cases were studied, only two samples (2CRC3T and 2CRC81T) showed a copy number of one, while the copy numbers of the remaining samples ranged from two to seven (Figure 17C and Table 8).
32
5. Discussion
In the present study, when PCDH10 V1 and PCDH10 V2 single stable clones were treated with camptothecin, increased drug susceptibility of HCT116 cells was observed.
Although camptothecin is no longer used in the chemotherapy for the treatment of CRC due to its low solubility and adverse drug effect, however, analogues or derivatives of camptothecin, such as Irinotecan, are used in routine treatment. These kinds of analogues act in the same mechanism as that of camptothecin.38 Based on the above results, re-expression of PCDH10 V1 or PCDH10 V2 exerted impacts on apoptosis after HCT116 treated with camptothecin. This is an interesting result because PCDH10 V2 possesses a much shorter cytoplasmic tail than PCDH10 V1. Cytoplasmic domain of PCDH10 is assumed to transduce signals to the cells. Previous results from our lab on the investigation of PCDH10 V2 RNA expression reported that the expression level of PCDH10 V2 was very low and it was often associated with strong PCDH10 V1 expression. Therefore, the results observed by over-expression of
PCDH10 V2 may not be compatible with in vivo situation. Future studies on apoptosis
will recruit chemotherapeutic drugs such as 5-Fluorouracil, that are used in present clinical regimens.39 40
Loss or gain of chromosomal regions is one of the most important mechanisms
33
underlying tumorigenesis, in which tumor cells may gain abnormal growth control.
Besides, loss or gain of chromosomal regions also leads to alteration in gene expression. It is postulated that tumor suppressor genes often exist in regions where losses occurred, and is often reflected as allelic imbalance or LOH at molecular level.41 According to the allelic deletion study of PCDH10 gene, heterozygosity rates for all the four markers, except for D4P4, were relatively low. D4P1 showed the lowest heterozygosity rate (56.9%) and its location is the farthest from PCDH10. Because of its low heterozygosity rate and low LOH frequency, we conclude that this marker may be dispensable and can be excluded when determining allelic deletion of PCDH10 gene. On the other hand, marker D4P3, which is located 388bp downstream of PCDH10, showed the highest LOH frequency (32.8%). This marker alone allows us to
determine the status of allelic deletion of PCDH10 for most cases. Statistical analysis of LOH status in each marker and in allelic deletion of PCDH10 with clinicopathological characteristics of patients showed that incidence of LOH in markers D4P2 and D4P3, and allelic deletion of PCDH10, were significantly associated with distal metastasis of CRC. This result corresponded to the results from the previous studies in our lab, in which invasion ability decreased when PCDH10 V1 was re-expressed in CRC cells. Since markers D4P2 and D4P3 were critical when determining the status of allelic deletion, so when LOH of these two markers was
34
observed, allelic deletion of PCDH10 was defined. The results showed that allelic deletion of PCDH10 were correlated to a poor OS of patients as estimated by the Kaplan-Meier method and compared by log-rank test, however, it was not found to be correlated to DFS in Duke’s B and C patients. Patients in Dukes’ D, who have the worst overall survival, may contribute bias when considering overall survival.
However, in our study of allelic deletion of PCDH10 and overall survival, the number of patients in Dukes’ D was similar to the remaining groups, which can eliminate the bias from this group of patients in survival analysis. In addition, when investigating the impacts of allelic deletion of PCDH10 on survival, change in survival rate and duration of patients with CRC should be considered because due to the advances in the treatment of CRC, five-year survival rate of patients will change over time. This change may also cause a bias in the current survival analysis. At present, approximately one-fourth of patients have metastatic CRC at diagnosis, with a five-year survival rate of less than 10%. Nevertheless, with the development of target therapy and combination of chemotherapy, patients with metastatic CRC have their median overall survival raised from six to eight months, up to 20 months over the past ten years.40 42 Though patients in our study were collected throughout ten years of time, however, even with the advances in the treatment of CRC, significant difference in overall survival can still be observed in patients with PCDH10 allelic deletion. In the
35
future, multi-variable analysis on survival will be carried out.
With the availability of PCDH10 methylation status of 74 paired CRC samples, OS analysis on combined influence of incidence of LOH and promoter hypermethylation was performed. The outcome was not statistically significant, however, this may be due to the small sample size. Moreover, patients with allelic deletion only displayed poorer OS than any other conditions, while patients without both of allelic deletion and promoter hypermethylation of PCDH10 gene showed relatively better OS. More samples should be included in future study.
PCDH10 is reported as a transmembrane protein, this prompts us to investigate whether PCDH10 is involved in the EMT pathway or not. Preliminary results using TGF-β to treat CRC cell line SW480 showed induction of cells to undergo EMT. In future study, PCDH10 V1 will be transiently transfected to SW480 and treated with TGF-β in order to study PCDH10 effect on EMT. Besides, EMT is reported to be one of the mechanism underlying tumor metastasis,43 and study from the above allelic deletion of PCDH10 also revealed association of PCDH10 with distal metastasis.
Therefore, study of involvement of PCDH10 in EMT was of great interest.
Taqman®Copy number assay was used to compare with the results of LOH study, in hope of finding a method to substitute the laborious process when carrying out the LOH study. Normal PBMCs showed a copy number of two of PCDH10 gene, and up
36
to date, no copy number variations for PCDH10 have been reported in the database of genomic variants.44 Nevertheless, we cannot observe a positive correlation between copy number assay and LOH study. Most cases with incidence of allelic deletion of PCDH10 showed no evidence of a reduced copy number, and by contrast, a few cases
showed an increased copy number. This may be a consequence of normal cell contamination using patients’ primary tumors41 because our samples were not obtained by laser capture, microdissection, or because of intratumor heterogeneity. In addition, only one specific region in exon four was investigated by this copy number assay, it may not be enough to detect the loss of other regions of PCDH10. Many other target sites have to be included in further comparison of LOH study to copy number loss.
Recently, frequent occurrence of uniparental disomy revealed by SNP arrays was reported in CRC and other cancers.45 46 Uniparental disomy is a genetic change in which one allele is lost while the remaining allele gains through duplication, resulting in LOH but no copy number change. Genomic alterations of this kind were also reported to impose significant changes on gene expression, suggesting that when gene dosage was unchanged due to uniparental disomy, the gene expression level may mainly remained unchanged. This has to be taken into consideration when performing LOH study and copy number assay.
Controversial roles of PCDH10 V2 were found in the proliferation assay and
37
apoptosis assay. Investigation of the effect of PCDH10 V2 on PCDH10 V1 will be carried out using transient overexpression in PCDH10 V1 single stable clones. If the results are conclusive, we will move on to stable clones selection using pEF6/V5-His-TOPO which contains different selection marker from PCDH10 V1. The PCDH10 V2 sequence was obtained from the original PCDH10
V2/pcDNA3.1/V5-His-TOPO through enzyme digestion and ligation to the pEF6 vector. Nevertheless, as mentioned previously, in vitro culture systems may not be able to reflect in vivo condition and PCDH10 was reported to exist cell-cell adhesion, therefore, interaction of the cellular matrix or extracellular environments may have trigger different influence of PCDH10 V2 on PCDH10 V1.
Other protocadherins were also reported to be candidate tumor suppressors in various carcinomas besides Protocadherin 10.47 Decreased expression of Protocadherin 1 (PCDH1) was shown to be a predictor for poorer overall survival in medulloblastoma patients.48 Loss of Protocadherin 8 (PCDH8), which is the human ortholog of Paraxial Protocadherin in frog, fish and mouse, through mutation and epigenetic silencing was also found in breast carcinomas.49 Protocadherin 20 (PCDH20) exhibited hypermethylation at the promoter region in non-small-cell lung cancer cell lines. Hypermethylation of PCDH20 was also shown to be associated with a poorer overall survival in patients.50 These further support that the non-classic
38
cadherins may play a role in tumor suppression aside from cell-cell adhesion.
In conclusion, apoptosis and gene deletion studies on PCDH10 support its role as a putative tumor suppressor gene in CRC. The sequence of which LOH or hypermethylation takes place, occurs at which tumor stage, or which mechanism play a more important role in CRC tumorigenesis remain to be answered.
39
Figures
Figure 1. Protein expression of newly selected PCDH10 variant 1 and PCDH10 variant 2 single stable clones.
Protein levels of PCDH10 V1 and PCDH10 V2 single stable clones were determined by Western blotting with anti-V5 antibody. β-actin was used as a protein loading control. Molecular weight of PCDH10 V1 and PCDH10 V2 is 116 kDa and 100 kDa, respectively according to NCBI. Mock represents pcDNA3.1/V5-His-TOPO. V1 and V2 stand for PCDH10 V1 and PCDH10 V2, respectively.
40
A.
B.
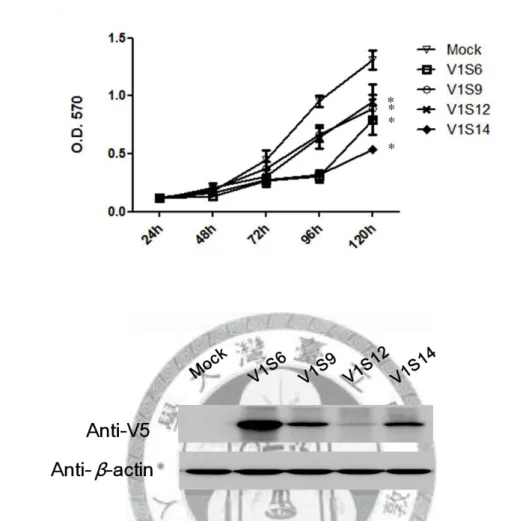
Figure 2. Cell proliferation of four new single stable clones of PCDH10 V1 using MTT assay (A) and the corresponding protein expression (B).
The proliferation rates of four PCDH10 V1 single stable clones were compared with a pcDNA3.1 only stable line (Mock) by MTT assay (A), and the corresponding protein expression was determined by Western blotting (B). Cell proliferation decreased significantly with PCDH10 V1 re-expression when compared to Mock (*p<0.01). V1 stands for PCDH10 V1.
41
A.
B.
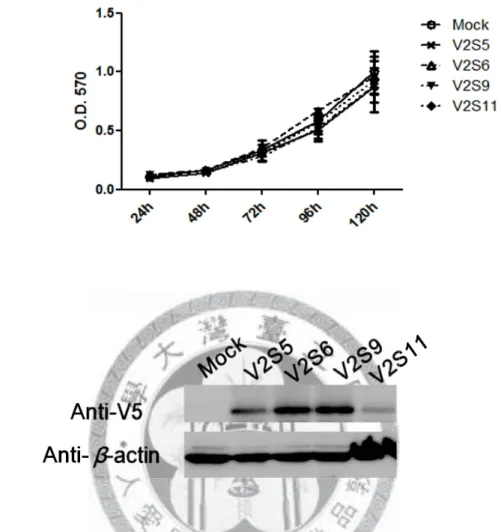
Figure 3. Cell proliferation of four new single stable clones of PCDH10 V2 using MTT assay (A) and the corresponding protein expression (B).
The proliferation rates of four PCDH10 V2 single stable clones were compared with a pcDNA3.1 only stable line (Mock) by MTT assay (A), and the corresponding protein expression was determined by Western blotting (B). Cell proliferation was similar to Mock with PCDH10 V2 re-expression. V2 stands for PCDH10 V2.
42
A
B.
C.
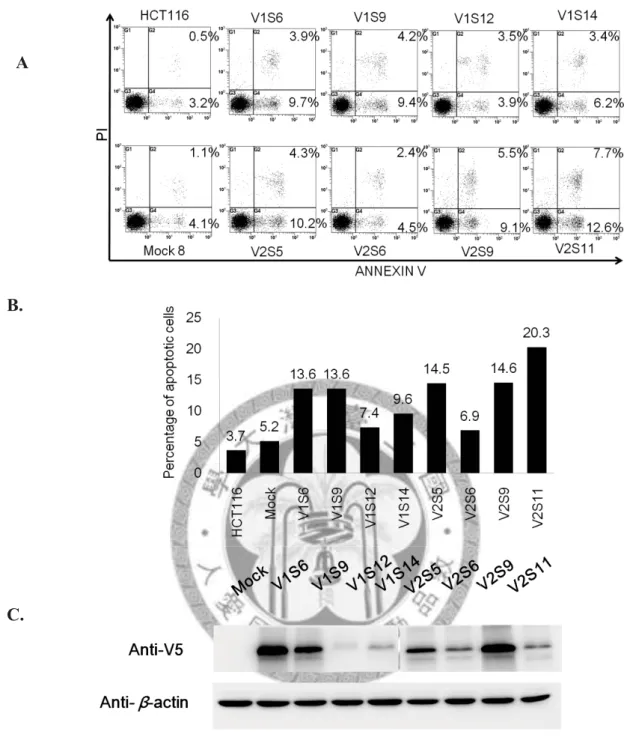
Figure 4. Re-expression of PCDH10 V1 and PCDH10 V2 induced spontaneous apoptosis of CRC cell line, HCT116.
The apoptosis percentages of PCDH10 V1 and PCDH10 V2 single stable clones were compared with a pcDNA3.1 only stable line (Mock) by Annexin V-PI staining (A), and quantitative results of flow cytometry were shown in (B). Corresponding protein expression was detected by Western blotting (C). V1 and V2 stands for PCDH10 V1 and PCDH10 V2, respectively. Apoptosis percentages increased with the re-expression of PCDH10 when compared to Mock. Mock showed similar apoptosis percentage to the parental cell line, HCT116.
43
A.
B.
C.
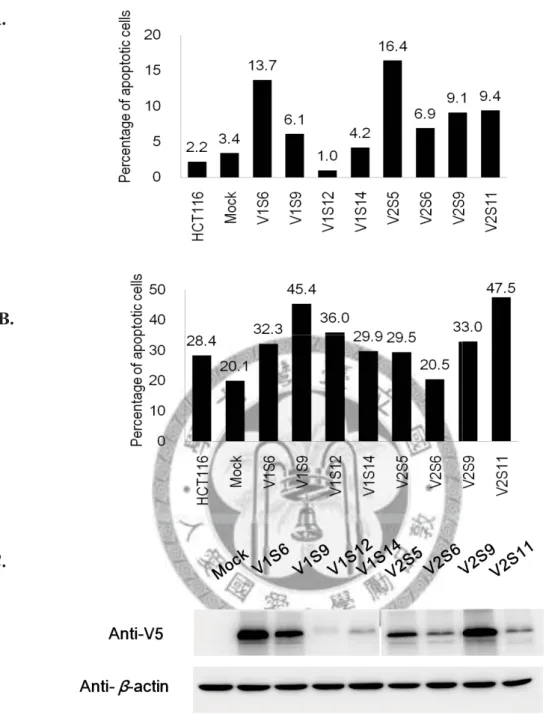
Figure 5. Camptothecin-induced apoptosis of PCDH10 V1 and PCDH10 V2 single stable clones.
DMSO was used to treat PCDH10 V1 and PCDH10 V2 single stable clones as control since camptothecin was dissolved in DMSO. Percentage of apoptotic cells of DMSO-treated group was shown in (A). Percentages of apoptotic cells in PCDH10 V1 and PCDH10 V2 single stable clones were shown after subtracting that of the DMSO-treated Mock, except for HCT116, which shows the percentage after subtracting its own DMSO-treated control (B). Corresponding protein expression was detected by Western blotting (C). Mock represents pcDNA3.1/V5-His-TOPO. V1 and V2 stands for PCDH10 V1 and PCDH10 V2, respectively.
44
Figure 6. Relative expression of E-cadherin in all PCDH10 single stable clones.
Western blot analysis shows protein expression of E-cadherin in various cell clones.
Mock represents pcDNA3.1/V5-His-TOPO. V1 and V2 stands for PCDH10 V1 and PCDH10 V2, respectively. Expression level of E-cadherin was normalized to that of β-actin, and the results were compared with Mock.
45
A.
B.
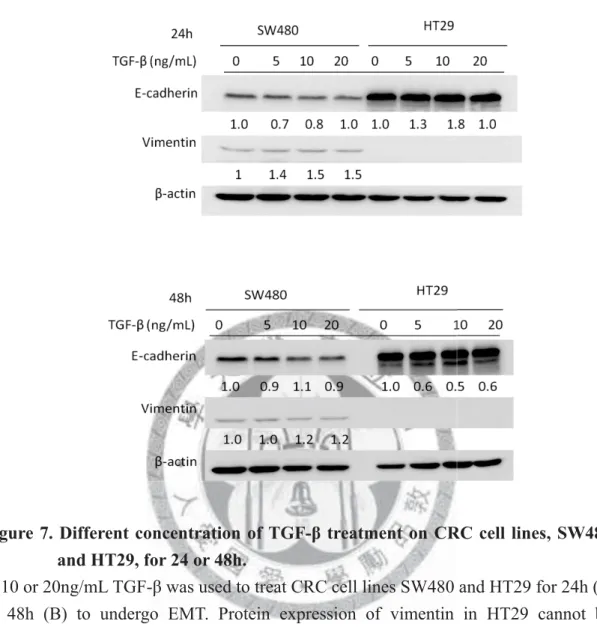
Figure 7. Different concentration of TGF-β treatment on CRC cell lines, SW480 and HT29, for 24 or 48h.
5, 10 or 20ng/mL TGF-β was used to treat CRC cell lines SW480 and HT29 for 24h (A) or 48h (B) to undergo EMT. Protein expression of vimentin in HT29 cannot be detected. All protein expression level was normalized to β-actin. Values are expressed as fold change compared with the untreated group.
46
A.
B.
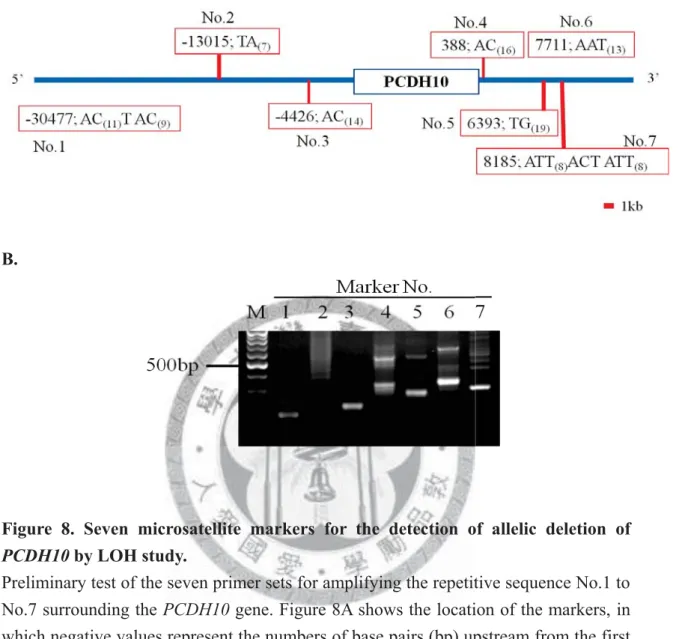
Figure 8. Seven microsatellite markers for the detection of allelic deletion of PCDH10 by LOH study.
Preliminary test of the seven primer sets for amplifying the repetitive sequence No.1 to No.7 surrounding the PCDH10 gene. Figure 8A shows the location of the markers, in which negative values represent the numbers of base pairs (bp) upstream from the first nucleotide of the PCDH10 gene, and positive values represent the numbers of bp downstream from the last nucleotide of the PCDH10 gene. Figure 8B shows the result of PCR visualized by gel electrophoresis. DNA was obtained from normal PBMCs. M:
100bp DNA size marker.