Accepted Manuscript
A scalable and accurate distributed traffic generator with Fourier transformed distribution over multiple commodity platforms
Ching-Hao Chang, Ying-Dar Lin, Yu-Kuen Lai, Yuan-Cheng Lai
PII: S1084-8045(19)30225-5
DOI: https://doi.org/10.1016/j.jnca.2019.07.001 Reference: YJNCA 2400
To appear in: Journal of Network and Computer Applications
Received Date: 15 November 2018 Revised Date: 1 May 2019 Accepted Date: 2 July 2019
Please cite this article as: Chang, C.-H., Lin, Y.-D., Lai, Y.-K., Lai, Y.-C., A scalable and accurate distributed traffic generator with Fourier transformed distribution over multiple commodity platforms, Journal of Network and Computer Applications (2019), doi: https://doi.org/10.1016/j.jnca.2019.07.001.
This is a PDF file of an unedited manuscript that has been accepted for publication. As a service to our customers we are providing this early version of the manuscript. The manuscript will undergo copyediting, typesetting, and review of the resulting proof before it is published in its final form. Please note that during the production process errors may be discovered which could affect the content, and all legal disclaimers that apply to the journal pertain.
A Scalable and Accurate Distributed Traffic Generator with Fourier Transformed Distribution over Multiple
Commodity Platforms
Ching-Hao Changa, Ying-Dar Lina, Yu-Kuen Laib, Yuan-Cheng Laic
aDepartment of Computer Science, National Chiao Tung University, Hsinchu County 300, Taiwan
bDepartment of Electrical Engineerin, Chung Yuan Christian University, Taoyuan City 320, Taiwan
cDepartment of Information Management, National Taiwan University of Science and Technology, Taipei County 106, Taiwan
Abstract
The rapid growth of high-speed computer networks poses a challenge in the design of testing and verification equipment. The hardware-based packet generators that are often used in the verification process are accurate but costly. Software-based packet generators, on the other hand, are relatively low-cost but have a limited performance with low accuracy. This paper pro- poses a Fourier-based profile decomposition and formulation methodology for a distributed packet generating system, featuring good horizontal scal- ability and high accuracy. Different from traditional software-based packet generators, this proposed system extracts the traffic components from a spe- cific traffic distribution applying Fourier transformation to generate traffic components. These traffic components are distributed to one or more worker nodes for packet generation, and thus achieving higher aggregated traffic rate in any given distribution. The system design is based on the Data Plane Development Kits (DPDK) framework to maximize the traffic generation performance. The accuracy and performance of the proposed system scale according to the number of worker nodes used. Currently, with multiple CPU cores and five workers, the proposed system can generate aggregated traffic of more than 40 Gbps in a Poisson distribution.
Keywords: Packet Generator, DPDK, Fourier Transformation, Commercial off-the-shelf Packet Generator.
1. Introduction
1
The latest trend in network bandwidth is shifting from 1 Gbps towards 10
2
Gbps in access networks and is rapidly moving toward 100 Gbps and beyond
3
in the core networks and data centers.
4
According to the timeline provided by the IEEE P802.3cd Task Force [3],
5
the standard of the optical and electrical signaling of 50 Gbps for both 200
6
Gbps and 400 Gbps [4] transmission rates is scheduled to be released by the
7
end of 2018. As the development of new testing tools often lags behind, there
8
is a strong demand for measurement tools and testing instruments that can
9
provide an accurate evaluation of the performance of network equipment [14]
10
while satisfying the growing demand of increasing bandwidths.
11
Packet generators, commonly used to generate synthetic traffic for per-
12
formance evaluation on network equipment, are implemented for both hard-
13
ware and software platforms. Hardware-based packet generators are built
14
with specific ASIC chips where precision and performance are optimized,
15
but it has a high price and limited flexibility. Commonly seen models of
16
hardware-based packet generators are manufactured by Spirent [7], IXIA [5]
17
and XENA [10]. Hardware-based packet generators are designed to generate
18
predefined packet streams and perform network device validation according
19
to RFC2544 [20]. Software-based packet generators, on the other hand, are
20
accessible and have a much lower cost. Most of the software-based packet
21
generators are open-source and can be readily downloaded, built and exe-
22
cuted on commodity personal computers and servers [36]. Nevertheless, the
23
accuracy of software-based packet generators is often not good enough, es-
24
pecially when conducting experiments that require the generation of a high
25
packet rate and achieving accurate traffic profiles [19].
26
1.1. Motivation
27
It is known that the performance of state-of-the-art software-based packet
28
generators has improved in various ways [32]. For example, Pktgen [28], a
29
packet generator that runs in the kernel-space instead of userspace to increase
30
the performance of packet generation. Pktgen-DPDK [2] developed by Win-
31
driver using the DPDK [9] framework to provide line-rate traffic generation
32
and receiving. MoonGen [22] is another packet generator based on the DPDK
33
that support fast per packet customization with LuaJIT [6]. A. Botta et al.
34
proposed the D-ITG [16], a distributed packet generator that generates and
35
receives packets from multiple nodes. However, there are no software-based
36
packet generators which are capable of generating traffic profiles with various
37
stochastic-processes in a distributed fashion.
38
This has motivated us to design a packet generator which is accurate,
39
scalable, and still highly cost-effective. Leveraging the techniques of dividing
40
the desired traffic profile into multiple traffic components in a frequency
41
domain, we propose a distributed packet generator system that is capable
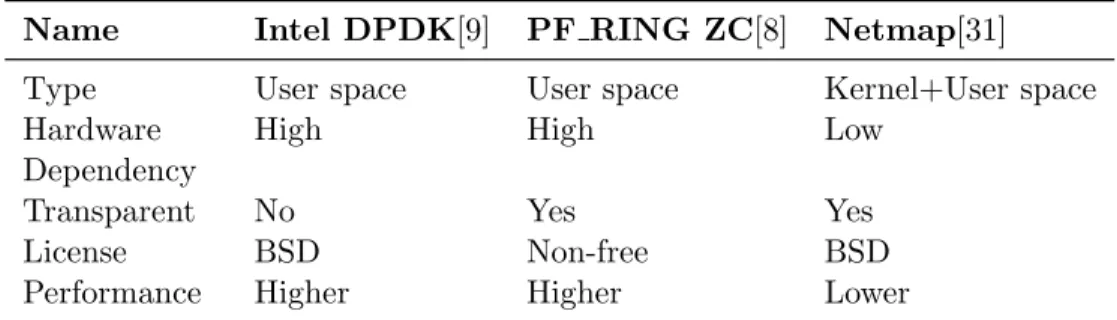
42
of synthesizing a specific traffic profile based on various stochastic processes.
43
By generating packets based on each traffic component in multiple nodes,
44
traffic can be aggregated with demanded traffic profiles.
45
This packet generating system consists of a controller node and one or
46
more worker nodes. The controller node processes the desired traffic pro-
47
file within a time domain. Based on the domain transformation techniques,
48
the major traffic components in the frequency domain are extracted to es-
49
tablish the packet generation logic, and is then sent to the worker nodes.
50
Based on the control messages sent from the controller, the worker nodes
51
accept the packet generation logic and generate packets in a synchronized
52
and distributed fashion. For each worker node, the DPDK packet process-
53
ing framework, commonly used in modern high-performance networking ser-
54
vices, is adopted to achieve the generation of highest packet rate precisely.
55
Therefore, the performance of the packet generator can be scaled horizon-
56
tally across a cluster of worker nodes, achieving very high throughput of
57
aggregating traffic.
58
The main contributions of this work are summarized as follows.
59
• A distributed packet generator system is developed based on a controller-
60
agent architecture.
61
• A novel Fourier-based profile decomposition and formulation methodol-
62
ogy consisting steps of domain transformation, traffic component selec-
63
tion and reconstruction is developed, so that specific traffic profiles can
64
be decomposed into multiple frequency components for remote worker
65
nodes.
66
• A control message protocol is proposed based on the publish-subscribe
67
model along with Precision Time Protocol (PTP) [30] for time syn-
68
chronization among workers and controller. The controller can control
69
remote worker nodes with accuracy in the sub-microsecond range to
70
generate specific profiles of networking traffic at a high aggregated rate.
71
• The system can be extended with multiple workers on multiple com-
72
modity PCs equipped with the off-the-shelf commodity network inter-
73
face cards (NICs).
74
The structure of this paper is as follows. Section 2 presents a general intro-
75
duction to current high-speed packet processing frameworks that are used to
76
speed up the throughput of packet generators. The common bottlenecks of
77
such software-based packet generators are discussed. Domain transformation
78
techniques and comparisons with other similar efforts are also discussed. Sec-
79
tion 3 outlines the problem addressed in this paper. Section 4 describes the
80
proposed design and implementations in terms of traffic feature extraction
81
and reconstruction processes; Section 5 discusses the overall system architec-
82
ture of the proposed design, and the testing setup and experiment results are
83
covered in section 6. Finally, in section 7, we summarize the work presented
84
and make suggestions regarding future work.
85
2. Background and Related Work
86
2.1. High-speed Packet Processing Frameworks
87
In spite of state-of-the-art CPU architecture with booming computing
88
power, achieving full line-rate packet processing performance continues to be
89
difficult to achieve [33, 34], without taking complex packet handling opera-
90
tions into consideration [23]. This is primarily due to the processing overhead
91
of network protocol stack implemented at the kernel of the operating system.
92
The design of the Linux network stack is optimized for an operating system
93
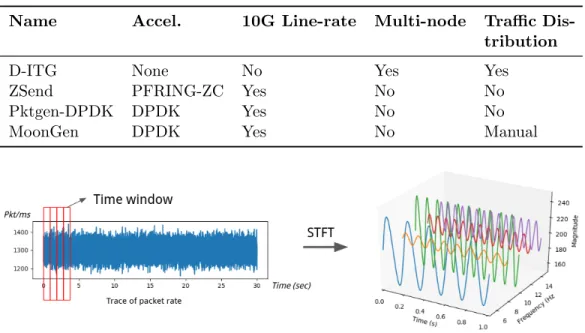
which is focusing on general purpose use, rather than applications such as
94
high-speed packet generation and capture. A majority of packet capture and
95
analysis applications were designed based on the Pcap library with the lim-
96
ited scalability due to the lack of multi-core support. Bonelli et al. [18] pro-
97
posed an extended version of the Pcap library that enables application-level
98
parallelism. Supports of packet fan-out to the original Pcap library along
99
with extended APIs were provided. The goal was to offload packet reception
100
workloads to multiple cores and increase the scalability of the system.
101
Modern high-speed packet processing frameworks, such as Netmap [31],
102
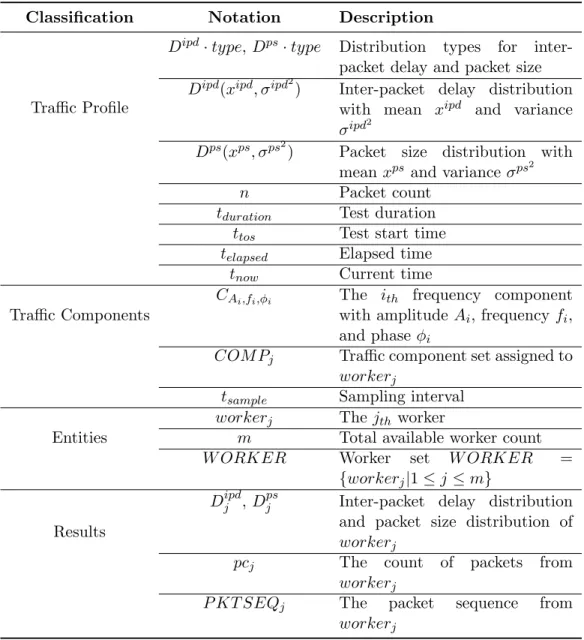
Intel DPDK [9], and PF RING Zero Copy [8] brought unprecedented per-
103
formance enhancement to packet processing by using a variety of techniques
104
such as zero-copy, kernel-bypass, polling and interrupt coalescing [32]. Wire-
105
CAP [35] presented two novel mechanisms of ring-buffer-pool and buddy-
106
group-based offloading featuring lossless zero-copy packet capture and deliv-
107
ery that exploit the multi-queue NICs and multi-core architecture. The con-
108
ventional way of receiving and transmitting data through network interfaces
109
involves not only DMA transactions between the NIC and kernel-space buffer,
110
but also memory-to-memory copying between kernel-space buffers and user-
111
space applications. High-speed packet processing frameworks eliminate such
112
inefficiencies by allocating a user-space memory pool sharing across NICs and
113
user-space applications. These frameworks provide a stripped-down alterna-
114
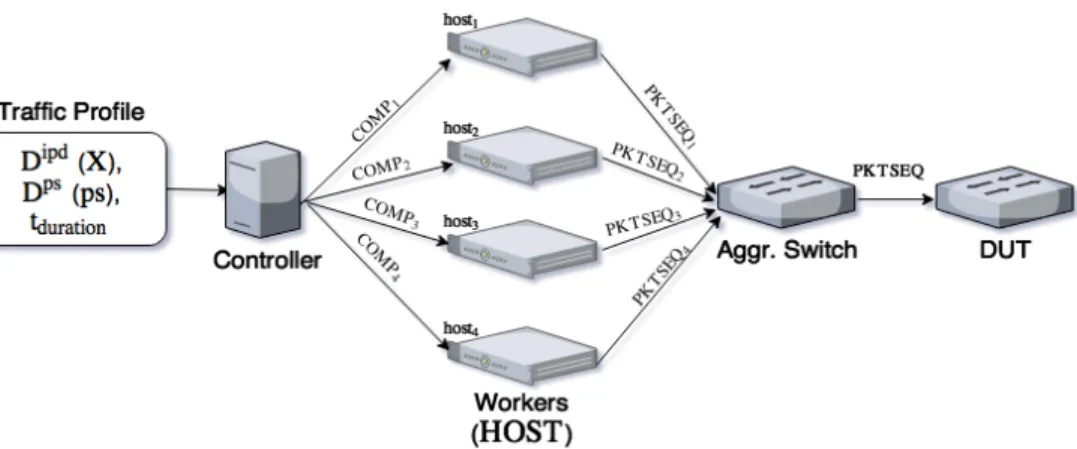
tive to the Linux network stack so that the user-space applications can en-
115
tirely bypass the kernel, avoid the overheads induced by a kernel networking
116
stack and manipulate a raw packet buffer directly. For example, both Intel
117
DPDK and PF RING Zero Copy utilize zero-copy and kernel-bypass tech-
118
niques. Their performance outperforms that of Netmap, allowing fast packet
119
generation of minimum-sized packets. We compare and summarize these
120
general aspects of the packet processing frameworks in Table 1. Still another
121
high-speed packet processing technology that is capable of line-rate packet
122
processing is NetFPGA[26]. NetFPGA is an open platform which employs
123
programmable hardware and implements the packet processing logic within
124
the field programmable gate array (FPGA), with the host implements only
125
the controlling software. G. Antichi et al. [15] proposed a system based on
126
NetFPGA that features high precision packet generation and timestamping.
127
Nevertheless, the cost of NetFPGA solution still far exceeds COTS solutions
128
and the flexibility is limited compared to a pure software-based solution.
129
Table 1: Comparison of packet processing frameworks. PF RING ZC is a proprietary software and requires license to be purchased.
Name Intel DPDK[9] PF RING ZC[8] Netmap[31]
Type User space User space Kernel+User space Hardware
Dependency
High High Low
Transparent No Yes Yes
License BSD Non-free BSD
Performance Higher Higher Lower
2.2. Software-based Packet Generators
130
Researchers and engineers widely adopt software-based packet genera-
131
tors [29, 36] for performing benchmarking and system validation. They can
132
generally be classified into three categories: application-level, flow-level, and
133
packet-level based on the types of traffic generated.
134
Application-level packet generators produce traffic of a specific appli-
135
cation protocol by emulating the protocol’s behavior. This type of traffic
136
generator is commonly utilized to generate the workload for performance
137
evaluation for various application servers. For instance, an HTTP work-
138
load generator behaves like multiple HTTP clients and generates a massive
139
amount of HTTP requests simultaneously to stress the loading of the web
140
server under test. Flow-level packet generators, on the other hand, produce
141
application-independent IP flows characterized by the number of packets,
142
bytes transferred and flow duration. Packet-level traffic generators are the
143
most common among the three types. This type of packet generators can pro-
144
duce packets not only with determined inter-packet delay (IP D) and packet
145
size (P S), but also for any given desired stochastic distribution.
146
Apart from lower cost, researchers generally opt for software-based packet
147
generators for their flexibility. Software-based packet generators are often
148
designed to support sophisticated customization of packets, which enable
149
users to test and verify new network protocols and services. Hardware-based
150
packet generators, by contrast, have difficulty generating arbitrary packets
151
and thus are not appropriate for this sort of application.
152
In order to evaluate the performance of targets under test and to provide
153
reproducible test results, packet generators are supposed to be accurate. Un-
154
fortunately, this is rarely the case for software-based packet generators. There
155
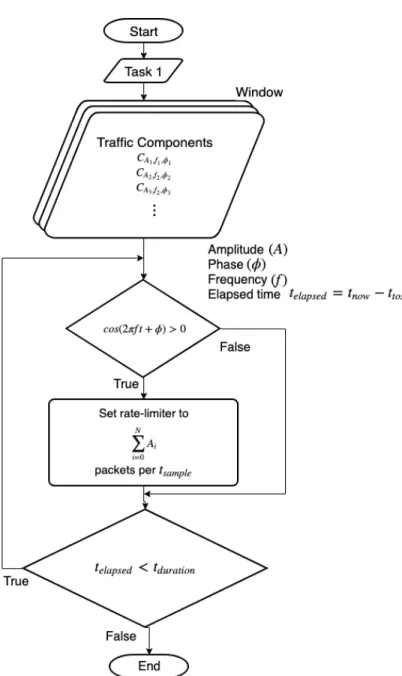
is still a trade-off between performance and flexibility, and that is probably
156
why the bare-metal hardware-based packet generators exist in the first place.
157
There are several software-based packet generators available with differ-
158
ent implementation approaches. D-ITG, developed by Avallone et al. [16],
159
features multi-node deployment. It provides central management utilities to
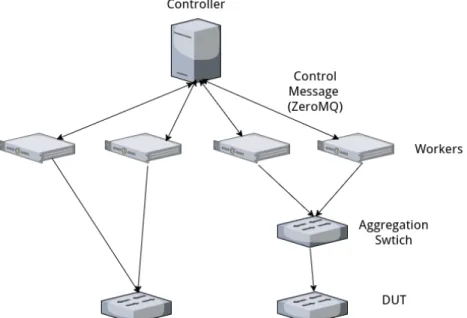
160
command the remote senders and receivers. It also supports various modes
161
of packet generation based on different stochastic processes for inter-packet
162
delay and packet size. Angrisani et al. [13] measure the inter-departure time
163
of packets generated by the packet generator D-ITG with constant bitrate
164
traffic of various inter-departure times (IDTs) configured. The experiment re-
165
sults show that the variability of the packet generation is mainly contributed
166
by non-deterministic OS system calls instead of memory access time and
167
computational time as they are almost deterministic. Besides, the experi-
168
mental result shows that the variation of IDT becomes much higher when
169
the packet rate exceeds 1000 packets per second (PPS). Pktgen-DPDK, de-
170
veloped by Keith Wiles et al. [2], is designed with Intel DPDK framework. It
171
features 10G line-rate capability on COTS hardware. MoonGen, developed
172
by Emmerich, Paul et al. [22], features LuaJIT [6] for efficient per-packet
173
customization. It provides a novel way of generating accurate inter-packet
174
delay by adding deliberately corrupted packets into packet batch.
175
Among the works listed above, Pktgen-DPDK only supports constant bit-
176
rate packet generation. MoonGen, on the other hand, supports per-packet
177
customization and thus can be used to generate customized traffic profile.
178
MoonGen does not provide a mechanism for central management, and there-
179
fore lacks the ability to generate packets in a distributed manner. D-ITG
180
provides support for distributed packet generation. However, it supports
181
only the generation of per-flow traffic profiles. The comparisons of these
182
various proposals are shown in Table 2.
183
The state-of-the-art software-based packet generator performs well with
184
the advance of computer architecture and the support of various packet pro-
185
cessing acceleration frameworks with traffic under 10 Gbps. Nevertheless,
186
state-of-the-art software-based packet generators put focus on extracting the
187
maximum performance from a single COTS server and therefore the per-
188
formance is capped by the server’s physical resource. This has immensely
189
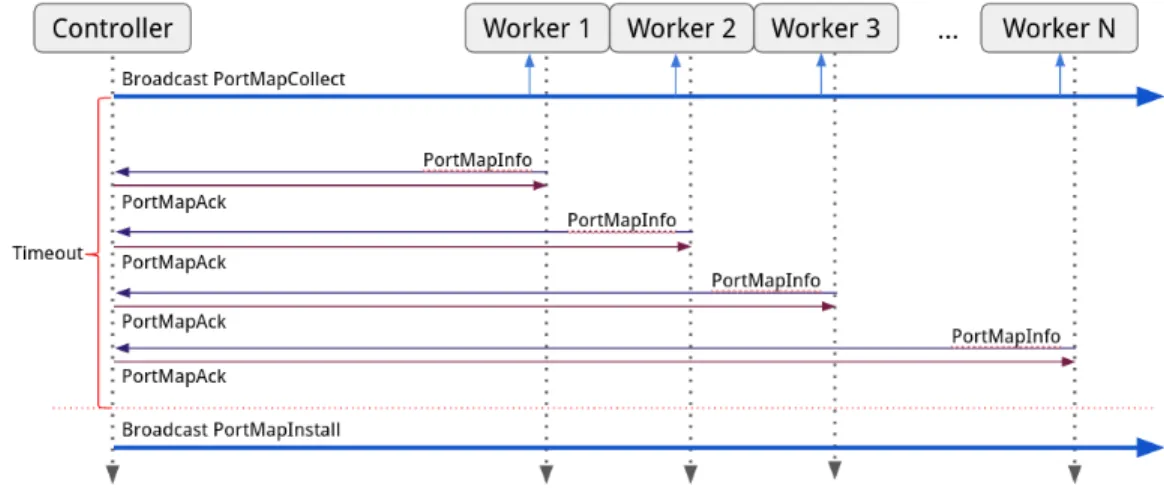
limited the traffic generator’s scalability to keep up with the performance
190
demand when the network traffic and device performance reach the scale
191
of 40 Gbps and beyond, especially when non-uniform traffic profiles are en-
192
forced. Researchers and testers have no choice but to fall back to costly
193
hardware-based traffic generators. In our work, we explore the problem from
194
a different angle by viewing the clustered workers as a whole and develop
195
a way to scale out software-based traffic generator that satisfy the need for
196
benchmarking advanced network devices. The major advantage of our work
197
compared to the state-of-the-art is the ability to effectively decompose a given
198
traffic profile and reconstruct the traffic in a distributed manner, which al-
199
lows us to effectively scale out and increase the maximum capacity of the
200
system.
201
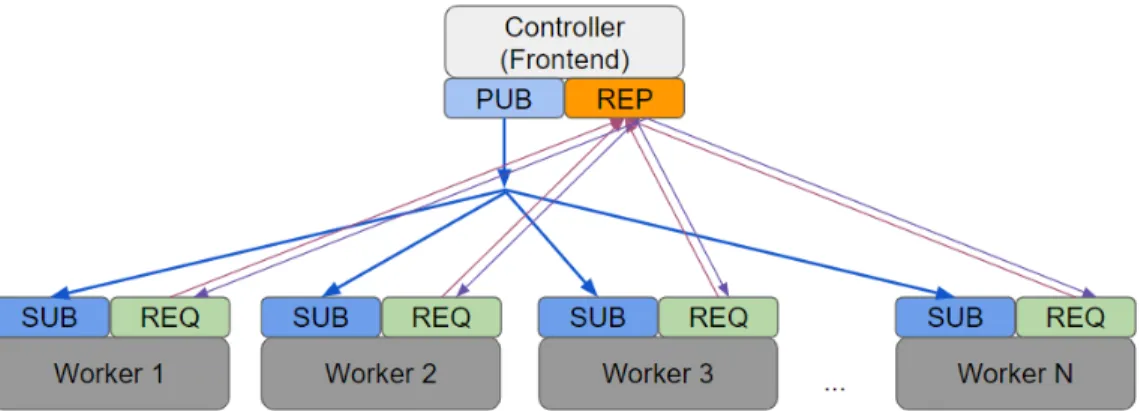
2.3. Short-time Fourier Transformation
202
The technique of domain transformation is widely used for anomaly de-
203
tection, network traffic analysis and measurement [17, 25] in the frequency
204
domain. A short-time Fourier transform (STFT) [27] is a variation of Fourier
205
transformation that is used to determine the magnitude, frequency and phase
206
Table 2: Comparison of Software-based Packet Generators
Name Accel. 10G Line-rate Multi-node Traffic Dis- tribution
D-ITG None No Yes Yes
ZSend PFRING-ZC Yes No No
Pktgen-DPDK DPDK Yes No No
MoonGen DPDK Yes No Manual
Figure 1: Short-time Fourier transform
of sinusoidal components in a short segment of a signal. This is done by slic-
207
ing a long, time-based signal into multiple shorter segments with equal time
208
intervals called windows and then to compute the Fourier transform of each
209
window. The result is a frequency spectrum of each segment.
210
Short-time Fourier transform is applied in our work (as shown in Figure
211
1), to provide a generic methodology for analyzing the desired traffic distribu-
212
tion and efficiently decompose the components from the traffic. The reason
213
why we select short-time Fourier transform over general Fourier transform is
214
that, short-time Fourier transform provides temporal resolution while gen-
215
eral Fourier transform provides purely frequency resolution. While there are
216
other time-frequency domain analysis techniques such as wavelet transform,
217
short-time Fourier transformation features simplicity of implementation and
218
its performance can scale out effectively in multiple-worker scenario, and thus
219
is suitable for real-time traffic reconstruction in our system.
220
3. Problem Statement
221
3.1. Notations
222
As shown in Table 3, the distribution types of inter-packet delay and
223
packet size are denoted by Dipd · type and Dps · type. We further denote
224
the distribution of inter-packet delay and packet size by Dipd(xipd, σipd2) and
225
Dps(xps, σps2) with xipd, xps, σipd22 and σps2 representing the mean and vari-
226
ance of inter-packet delay and packet size. The requested packet count and
227
precision is denoted by n and p while the total available worker count is
228
denoted by m. We denote the frequency components of the traffic profile
229
by CA,f,φ, with A being the amplitude, f being the frequency and φ being
230
the phase. Given the workerj in set of HOST , Dipdj , Dpsj and pcj denote
231
the distribution of inter-packet delay, size and packet count received from
232
workerj.
233
3.2. Problem Description
234
Given the distribution type of inter-packet delay Dipd · type and packet
235
size Dps· type, distribution of inter-packet delay Dipd(xipd, σipd2) and packet
236
size Dps(xps, σps2), packet count n and total available worker count m, the
237
system can derive the frequency components of traffic profile: CA,f,φ of each
238
workers workerj such that the summation of the received inter-packet delay
239
distribution:
m
P
j=1
Dipdj , summation of packet size distribution
m
P
j=1
Dpsj and total
240
packet count
m
P
j=1
pcj approximate to Dipd(xipd, σipd2), Dps(xps, σps2) and n
241
respectively.
242
The object of the work is to generate a traffic profile with multi-gigabit
243
traffic bandwidth. The design of the system is based on commodity hardware
244
such as servers or PCs with off-the-shelf network interface cards of 10 Gbps
245
and 40 Gbps.
246
As an example, shown in Figure 2, when given a traffic profile with its Dipd
247
as a Poisson distribution with mean and variance X, its Dps being constant
248
ps, the demanded test duration tduration and available worker W ORKER,
249
the system divides the traffic into multiple components and assign each of
250
them to workerj, such that the distribution of P KT SEQj: Djipd sums up to
251
the original distribution of requested traffic profile.
252
Table 3: Table of notations.
Classification Notation Description
Traffic Profile
Dipd· type, Dps· type Distribution types for inter- packet delay and packet size Dipd(xipd, σipd2) Inter-packet delay distribution
with mean xipd and variance σipd2
Dps(xps, σps2) Packet size distribution with mean xps and variance σps2
n Packet count
tduration Test duration ttos Test start time
telapsed Elapsed time
tnow Current time Traffic Components
CAi,fi,φi The ith frequency component with amplitude Ai, frequency fi, and phase φi
COM Pj Traffic component set assigned to workerj
tsample Sampling interval Entities
workerj The jth worker
m Total available worker count
W ORKER Worker set W ORKER =
{workerj|1 ≤ j ≤ m}
Results
Djipd, Djps Inter-packet delay distribution and packet size distribution of workerj
pcj The count of packets from workerj
P KT SEQj The packet sequence from workerj
Figure 2: Packet generation example.
4. Fourier-based Profile Decomposition and Formulation
253
4.1. Overview
254
The flowchart of the proposed system is shown in Figure 3. It can be
255
roughly divided into three main stages: domain transformation, traffic com-
256
ponent selection, and traffic reconstruction.
257
The procedure for packet generation starts with the traffic profile gathered
258
from the user input. This profile consists of the distribution type of the inter-
259
frame gap, its duration and the stochastic properties, such as the mean and
260
variance of the distribution. The system first carries out traffic synthesis
261
based on the given traffic profile and produces a simulated traffic trace. By
262
sampling the simulated traffic trace, the system can extract the packet rate
263
changes of the actual traffic profile. Domain transformation on the packet
264
rate changes is then carried out to obtain the frequency components of the
265
traffic.
266
At the second stage, as shown in Figure 3, the most significant frequency
267
components are selected by applying a low-pass filter to the resulting fre-
268
quency components. Finally, at the third stage, the system reconstructs the
269
traffic traces by utilizing inverse domain transformation on the remaining fre-
270
quency components. The traces of the stochastic properties of the generated
271
packet sequences then resemble the original traffic profile.
272
4.2. Domain Transformation on Traffic Profile
273
One of the core contributions of this work is the generation of distributed
274
traffic traces with a specific profile, allowing the total bandwidth of aggre-
275
Figure 3: System flowchart.
gated traffic to scale up to multiple gigabits per second. The key to the
276
distributed generation of a traffic profile is the decomposition of the traf-
277
fic into multiple frequency components. This is achieved with the following
278
domain transformation techniques.
279
Before the domain transformation process, the desired traffic profile from
280
the user by the distribution type of inter-packet delay (Dipd·type) is gathered
281
along with its corresponding stochastic properties of mean (xipd) and variance
282
(σipd2). These properties are then used to synthesize the desired traffic traces,
283
or more specifically, the packet rate changes of the given traffic profile.
284
Notice that, in addition to the inter-packet delay distribution, the sys-
285
tem also takes the packet size distribution (Dps(xps, σps2)) from the user.
286
However, unlike inter-packet delay, where its accurate reconstruction is a
287
challenging task, packet size reconstruction is rather trivial and accurate.
288
The packet size distribution is thus not involved in the process of domain
289
transformation.
290
The synthesized traffic trace is further sampled with a fixed time interval
291
tsample. The choice of sampling time tsample affects the resolution of the
292
generated traffic. Choosing a long sampling time results in aliasing of the
293
traffic profile, while choosing a smaller one results in a significant number of
294
data sets but higher accuracy. In this work, the default sampling time is one
295
millisecond.
296
A Discrete Fourier Transform (DFT) process is then applied to analyze
297
the simulated trace and extract the frequency components. DFT is defined
298
as
299
Ak =
n−1
X
m=0
ame−2πimkn , k = 0, · · · , n − 1. (1)
We specifically apply a Fast Fourier Transform (FFT), a computational-
300
friendly variation of DFT, to speed up the process of domain transformation.
301
Since the sampling outputs, that is, the packet rate changes, are entirely real,
302
the component of a specific frequency is just the complex conjugate of the
303
negative counterpart, which means there is no information in the negative
304
frequency component that is not already available from the positive frequency
305
components. We then use this symmetry and compute only the positive
306
frequency components. The resulting frequency components are shown as
307
CAi,fi,φi, i = 0, · · · ,n
2 − 1, (2)
where fn
2−1 is the Nyquist Frequency.
308
4.3. Traffic Component Selection
309
With n sampling points, we can derive n2 frequency components with fre-
310
quency up to the Nyquist frequency. As a result, with longer duration of
311
generated traffic and higher sampling frequency, the amount of frequency
312
components increases correspondingly. The processing overhead becomes
313
larger with an increasing number of sample points n. More frequency com-
314
ponents take up more computing power and network resources for recon-
315
struction. In order to decrease the amount of frequency components, the
316
system further differentiates the impact of the lower and higher frequency
317
components. We discovered that lower frequency components determine an
318
approximation of the traffic profile, while higher frequency components con-
319
tribute to the preciseness of the counterpart. Thus, it is feasible to suppress
320
some of the frequency components by removing higher frequency parts, since
321
exact precision may not always be required in practice.
322
4.4. Traffic Reconstruction
323
The traffic reconstruction process is the inverse of domain transformation
324
as shown in the first stage. In this phase, the system inversely transform the
325
frequency components back to a time domain traffic trace. This is accom-
326
plished by applying an inverse FFT, which is defined as
327
am = 1 n
n−1
X
k=0
Ake2πimkn , m = 0, 1, · · · , n − 1. (3)
The traffic reconstruction process is carried out in a distributed manner.
328
Before the start of the generation process, the frequency components are
329
distributed evenly to the available packet generation nodes. The frequency
330
components are encapsulated in a task, and the duration of the generation
331
process (tduration) and the start time (ttos) are also stored in this task. The
332
start time is chosen to be long enough to propagate each task to each worker.
333
At the starting time, each worker calculates the number of packets to send
334
per tsample and to put it into the sending bucket. The packet count is taken
335
from the summation of the amplitude of each frequency component. The
336
traffic generation flowchart of each task is shown in Figure 4. Note that
337
the reconstructions are deliberately converted to approximate the property
338
of sinusoidal signals. By offsetting each frequency components (except the
339
zero frequency component), the packet rate is distributed within the range
340
of [0, Ai]. This allows us to simplify the generation process and also bet-
341
ter utilize the hardware rate control capability of network interfaces when
342
supported.
343
Figure 4: Flowchart of traffic reconstruction.
5. System Implementation
344
5.1. System Architecture
345
The system’s architecture is shown in Figure 5 and consists of a controller
346
and one or more workers. Each worker must be equipped with at least
347
two network interfaces, with one being the management port and the other
348
being the actual packet generating ports. The workers initialize a control
349
session with the controller through the management port during setup and
350
perform the packet generation task under controller’s command. The packet
351
generating ports of the workers are bound to the userspace I/O (UIO) driver
352
for high-speed packet processing with DPDK beforehand and can be directly
353
attached to the device under test (DUT). The packet generating ports can
354
alternatively be attached to an aggregate switch for traffic merging before
355
the DUT.
356
Figure 5: The proposed system architecture which consists of a controller node and four worker nodes.
5.2. Single-worker Traffic Generation
357
The system can be operated for a single-worker traffic generation scenario.
358
In this mode, all of the frequency components are processed by a single worker
359
node with limited resources. Depending on the number of packet generating
360
ports available to the worker, each packet generating port is in charge of
361
one or more frequency components. Currently, most of the modern network
362
adapters are embraced with multi-queue configuration where more than one
363
queue can be enabled on both transmission and receive side. This allows us
364
to generate packets with multiple CPU cores at one port. Therefore, for a
365
worker with limited per-core computation power, multiple CPU cores can be
366
utilized simultaneously to increase traffic throughput. Some of the 10Gbps
367
network adapters, such as Intel 82599 and Intel X540, can even support
368
more advanced features such as hardware-based per queue rate scheduling.
369
Once this feature is enabled, the system can dispatch frequency components
370
into various transmit queues with each queue set to a fixed rate of Ai. By
371
periodically refilling the sending bucket, the system is able to craft multiple
372
traffic streams with an accurate packet rate.
373
5.3. Multi-worker Traffic Generation
374
A multi-worker traffic generation mode, similar to that of a single-worker
375
mode, consists of two more processes of time synchronization and port map-
376
ping. The packet generator relies on a time stamp counter (TSC)1 which
377
is built inside the CPU to determine when to send a packet and how many
378
to send. In the early generation of multi-core CPU, the TSC may be used
379
across different cores, and may even be used with SpeedStep2 or TurboBoost3
380
enabled. Modern CPU employs invariant-TSC4, where the TSCs are synchro-
381
nized across all cores and does not vary with SpeedStep or TurboBoost. Thus,
382
for single-worker traffic generation, time synchronization would not pose a
383
problem. This is, however, not true for multi-worker traffic generation which
384
incorporates multiple workers with varied TSCs.
385
The way that the system deals with the time synchronization problem
386
is to introduce a time correction factor tof f set into the generation process so
387
that the elapsed time t becomes tnow − ttos+ tof f set. The time difference,
388
tof f set between a worker and the controller, is measured based on the IEEE
389
1588 PTP protocol [30] with the support of hardware timestamping in the
390
network adapter.
391
1The Time Stamp Counter (TSC) is a 64-bit register present on all x86 processors since the Pentium. It counts the number of cycles since reset. It can be read via the instruction RDTSC
2SpeedStep is a technology built into some Intel microprocessors that allow the clock speed of the processor to be dynamically changed by software
3Intel Turbo Boost is a technology implemented by Intel in certain versions of its processors that enables the processor to run above its base operating frequency via dynamic control of the processor’s clock rate
4The invariant TSC will run at a constant rate in all ACPI P-, C-, and T-states. It is first introduced on Nehalem Intel processor
Some of the modern network interface cards such as Intel 82574 [11] and
392
Intel 82580 [12] provides a hardware timestamping feature for PTP packets.
393
This can significantly improve the time synchronization to sub-microsecond
394
accuracy.
395
A PTP time synchronization process starts with a grandmaster that syn-
396
chronizes its clock to the connected slave and boundary clocks. In principle,
397
hardware timestamping features on the network card is used to measure the
398
accurate jitters of the network. There is a hardware clock (PHC) within each
399
network card. All slave NIC interfaces receive PTP packets from the grand-
400
master and synchronize its hardware clock to that of the grandmaster. An
401
additional process is in charge of transforming the PHC clock to the system
402
clock (CLOCK REALTIME).
403
Figure 6 shows the port id synchronization process. To globally syn-
404
chronize the port id information among all workers with the controller, the
405
controller has to collect port id mapping from all of the worker nodes and
406
remap them accordingly. Finally, the controller publishes the global port id
407
map to each worker.
408
Figure 6: Port ID synchronization process.
5.4. Control Message Design
409
The control messages play an important role in communication between
410
controller and workers. Therefore, the control message protocol is designed
411
with portability and scalability in mind so that worker nodes can expand from
412
current x86-based server to a variety of heterogeneous computing platforms.
413
The design uses ZeroMQ[24] and Protobuf[1] together. Both of these
414
have ample support for various languages, and that makes them portable
415
on many platforms. Using ZeroMQ helps us simplify the connection setup
416
and management process, and avoids rebuilding the wheel by utilizing com-
417
monly used connection patterns. Protobuf, though adds an overhead to the
418
protocol, helps ensure the portability of the protocol layer by its efficient
419
and flexible serialization feature. The worker nodes and controller commu-
420
nicate in an out-of-band manner, in which the control messages are sent and
421
received via management ports to avoid mixing with testing traffic. The
422
control messages are mostly sent and received at the setup phase with only
423
a few periodical statistic update messages during the packet generation pro-
424
cess with an average traffic below 100 kbps and has little impact on the
425
performance of the system. On top of that, the control message handler is
426
isolated from the worker threads and is pinned to the master core to prevent
427
interference of any kind to the packet generation process.
428
The control message architecture of our work is shown in Figure 7. Each
429
worker listens to two types of socket, the subscriber socket and the request
430
socket, while the controller listens to the publisher socket and the reply
431
socket. The control messages are classified into the broadcast message and
432
unicast message. The broadcast messages are unidirectional, and are initiated
433
by the controller. The unicast messages, on the other hand, are bidirectional
434
and initiated by the worker.
435
Figure 7: The proposed control message architecture. Each worker listens to two types of socket, the subscriber socket and the request socket, and the controller listens to the publisher socket and the reply socket.
6. Experiments and Testing Results
436
The experiments conducted to evaluate the performance of the proposed
437
system are grouped into tests of scalability and accuracy. The purpose of
438
a scalability test is to evaluate the system such that the maximum traffic
439
rate can be achieved with multiple worker nodes. In an accuracy test, the
440
similarity of traffic rate distribution between the generated and desired traffic
441
profile is verified in various setups.
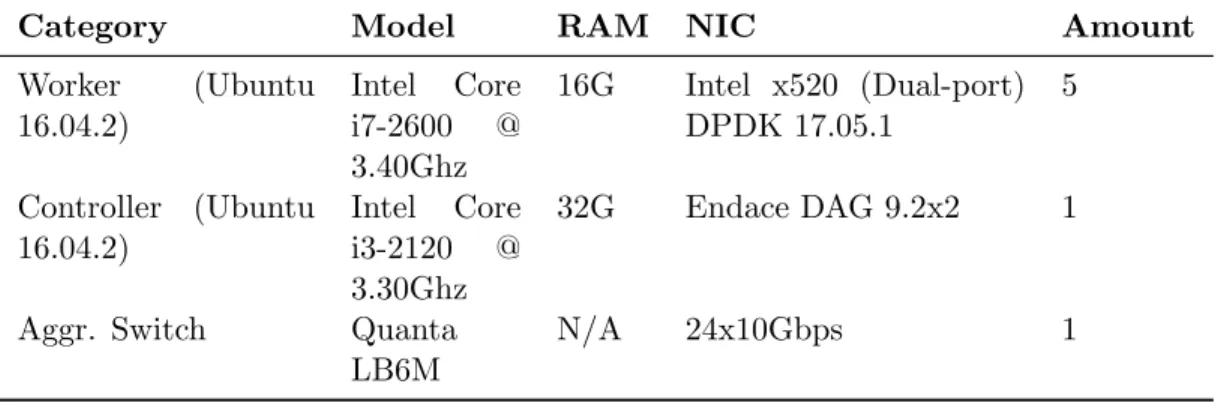
442
Table 4: List of equipment for the experiments conducted in the system performance evaluation.
Category Model RAM NIC Amount
Worker (Ubuntu 16.04.2)
Intel Core i7-2600 @ 3.40Ghz
16G Intel x520 (Dual-port) DPDK 17.05.1
5
Controller (Ubuntu 16.04.2)
Intel Core i3-2120 @ 3.30Ghz
32G Endace DAG 9.2x2 1
Aggr. Switch Quanta LB6M
N/A 24x10Gbps 1
6.1. Experiment Setup
443
The equipment and the configuration of the software environment used in
444
the experiments are listed in Table 4. Five Intel Core i7-2600 PCs were used
445
as the worker nodes for packet generation task. Each worker was equipped
446
with 16GB of RAM and a dual-port Intel X520 network interface. Note
447
that the hyper-threading feature of the CPU was deliberately disabled as
448
suggested in DPDK documentation. The hyper-threading mechanism con-
449
tributed additional overhead to the system and decreased the system perfor-
450
mance. An Intel Core i3-2120 server equipped with an Endace DAG 9.2X2
451
dual ports DAG card was used for the controller. The controller was in charge
452
of worker orchestration and packet reception. The Endace DAG 9.2X2 was
453
equipped with a 2GB packet capture buffer. It was also capable of recording
454
packets with hardware timestamping at nanosecond precision and performing
455
line-rate packet capture with zero packet loss.
456
In the scalability test, the goal was to measure the maximum achievable
457
throughput under different packet sizes. The test was conducted based on the
458
scenario of single-worker and multiple-worker with hardware rate-limiting on
459
and off. For the scalability test, the network topology was arranged as shown
460
in Figure 5. In this test, multiple CPU cores were used to generate traffic
461
as fast as possible by using a dual-port Intel X520 NIC card. One transmit
462
queue was enabled for each port and is designated to one distinct CPU core.
463
Table 5: List of enforced traffic profile in the accuracy tests.
Inter- packet delay dis- tribution
Bitrate Packet size distribution
Packet size Test duration
1.31 Gbps 5 sec
Poisson 6.72 Gbps Constant 64 bytes 3 sec
9.19 Gbps 3 sec
In the accuracy test, the goal was to figure out the ability of the sys-
464
tem to replicate the desired traffic profile. The experiments were conducted
465
with single computing core at various combinations of single-worker, multi-
466
worker, a different number of transmit queues, software-based rate limiting,
467
and hardware-based rate limiting. The enforced traffic profiles are listed in
468
Table 5.
469
6.2. Experiment Results
470
6.2.1. Scalability Test
471
In order to test the performance of the traffic generator, a constant packet
472
rate traffic was generated with packet sizes of 64 bytes, 512 bytes, and 1518
473
bytes. The theoretical rate boundary each packet size is calculated by:
474
M aximum Rate = 10 Gbps
8 × (P acket size + F rame overhead) (4) with the frame overhead being 20 bytes (12 bytes inter-frame gap and 8 bytes
475
preamble). The calculated rate boundaries of each sizes are 14.88 Mpps, 2.35
476
Mpps, and 0.81 Mpps. The system was easily able to achieve the aggregated
477
throughput of 20 Gbps with the 99.99% line-rate in each CPU core. The
478
experiment was further extended based on two worker nodes and the system
479
was able to generate 40 Gbps traffic as anticipated. The test results are
480
Figure 8: Scalability test results for multi-worker multi-core setups. Two worker nodes are used to generate 40Gbps traffic.
shown in Figure 8. A token-bucket based rate limiter was provided as a
481
fallback position when hardware-based rate limiting was not supported. A
482
Poisson distribution traffic with various workloads from 1.31 Gbps to 9.19
483
Gbps was enforced. We also evaluated test scenarios with different numbers
484
of transmit queues, and each transmit queue was designated to one distinct
485
CPU core.
486
6.2.2. Accuracy Test for Single-Worker
487
We first enforced the 1.31 Gbps Poisson traffic with a single worker, with
488
software-based rate limiting under various numbers of transmit queues. The
489
experiment result is shown in Figure 9. The more number of transmit queues
490
used, the lower the mean squared error reached. The mean squared error
491
(MSE) decreases as the number of transmit queues increases. The MSE of
492
generated traffic with three transmit queues decreases by 72% compared to
493
that of one transmit queue.
494
The tests were further conducted by enabling the hardware-based rate
495
limiting feature. Compared to that of software-based rate limiting, as shown
496
Figure 9: Histogram of packet rate with the feature of software-based rate limiting. A Poisson traffic is generated at the rate of 1.31 Gbps in a single worker configuration with different number of transmit queues. Compared to that of the target traffic profile (synthesis trace), the MSE of the generated traffic distribution (1 TXQ) is 12,362. The Pearson correlation coefficients are 0.21, 0.37 and 0.33 for 1 TXQ, 2 TXQ and 3 TXQ.
in Figure 10, the MSE decreased by 74% even with only one transmit queue
497
used. It can be seen on both the histogram and the CDF that the generated
498
traffic came significantly closer to the target traffic profile.
499
The experiment result of the 6.72 Gbps traffic profile with single-worker
500
configuration is shown in Figure 11. With profile, the MSE was amplified as
501
the volume of traffic increased. We perceived a similar trend to that of 1.31
502
Gbps. In single-worker configuration, the MSE decreased as the number of
503
transmit queues increased. We further increased the volume of the traffic
504
profile to 9.19 Gbps in order to explore the limits of our system. As shown in
505
Figure 12, it is obvious that we reached the limit, and that the single-worker
506
configuration could no longer keep up with the desired traffic volume. We
507
can see from the CDF of the packet rate that the generated packet rate was
508
capped at around 12.95 Mpps.
509
Figure 10: Histogram of packet rate with the feature of hardware-based rate limiting.
A Poisson traffic is generated at the rate of 1.31 Gbps in a single worker configuration.
Compared to that of the target traffic profile (synthesis trace), the MSE of the generated traffic distribution (1 TXQ) is 3,195. The Pearson correlation coefficients are 0.73, 0.82 and 0.61 for 1 TXQ, 2 TXQ and 3 TXQ.
6.2.3. Accuracy Test for Multi-Worker
510
Thus far, experiments were conducted under a single-worker configura-
511
tion. We were keen to determine the impact of a multi-worker configuration
512
with different transmit queues. Compared to that of the single-worker con-
513
figuration with a traffic volume of 1.31Gbps, the average MSE of the multi-
514
worker configuration was increased by 24% and the mean packet rate was
515
dropped by 1%. The main reason was due to a time synchronization error
516
which directly leads to a decrease in the average packet rate. In the multi-
517
worker configuration, time synchronization was critical as all the workers
518
were configured to start packet generation at a scheduled point-in-time.
519
The experiment result of 6.72 Gbps traffic profile with multi-worker con-
520
figuration is shown in Figure 13. As shown in the figure, the decrease of
521
MSE is obvious as the number of transmit queues increased. The volume
522
of the traffic profile was further increased to 9.19 Gbps in order to explore
523
the limits of our system. As shown in Figure 12, it was obvious that we
524
had reached the limit, and that at 9.19 Gbps the single-worker configuration
525
could no longer keep up with the desired traffic volume. The desired traffic
526
profile was offloaded to multiple workers and the result shown in Figure 14.
527
The limitation of traffic generation in a single-worker setup can be overcome
528
with the multi-worker configuration. A scenario of perfect time synchroniza-
529
tion by manually realigning the packet streams from each worker is shown
530
in Figure 14. The MSE decreased by 70% compared to that of the original
531
trace.
532
6.2.4. Reproducibility of the Experiment Results
533
To show the reproducibility of the experiment results, we replicate CBR
534
and Poisson traffic generation using 5 workers with HRL enabled. The max-
535
imum measurable throughput of our capture card is 10 Gbps; thus, we select
536
two traffic volume for each traffic profile: a lower one which is close to 50% of
537
the measurable traffic, and a higher one which is around 90% of the measur-
538
able limit. The Poisson traffic generation is generated with a fixed random
539
seed. The NMSE of the result is shown in Table 6, and the estimated intervals
540
are calculated with 95% confidence level.
541
Table 6: Reproducibility Test Result.
Traffic Type
Bitrate Replications NMSE
CBR 5 Gbps 10 2.70E − 05 ± 2.03E − 05
9 Gbps 10 4.70E − 05 ± 2.03E − 05
Poisson 6.72 Gbps 10 4.91E − 05 ± 2.91E − 05 9.19 Gbps 10 7.04E − 05 ± 2.83E − 05
6.3. Discussion
542
The system utilizes the hardware rate limiting feature of a network in-
543
terfaces card to provide better accuracy for the software-based rate-limiting
544
mechanism. However, the test results show that enabling hardware-based
545
rate-limiting may affect the throughput of the traffic generated by the sys-
546
tem. When conducting a test that requires maximum throughput, optionally
547
disable hardware-based rate-limiting helps the system extract the maximum
548
performance from the hardware. On the other hand, when performing packet
549
Figure 11: Histogram of packet rate at 6.72 Gbps (Poisson traffic) with single worker of hardware-based rate limiting. Compared to that of the target traffic profile (synthesis trace), the MSE of the generated traffic distribution (1 TXQ) is 8,221. Pearson correlation coefficients are 0.64, 0.72 and 0.57 for 1 TXQ, 2 TXQ and 3 TXQ.
generation of specific traffic distribution with multiple nodes, the accuracy
550
can be increased by enabling hardware-based rate-limiting, as each node only
551
generates part of the total traffic components, The accuracy of our system
552
under a multi-worker configuration highly correlate to the accuracy of time
553
synchronization. With more workers being added to the system, the er-
554
ror of generated traffic distribution increased correspondingly as a result of
555
time synchronization. On top of that, the accuracy of the system could be
556
increased by increasing the number of transmit queues, especially when a
557
hardware rate-limiting feature was enabled.
558
The results of the experiment provide a guideline for configuring the sys-
559
tem. First of all, the hardware-based rate-limiting is preferred over software-
560
based rate limiting for accuracy. While enabling HRL can lower the through-
561
put of the network interface, this can be partly mitigated by increasing the
562
number of configured transmit queues. Secondly, the number of workers re-
563
quired depends on the capacity of the worker. The rule of thumb is to have a
564
total system capacity exceeding the maximum traffic of the traffic profile to
565
Figure 12: The CDF of packet rate at 9.19 Gbps (Poisson traffic) with single worker (Hardware-based rate limiting with single computing core). Compared to that of the target traffic profile (synthesis trace), the MSE of the generated traffic distribution (1 TXQ) is 921,024. Pearson correlation coefficients of all three traces are below 0.01.
avoid overrunning individual workers. The capacity of the system is calcu-
566
lated as the product of port bandwidth and the number of ports when HRL
567
is disabled. When HRL is enabled, the required capacity is roughly double
568
of the capacity with HRL disabled.
569
6.3.1. Time Synchronization
570
In a multi-worker configuration, high-quality time synchronization was
571
one of the critical factors in achieving high accuracy traffic profile generation.
572
Time skew among the workers prevented them from starting packet genera-
573
tion at the exact point-of-time as desired. Also, as shown in our experiment a
574
time skew within 10 milliseconds could result in a 70% MSE increment com-
575
pared to one with perfect time synchronization. The quality of network time
576
synchronization depended on the software implementation and most impor-
577
tantly, the support of the hardware timestamp. In our work, we adopted the
578
clock-disciplined linuxptp[21] implementation which features a proportional-
579
integral controller servo for frequency adjustment of PTP hardware clock.
580
Figure 13: The CDF of packet rate at 6.72 Gbps (Poisson traffic) with 5 workers (Hardware-based rate limiting). Compared to that of the target traffic profile (synthe- sis trace), the MSE of the generated traffic distribution (1 TXQ) is 38,422. Pearson correlation coefficients are 0.73, 0.58 and 0.78 for 1 TXQ, 2 TXQ and 3 TXQ.
We configured one worker as the grandmaster while other workers operated
581
in slave mode. The workers in slave mode synchronized their PHC to that of
582
the grandmaster. A daemon on each worker then synchronized the hardware
583
clock to the system clock. We noticed a time error deviation of 200 nanosec-
584
onds. Errors in the hardware clock to system clock synchronization came to
585
within 100 nanoseconds deviation was also observed for most of the hosts.
586
6.3.2. Frequency Component Selection
587
A given traffic distribution consists of various frequency components. For
588
example, a CBR traffic consists of only one dominant frequency component
589
while a given Poisson traffic profile is made up of different frequency com-
590
ponents. The more the number of frequency components selected during the
591
packet generation process, the higher the accuracy of the traffic generated.
592
However, with more frequency components selected, the worker node takes
593
more time and computation resources to generate traffic in time. Figure 15
594
shows the accuracy of the generated traffic and the computation time mea-
595