碩士論文
Global MBA College of Management National Taiwan University
Master Thesis
永續性潔淨能源發展於紐西蘭酪農業的可行性研究
A feasibility study on the development of a sustainable clean energy source for the New Zealand dairy industry
伊寧楷
Nigel Hastings Ingram
謝冠雄 博士
Advisors: Kuan-Hsiung Hsieh, Ph.D.
And
曹承礎 博士
Seng-Cho Chou, Ph.D.
中華民國101年11月 November, 2012
ABSTRACT
“We cannot solve our problems with the same thinking we used when we created them.”
Albert Einstein
The central proposition of this study states that exploring natural gas as a clean fossil fuel option is seen as a pragmatic approach when combined with commercial innovation, particularly when it comes to long-term supply and demand sustainability options, and in meeting environmental concerns. More importantly, it addresses the long-term sustainability of New Zealand’s dairy industry by maximising energy efficiency and minimising energy and operating costs, contributing to feasible options for lowering greenhouse gas (GHG) emissions, and creating future stability in terms of capital and operational cost structures. For this to be achieved the study explores options associated with combining fuel cell technology to generate electricity from natural gas.
There is little doubt that the agricultural sector is one of New Zealand’s largest GHG emitters. The need to start investing in cleaner technologies is one of a number of measures to achieve sustainable transformation over the next 20 to 40 years and beyond in both an economic and environmental context. It requires a combined effort in terms of sound policy, government and industry leadership, and stakeholder cooperation and agreement to build and shape the future required to meet global energy and climate goals. The study will set out to establish that continued success of the New Zealand dairy industry depends on its ability to take a lead position in promoting innovative investment in clean energy technology, infrastructure development, and the promotion of a sustainable environment. To maintain global competitiveness the dairy industry cannot rely upon utility companies to drive the development and use of changing energy
forms to contribute to industry trade expansion, profitability, and long-term sustainable economic growth for New Zealand. “Economic growth and technological change are accompanied by what the great economist Joseph Schumpeter called creative destruction. They replace the old with the new. New sectors attract resources away from old ones. New firms take business away from established ones. New technologies make existing skills and machines obsolete.” (Acemoglu & Robinson, 2012, p. 84). Bold new decisions will need to be taken to forge ahead with the adoption of cleaner energy sources and smarter technology to meet future energy needs. This will become critical given New Zealand’s ageing hydro-electricity infrastructure and the high capital cost of new generation resources in a country that is geographically isolated from world markets. The study concludes with recommendations and suggestions for future research on the development of a sustainable clean energy source in the form of an off- the-grid power generation system for the New Zealand dairy industry.
ACKNOWLEDGEMENTS
I wish to thank my advisor Dr Edward Hsieh and co-advisor Dr Tim Chou for their guidance. I am most appreciative for the flexibility and understanding given by my colleagues at the New Zealand Commerce and Industry Office and especially from my Director, Stephen Payton. I would also like to express my thanks to Dr Mehdi Asali, Modelling and Forecasting Analyst in the Petroleum Studies Department at the Organization of the Petroleum Exporting Countries (OPEC), and Mr Robin Shaffer, Vice President of Sales at ClearEdge Power, Mr John Gregan, and Mr Kerry O’Connell for their expert advice and support.
Finally, I would like to express my gratitude to my wife, Amanda and children, Hugh and Daisy. This would not have been possible without their encouragement, patience, and understanding.
TABLE OF CONTENTS
Page
Abstract ... i
Acknowledgements ... iii
Table of Contents ... iv
List of Figures ... vii
List of Abbreviations ... x
1 INTRODUCTION ... 1
1.1 Discussion of Context ... 2
1.2 Central Proposition ... 5
1.3 Limitations ... 7
2 LITERATURE REVIEW ... 9
2.1 New Zealand Environment ... 13
2.2 Dairy Industry ... 16
2.3 Energy Industry ... 27
2.4 International Legislation ... 31
2.5 Milk Production Emissions ... 35
2.6 The Kyoto Protocol ... 38
2.7 New Zealand Legislation ... 38
3 RESEARCH METHODOLOGY ... 43
3.1 Energy and Environmental Sustainability ... 45
3.2 Energy Sources ... 52
4 CLEAN ENERGY SUPPLY AND DEMAND ... 54
4.1 Oil and Gas ... 56
Page
4.2 Coal ... 58
4.3 Nuclear ... 59
4.4 Hydro ... 60
4.5 Wind ... 62
4.6 Geothermal ... 64
4.7 Biomass ... 64
4.8 Solar ... 65
4.9 Tidal ... 65
4.10 Biogas ... 66
5 RENEWABLE ENERGY COSTS ... 67
5.1 Wind ... 68
5.2 Hydro ... 69
5.3 Geothermal ... 71
5.4 Electricity Costs ... 72
6 CLEAN ENERGY OPTIONS AND INDUSTRY APPLICATION ... 76
6.1 Fuel Cell Technologies ... 76
6.2 Feasibility of Bloom Energy ... 84
6.3 Feasibility of UTC Power ... 88
6.4 Feasibility of ClearEdge Power ... 90
6.5 Industry Application of ClearEdge5 Energy System ... 92
6.6 Levelized Cost of Energy ... 94
6.7 Payback Period ... 98
7 FINDINGS ANALYSIS ... 103
Page 8 CONCLUSION ... 106 9 REFERENCES ... 111 10 APPENDICES ... 117
LIST OF FIGURES
Page
Figure 1 Smith Meter International Biofuel Blending Skid ... 7
Figure 2 Clean Energy Influences ... 12
Figure 3 Main Trading Partners, 2011 (NZ$ million) ... 14
Figure 4 New Zealand Dairy Farm ... 16
Figure 5 Closing Term Liabilities per kgMS ... 21
Figure 6 Farm Sales, Median Price ... 24
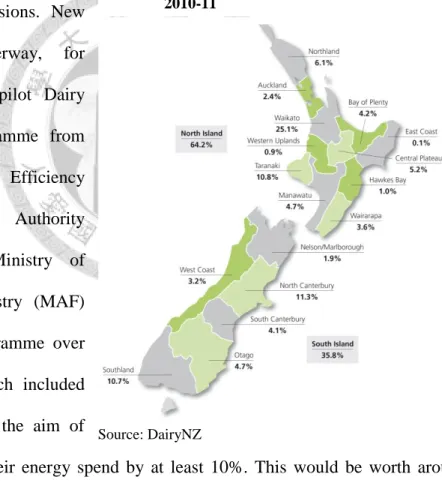
Figure 7 Regional Distribution of Dairy Cows 2010-11 ... 25
Figure 8 Breakdown of a Typical Person’s Carbon Footprint ... 32
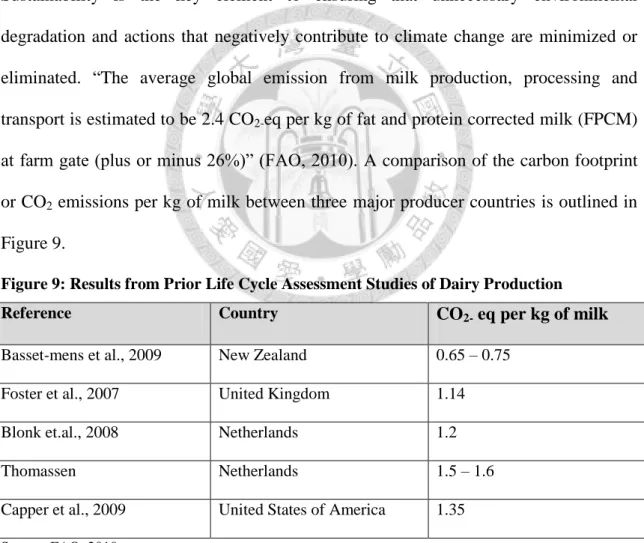
Figure 9 Results from Prior Life Cycle Assessment Studies of Dairy Production ... 36
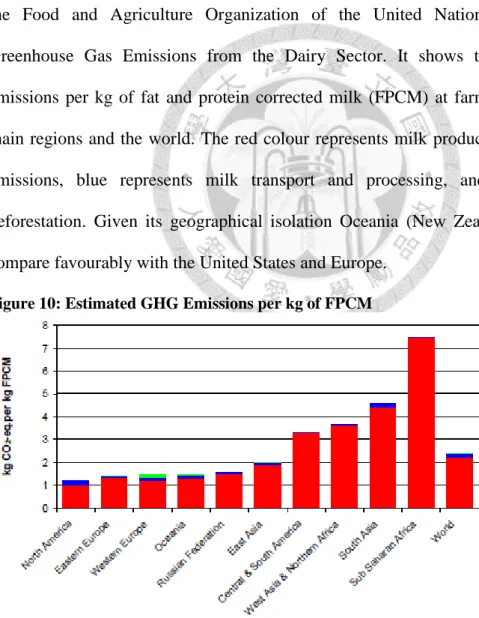
Figure 10 Estimated GHG Emissions per kg of FPCM ... 37
Figure 11 New Zealand Emissions Trading Scheme (ETS) ... 40
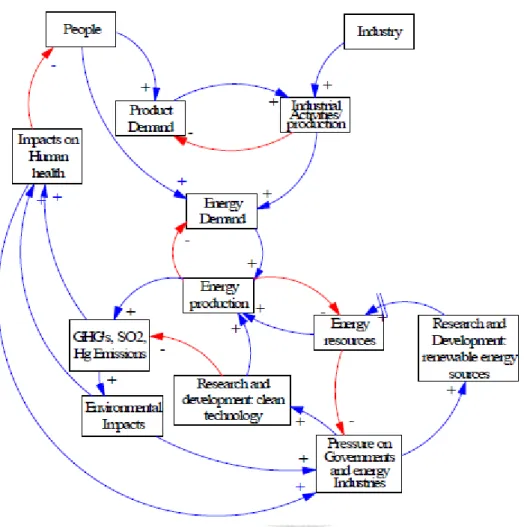
Figure 12 Energy System Causal Loop Diagram ... 45
Figure 13 Integration of Sustainability in Business Processes ... 46
Figure 14 Value Creation Levers of a Sustainable Transformation ... 48
Figure 15 Sovereign Debt Vulnerability Scores ... 50
Figure 16 Use of Weekly Allocated Water, 2010 ... 51
Figure 17 Pattern of Oil Discovery Peaks and Consumption ... 52
Figure 18 Natural Gas and Coal Combustible CO2 Emissions ... 52
Figure 19 Electricity Generation by Fuel, 1990 – 2035 (TWh/year) ... 53
Figure 20 Energy Supply and Demand Balance 2011 (Gross PJ) ... 54
Figure 21 New Zealand Total Primary Energy Supply ... 55
Figure 22 New Zealand Energy Map ... 56
Page Figure 23 World Bank: Present and Projected Wind Turbine
Capital Costs (US$/kW) ... 68
Figure 24 World Bank: Present and Projected Wind Turbine Generation Costs (USc/kWh) ... 68
Figure 25 World Bank: Large Hydroelectric Power Plant Capital Costs (US$/kW) ... 69
Figure 26 World Bank: Large Hydroelectric Power Generation Costs ((USc/kWh) ... 70
Figure 27 World Bank: Geothermal Power Plant Capital Costs (US$/kW) ... 71
Figure 28 World Bank: Geothermal Power Plant Generation Costs ((USc/kWh) ... 72
Figure 29 The Electricity Price Required to Justify New Generation Construction (c/kWh) ... 73
Figure 30 Contact Energy Electricity Pricing ... 73
Figure 31 Electricity Residential Price Comparison ... 74
Figure 32 Wholesale Electricity Price (c/kWh) ... 75
Figure 33 Energy Savings Using BlueGen ... 77
Figure 34 Comparison of Fuel Cell Technologies ... 78
Figure 35 Global Energy Demand by Fuel Type ... 82
Figure 36 SOFC Practical Application ... 84
Figure 37 Scheme of a SOFC ... 84
Figure 38 Bloom Energy ES-500 Server ... 87
Figure 39 What is Inside Each Bloom Energy Server? ... 87
Figure 40 How Does the Bloom Energy Server Fuel Cell Work? ... 87
Figure 41 UTC Power 40 kW Fuel Cell ... 89
Figure 42 ClearEdge Power Fuel System ... 90
Page Figure 43 ClearEdge Plus Fuel Cell ... 92 Figure 44 Payback Period Comparison ... 100 Figure 45 Dairy Farm Energy Consumption ... 104
LIST OF ABBREVIATIONS AC Alternating Current Btu British Thermal Unit
CCHP Combined Cooling, Heat and Power CCPI Climate Change Performance Index CH4 Methane
CO2 Carbon Dioxide COGS Cost Of Goods Sold CSG Coal Seam Gas
dB Decibel
DC Direct Current
DOE United States Department of Energy ECT Energy Charter Treaty
EECA Energy Efficiency and Conservation Authority EECS Energy Efficiency and Conservation Strategy EIA Energy Information Administration
ESMAP World Bank Energy Sector Management Assistance Program ETS Emissions Trading Scheme
EU European Union
FPCM Fat and Protein Corrected Milk
FAO Food and Agriculture Organization of the United Nations FTE Full-Time Equivalent (Employee or Staff)
GATS General Agreement on Trade in Services GATT General Agreement on Tariffs and Trade
GFC Global Financial Crisis GHG Greenhouse Gas
GWh Gigawatt Hour (unit of electrical energy equal to one billion [10^9] watt hours or one thousand megawatt hours)
H2S Hydrogen Sulphide
HVDC High Voltage Direct Current IEA International Energy Agency
IPCC Intergovernmental Panel on Climate Change IRR Internal Rate of Return
kg Kilogram
kgMS Kilogram of Milk Solids
kW Kilowatt (unit of power equal to one thousand watts of electrical power) kWh Kilowatt Hour (unit of energy equal to one thousand watt hours – kWh is
the billing unit for delivered electricity by utilities)
kW/m Mechanical Power in kW (available to produce the electrical power)
lbs Pound
LCOE Levelized Cost of Energy LFF Liquid Fossil Fuel
LNG Liquid Natural Gas LPG Liquid Petroleum Gas
MJ Megajoule (equal to one million or 106 joules) MAF Ministry of Agriculture and Forestry
MED Ministry of Economic Development MkWh Million Kilowatt Hours
MMBtu One Million British Thermal Units (a measurement of gas based on a standard heat value or stored energy. A Btu is the amount of heat required to raise one pound of water one degree Fahrenheit)
Mt Megatonne (A metric unit equal to one million (106) tonnes or one billion (109) kilograms)
NASA National Aeronautics and Space Administration NIWA National Institute of Water and Atmosphere N2O Nitrous Oxide
NPV Net Present Value
NZ New Zealand
NZES New Zealand Energy Strategy O&M Operations and Maintenance
OECD Organization for Economic Co-operation and Development PAFC Phosphoric Acid Fuel Cell
PEM Proton Exchange Membrane or Polymer Electrolyte Membrane PKE Palm Kernel Expeller
PJ Petajoules (equal to one quadrillion 1015 joules. A joule is equal to the energy expended in applying a force of one newton [ ] through a distance of one metre)
PV Photovoltaic
RES Renewable Energy Sources RMA Resource Management Act 1991 ROI Return On Investment
SCBA Social Cost Benefit Analysis
SEIP Stationary Energy, Industrial Processes SG&A Selling, General and Administrative Expenses SGIP Smart Grid Interoperability Panel
SOFC Solid Oxide Fuel Cell
TJ Terajoules (equal to one trillion or 1012 joules)
TRIPS Agreement on Trade Related Aspects of Intellectual Property TWh Terawatt Hours
UN United Nations
UNFCCC United Nations Framework Convention on Climate Change US United States of America
WACC Weighted Average Cost of Capital WEC World Energy Council
WTO World Trade Organization
1. INTRODUCTION
Increased production of energy, chemicals, and other materials brought about by an escalation in the world’s population (7 billion at 31 October 2011), has significantly affected levels of pollution and resulted in grave deterioration of the Earth’s natural
environment and fragile ecology. Richard A Muller, Professor of Physics at UC Berkeley, MacArthur Fellow and co-founder of the Berkeley Earth Temperature
Project, recently announced “Three years ago I identified problems in previous climate studies that, in my mind, threw doubt on the very existence of global warming. Last year, following an intensive research effort involving a dozen scientists, I concluded that global warming was real and that the prior estimates of the rate of warming were correct. I’m now going a step further: Humans are almost entirely the cause.” (Banajee, 2012). Other scientists have been making the same claim for the past 20 years and Professor Muller’s turnaround is a triumph for the science of global warming but a major blow to the ranks of climate change sceptics. But is the interpretation of Muller’s
“conversion” from a so-called climate change sceptic all that it has been made out to be? It appears more likely that his past comments were misjudged by those with a foot firmly in the climate change camp. There is a strong argument that Muller has always been concerned about global warming and the effects of climate change. He simply disagreed with the robustness of the science behind the “hockey stick” graph. The graph was relied upon by the Intergovernmental Panel on Climate Change (IPCC) to highlight unprecedented levels of an increase in global temperatures, particularly during the twentieth century. (Lyons, 2012). Muller essentially believed that it was important to show beyond reasonable doubt through the application of rigorous scientific research that global warming does indeed exist and threatens our very existence as we know it.
This thesis topic explores, in particular, the dairy industry in New Zealand, given the significant and wide-reaching changes to the landscape and natural environment brought about by its rapid expansion in the past decade and its key position as New Zealand’s number one export industry. Consequently, discourse on water usage, security of supply, and sustainable energy has increased among policy makers, stakeholders and the general public. Hence, the main aim of this study is to explore the potential for an alternative, sustainable energy source for the New Zealand dairy industry. In particular, it will investigate how fuel cell technology combined with the use of natural gas may help the New Zealand dairy industry producers and farmers improve upon their environmental sustainability through (1) reducing operating costs; (2) lowering GHG emissions; and (3) minimizing exposure to fluctuating energy costs. Science has proven that carbon dioxide (CO2) emissions weaken our environment’s natural defenses. This tendentious study will examine how natural gas when used in conjunction with a distributed generation system can produce clean, consistent, and affordable electricity.
1.1 Discussion of Context
The IPCC is an organization that assesses the scientific, technical and socio-economic information relevant for the understanding of the risk of human-induced climate change (http://www.ipcc.ch). “Over the last three decades, GHG emissions have increased by an average of 1.6% per year, with CO2 emissions from the use of fossil fuels growing at a rate of 1.9% per year” (IPCC Fourth Assessment Report, Climate Change, 2007).
With global energy use and supply projected to continue growing, without policy changes by governments and industry more than 80% of the energy supply will continue to be based on fossil fuels through the timeframe 2025 - 2030. “Fossil fuels are a natural
fuel such as coal or gas, formed in the geological past from the remains of animals and plants” (The Compact Oxford English Dictionary). IPCC has reported that projected emissions of energy-related CO2 in 2030 are 40% - 110% higher than in 2000, with per capita emissions in developed countries even greater. For 2030, GHG emission projections show 25% - 90% increase compared to 2000. The anthropogenic impact on the environment and climate change (where humans are causing global warming) becomes easier to understand when we see energy demand surging and “64% of people think fossil fuels will still be the world’s primary energy source in 2030” (The Economist, November 12, 2011, p. 21). The Climate Change Performance Index (CCPI) aims at enhancing transparency of national and international efforts to avoid dangerous climate change, but only covers emissions from CO2 arising from the use of fossil fuels.
Deforestation, agriculture and waste activities which are responsible for around 20% of GHGs will hopefully be included in the next CCPI edition. CCPI was developed to accompany countries along the path to reducing CO2 and the effects of climate change, and to show the strengths and weaknesses in the development of their national and international climate policies.
Key components and weightings of the CCPI are (1) emission trends 50%;
(2) emissions levels 30%; and (3) climate policy 20%. On the 2012 CCPI for Organization for Economic Co-operation and Development (OECD) member countries (which enables a comparison of emitters with more or less similar basic conditions)
“New Zealand ranks 32 with a score of 54.5 among 58 countries, up five places from the country’s 2011 ranking of 37 with a score of 53.73” (The Climate Change Performance Index, 2012, p. 18).
While the score correlates to a ‘poor’ rating, the New Zealand Government is focused on creating a balance between protecting the environment and economic development.
As oil producing countries in the Middle East and elsewhere grapple with internal supply flow shrinkage and the effects of peak oil –the point at which oil supply begins to decrease – a shift to clean and renewable energy sources becomes essential as the availability of cheap and plentiful oil declines. According to ExxonMobil “Natural gas will be the fastest-growing major fuel to 2040, with demand rising by more than 60%.
Much of this growth will come from electric utilities and other consumers shifting away from coal in order to reduce CO2 emissions. By 2025, natural gas - which emits up to 60% less CO2 emissions than coal when used for electricity generation - will have overtaken coal as the second most popular fuel, after oil.”
So what does the future look like and what will be the global impact? ExxonMobil’s
“Outlook for Energy: A View to 2040” provides the following insights.
Global energy demand will be about 30% higher in 2040 compared to 2010, as economic output more than doubles and prosperity expands across a world where population will grow to nearly 9 billion people.
The need for energy to make electricity will remain the single biggest driver of demand.
By 2040, electricity generation will account for more than 40% of global energy consumption.
Gains in efficiency through energy-saving practices and technologies - such as hybrid vehicles and new, high-efficiency natural gas power plants – will temper demand growth and curb emissions.
1.2 Central Proposition
Exploring natural gas as a clean fossil fuel option is seen as a pragmatic approach when combined with commercial innovation, particularly when it comes to long-term supply and demand sustainability options, and in meeting environmental concerns. This is a study of the development of a sustainable clean energy source for the New Zealand dairy industry, and will explore the following research question:
To what degree can an “off-the-grid” power generation system utilizing an innovative fuel cell technology and natural gas (1) reduce operating cost; (2) lower GHG emissions; and (3) minimize exposure to fluctuating energy costs?
By reviewing existing literature, and evidence from research, the study will draw conclusions on the strategies suggested in the research methodology and will be informed by the literature review. A key component of this feasibility study is about ensuring the long-term sustainability of New Zealand’s dairy industry by maximizing energy efficiency and minimizing energy costs. In the South Island, the primary energy source for most milk processing plants is coal which is used to generate thermal (steam) energy. But in the North Island reticulated natural gas and other alternative energy sources are available to meet process energy demands. The methodology approach has been to use a combination of qualitative and quantitative data from primary and secondary sources. “Decision problems involving accounting data typically are specified in quantitative terms. The criteria in such problems usually include objectives such as profit maximization or cost minimization. The qualitative characteristics of the alternatives can be just as important as the quantitative measures. Qualitative characteristics are the factors in a decision problem that cannot be expressed effectively
in numerical terms” (Hilton, 2010, p. 589). The study evaluates an assumed investment by the dairy industry to make its products utilizing electricity generated by distributed systems that are located on-site and off-the-grid that produce full-time power 365 days of the year. According to Wikipedia (the web free encyclopedia) “feasibility studies aim to objectively and rationally uncover the strengths and weaknesses of an existing business or proposed venture, opportunities and threats as presented by the environment, the resources required to carry through, and ultimately the prospects for success. In its simplest terms, the two criteria to judge feasibility are cost required and value to be attained. Generally, feasibility studies precede technical development and project implementation. Moreover, it is an analysis and evaluation of a proposed project to determine if it (1) is technically feasible, (2) is feasible within the estimated cost, and (3) will be profitable” (http://www.wikipedia.org).
Through answering the question, the objective is to present findings, recommendations, and suggestions for future research that may go some way toward improving energy security and providing a clear path to energy independence. The sustainability of all life forms, the continuation of the human race, and slowing the rapid decline of biodiversity on Earth depends on it.
1.3 Limitations
Certain restrictions had to be taken into account in completing this study. It attempted to address, essentially through a financial cost benefit analysis, the question of reducing operating costs, lowering GHG emissions, and minimizing exposure to fluctuating energy costs. But this had to be completed within the context of exploring the technical feasibility, cost structures, and profitability of an off-the-grid power generation system that utilizes fuel cell technology to generate electricity from natural gas. The idea of operating a fuel cell on biogas created from plant waste, or methane recaptured from landfills and farms was also explored.
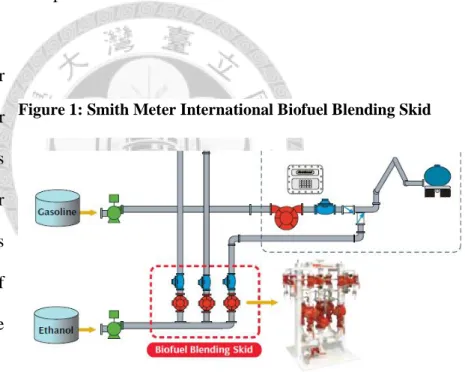
Typical sources for biogas include water treatment facilities (Anaerobic Digester Gas) and biomass plants (gasification of biomass to create methane-based
“syngas”). The composition of gas used to fuel any fuel cell is very important. Large skids of equipment costing many thousands of dollars are required to clean-up gas and make it suitable for use in a fuel cell or in a micro-turbine. These skids often consist of state-of-the-art metering technology for positive displacement and turbine meters, along with digital flow control valves to provide optimum measurement accuracy. Landfills, for example, are generally not a good source for gas because it can be difficult to know
Figure 1: Smith Meter International Biofuel Blending Skid
Source: FMC Technologies
for sure what the composition of detritus is within the landfill and this tends to change over time as the landfill ages. The quality of the biogas that results from the cleaning process may often be questionable with no guarantee that it will not have any adverse effects on the fuel cell. Furthermore, the clean-up process may be cost prohibitive compared to the cost of using natural gas. Had there not been a time limitation for this study, a more thorough investigation could have been undertaken on external factors associated with reducing dairy industry CO2 emissions. The study could also have undertaken a more in-depth investigation of feasibility factors in terms of the project’s total economic cost and total economic benefits, more commonly known as Social Cost Benefit Analysis (SCBA). The value proposition of a SCBA would most likely have highlighted the disparate interests of the various industry stakeholders. For example, the dairy industry is New Zealand’s biggest export earner and farmers and producers will likely view the study in light of the financial cost benefit analysis when assessing the conclusions reached. On the other hand, environmental groups and organizations will no doubt place greater importance on the outcomes that can be achieved in terms of addressing global warming and reducing industry CO2 emissions. Therefore, a self- imposed limitation on the extent of research was necessary to remain within the scope of the thesis concentration.
2. LITERATURE REVIEW
To help achieve a balance between protecting the environment and economic development, the New Zealand Government introduced an Emissions Trading Scheme (ETS) which took effect on 1 July 2010. The ETS is designed to change behaviour and reduce emissions and is New Zealand’s key mechanism for meeting the country’s commitments under the Kyoto Protocol. There is no binding international agreement about the GHG emissions beyond 2012, although New Zealand has signed up to the 2009 Copenhagen Accord
(http://unfccc.int/meetings/cop_15/copenhagen_accord/items/5262.php) and has submitted to the United Nations Framework Convention on Climate Change (UNFCCC) a conditional emissions reduction target range of 10% - 20% below 1990 levels by 2020.
A key issue is how to ensure New Zealand’s dairy industry remains economically competitive on the world stage when farmers in the European Union (EU) and United States of America (US) for example, receive increased payout for milk and assistance with technology development through a range of subsidies. For a geographically isolated country like New Zealand, the answer lies in (1) being an efficient producer; (2) having a streamlined transportation system incorporating land, sea, and air to reach domestic and export markets in an efficient, timely, and cost-effective manner; (3) exploring innovative ways to meet the rising demand for food; and (4) remaining focused on environmentally sustainable farming practices which incorporate the introduction of innovative clean energy sources.
In March 2011, the government announced a long-term target of a 50% reduction in New Zealand’s GHG emissions from 1990 levels by 2050. Agriculture accounts for about half New Zealand’s GHG emissions, which mainly come from methane (CH4) emanating from ruminating animals and nitrous oxide (N2O) released from patches of urine in grass paddocks. The entry date to the ETS for agriculture has been deferred to 1 January 2015(now indefinitely following legislation passed by 61-58 on 8 November 2012); primarily due to concerns about the cost to New Zealand’s agricultural sector and to give farmers time to study new systems and technology for reducing emissions. It should be noted that New Zealand farmers receive no government subsidies, and it is considered that making the farming sector comply with the ETS at this point in time may give unfair advantage to competing economies that receive subsidies.
The Farm Subsidy website states that the EU spends around €55 billion a year on farm subsidies, representing more than a third of farmer’s income (http://www.farmsubsidy.org) In 2008, France (the EU’s biggest food producer) received €9,940 million in EU farm subsidies or approximately €18,862 (NZ$28,521) per farm and in the same year the United Kingdom received €3,755 million or approximately €12,517 (NZ$18,927) per farm. The XE currency exchange homepage exchange rate as at 5 August 2012 was 1 EUR = 1.51208 NZD (http://www.xe.com) Interestingly, the Oxfam International states that Europe’s cows receive over $2 a day in subsidies, more than the income of half the world’s population (Oxfam Briefing Paper, 2012). As competitors in the global dairy industry, these two countries receive an unfair monetary advantage when weighed against operating costs of a typical New Zealand dairy farm. A herd manager, for example, earns an average of NZ$42,000 per year.
Average pay for herd and farm managers ranges between NZ$45,000 and NZ$60,000 and people in charge of large or multiple dairy farms earn an average of NZ$71,000 (CareersNZ, 2012). Also of concern is the agribusiness Rabobank forecast of a growth slowdown for New Zealand dairy exports over the next decade in the face of increased competition from other market suppliers. For example, “milk production in the EU is expected to increase by between 55% and 60% in the five years following the 2015 EU milk quota abolition” (Astley, 2012). Physical land use constraints in New Zealand due to the country’s small size, lack of suitable land for conversion, and increased competition from EU farmers in receipt of generous subsidies makes for a difficult market industry. However, with the strong New Zealand dairy co-operative mechanism, continued innovation in technology and systems improvements, on-farm efficiencies resulting in increased per-cow milk production, and development of new ways to save energy, the dairy industry should still be an attractive sector. It will continue to be an important and valuable contributor to New Zealand’s economy. Governments around the world are facing an urgent need to address the sources of energy that are required to meet the demand for continued economic growth in both developing and developed countries. Many initiatives include establishing alternative renewable energy sources that are cleaner than fossil fuels. Advancements in science and engineering technology have resulted in new ways to more efficiently generate electricity. As a result there is an emerging array of new means to harness clean and renewable energy sources that are potentially more efficient, cleaner, safer, and capture GHG emissions and prevent their entry into the atmosphere. The result is hopefully a reduction of CO2 emissions and global warming. In April 2009 United States President Barack Obama committed to invest US$150 billion over 10 years in clean energy research and development and a
few months later in June, the United States House of Representatives agreed for the first time to cap carbon dioxide emissions (Spicers, 2009). “We know the country that harnesses the power of clean, renewable energy will lead the 21st Century.” President Barack Obama (Presidential Address to Congress, February 2009).
Following the March 2011 Fukushima nuclear crisis in Japan and the intense worldwide focus on safety of nuclear energy, public opinion in New Zealand is as strong as ever with regard to
ensuring that clean and renewable energy sources are the most suitable way to shoulder the electricity load.
Several combinations may need to be used for consistency of supply and demand. For example, wind resources may be more predictable and regular than the rainfall required for hydro-electricity generation. It could be a supplementary resource to hydro when insufficient water is available. Likewise, geothermal power production also has excellent potential. But it is also about striking a balance to ensure security of electricity supply in order to meet demand from all sectors when weather-dependent renewable generation is unavailable. That includes the use of fossil fuels (i.e. coal, oil, and natural gas) in the foreseeable future as a means of generating electricity. The key aim is to develop technologies that make the use of such fossil fuels cleaner and reduce CO2
emissions.
Source: Spicers Portfolio Management Ltd Figure 2: Clean Energy Influences
2.1 New Zealand Environment
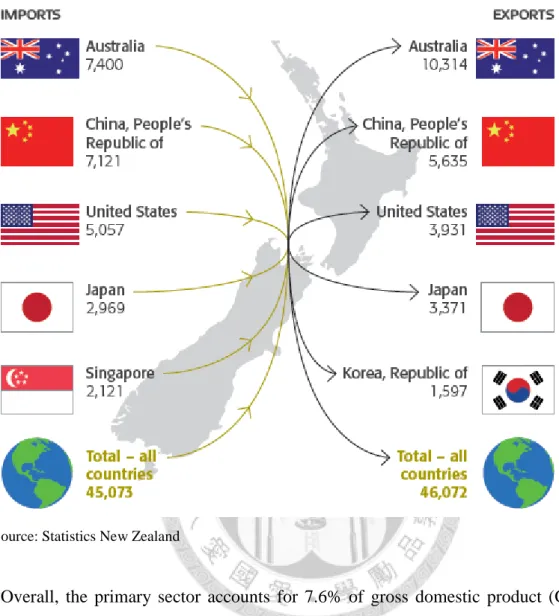
Comparable in size (268,680km) to the United Kingdom and the Philippines, New Zealand is an island country in the south-west Pacific. New Zealand comprises the North Island and South Island, and a host of smaller islands. The North Island is mainly rolling hill country, much of which is farmed. The South Island is divided by the Southern Alps, which run most of its length and rise to over 3,000 metres. Extensive areas are set aside as national parks and the temperature varies anywhere from a low of 2ᵒC in winter (in the South Island) to highs of 35ᵒC in summer. The New Zealand energy sector is reliant upon imports of liquid petroleum fuels which are supplemented by a small amount of New Zealand crude from the Marsden Point Oil Refinery at the top of the North Island. The South Island energy sources are coal and hydro, while the North Island sources include gas, hydro and geothermal. New Zealand’s demand for electricity from its 4,405,200 population (2011) continues to grow and is increasing by around two percent year-on-year. With its reliance on international oil markets, New Zealand is directly affected by geopolitical instability, climatic events, natural disasters, and large increases in demand. Electricity is essential to New Zealand’s economy and as consumer spending continues to play a greater role in economic growth, the need for efficient use of energy will impact on the New Zealand electricity market over the medium to long-term. “Petroleum and petroleum products are New Zealand’s largest imports ($7.2 million), followed by mechanical and electrical machinery and equipment ($5.5 million). Imports from the top three countries of origin, Australia, China, and the United States, contribute to over 40% of all imports. Milk powder, butter, and cheese are New Zealand’s largest exports ($11.3 million), followed by meat, logs, wood, and wood articles ($8.6 million)” Statistics NZ (2012).
Figure 3: Main Trading Partners, 2011 (NZ$ million)
Source: Statistics New Zealand
“Overall, the primary sector accounts for 7.6% of gross domestic product (GDP) and contributes over 50% of New Zealand’s total export earnings” (New Zealand Economic and Financial Overview, 2012). The following key facts are also of interest (New Zealand Energy Data File, 2012):
1. New Zealand produced 17 million barrels of oil in 2011, equivalent to 43% of domestic oil product demand.
2. The first oil well in New Zealand was drilled in 1866 at Moturoa.
3. Wind electricity generation increased by 19% in 2011.
4. In 2011, 77% of New Zealand’s electricity generation came from renewable sources. This is one of the highest levels of renewable electricity generation in the OECD.
5. The average price for New Zealand crude on the international market was US$111 per barrel in 2011.
6. New Zealand households spent, on average, $190 per month on electricity and gas combined in 2011.
7. New Zealand had the sixth lowest petrol price in the OECD in 2011.
8. Meat and dairy industries in New Zealand consumed about 12 megajoule (MJ) per dollar of GDP they produced in 2011.
9. All sectors combined consumed approximately 4 MJ per dollar of GDP in 2011.
10. 52 oil and gas exploration and development wells were drilled in 2011.
The primary renewable energy sources in New Zealand are hydro, geothermal, and wind, with the predominant source being hydro-electricity. The major electricity generators in New Zealand are Meridian Energy, Contact Energy, Genesis Energy, Mighty River Power, and TrustPower. These five generators have a significant retail customer base and are able to hedge against wholesale prices they receive for electricity produced. It might appear unusual that a retailer is also able to generate electricity. The Electricity Industry Reform Act 1998 divided the electricity sector into four operating segments – Generation, Retail, Transmission, and Distribution with restrictions on ownership, above a limited threshold, between Generation/Retail on the one hand, and Transmission/Distribution on the other. Transpower, for example, owns the high voltage electricity transmission system in New Zealand and ensures electricity is delivered or
‘distributed’ to where it is required to meet supply and demand. Vector and Orion for example, are New Zealand distribution companies that work with Transpower to ensure electricity is delivered to homes and businesses, but the Act prohibits them from becoming ‘retailers’. The basis of this is to protect the end user and consumer from being captured by monopolies in the electricity supply market.
2.2 Dairy Industry
“The New Zealand dairy industry has a long history, with the first dairy cow, Shorthorns, introduced into New Zealand in 1814. As the nation developed and with the introduction of refrigeration
in the early 1880s (the first refrigerated meat left New Zealand for England in 1892), small dairy factories began to be built around the country to process butter and
cheese. In September 1872 the first dairy co-operative was started in Otago for the purpose of cheese making. By 1890 there were 150 factories nationwide, 40% being co- operatives. The Dairy Industry Act 1894 brought a regulating system of factory inspections and export quality grading system for milk payment. The number of factories peaked at about 600 in 1920, with around 85% being operated under the co- operative arrangement. With technology improvements, refrigerated transport, and processing efficiencies, the dairy industry experienced continued growth with the merger of small factories and the appearance of larger co-operatives.
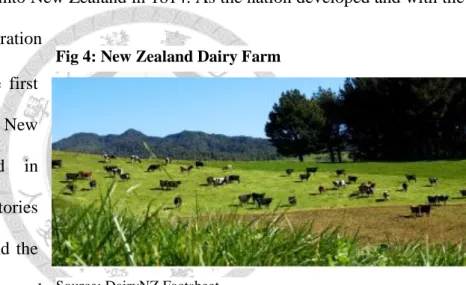
Fig 4: New Zealand Dairy Farm
Source: DairyNZ Factsheet
In the late 1990s, four remained: the New Zealand Dairy Group, Kiwi Co-operative Dairies, Westland Milk Products, and Tatua Co-operative Dairy Company. The Dairy Group and Kiwi Co-operative absorbed the New Zealand Dairy Board, and in 2001, became Fonterra Co-operative Group” (The Encyclopedia of New Zealand, 2012).
Other competing dairy producers, websites, the date they were founded, and litres of annual milk production are: Tatua Co-operative Dairy Company (http://www.tatua.com) (1914, 190m litres); Westland Milk Products (http://westland.co.nz) (1937, more than 500m litres); Open Country Dairy Ltd (http://opencountry.co.nz) (2004, 900m litres – the country’s second largest processor); Synlait Milk Ltd (http://www.synlait.com) (2000, more than 500m litres); Miraka Ltd (http://miraka.co.nz) (2011, 210m litres), and New Zealand Dairies Ltd (2006, 150m litres). New Zealand Dairies Ltd went into receivership in June 2012 due to the bankruptcy of its parent Russian owner. Fonterra was given Commerce Commission approval to purchase the assets in September 2012.
“In 2009-10 Fonterra, the country’s leading milk producer, collected 89% of national production but sold 4% to competitors with rights of access to raw milk” (Stringleman, 2011). Fonterra’s global homepage says that it collects about 16 billion litres of milk each year from its farmer shareholders (https://www.fonterra.com/global/en).
An array of safe top quality products are made by the New Zealand dairy industry from grass-fed cows on farms that are highly automated with the latest technology and stringent health and safety standards. Holstein-Friesian is now the prevalent dairy cow breed making up 43% of total dairy cows. Other breeds include Jersey and Ayrshire, plus several other various breeds. Products include whole milk, milk powders, cream,
cheese, butter, protein products (e.g. casein), yoghurt, ice-cream, organic dairy products, and infant formulas. According to Business New Zealand, in 2011 dairy industry exports totaled $12.1 billion making it the country’s largest export earner with approximately 95% of all production being exported. China holds 18% share of exports, with the Philippines, Algeria, Australia, and Saudi Arabia each holding 4% share in 2011. Contributing 25% to New Zealand’s merchandise export earnings, over a third of the world’s dairy trade comes from New Zealand dairy exports. “Key dairy industry facts are outlined as follows:
For the year ending 30 June 2011, New Zealand dairy farms processed 17.3 billion litres of milk, the average herd size is 386 cows, 24% of herds have more than 500 cows and over 450 of these herds have more than 1,000 cows.
There were 4.5 million cows being milked in 2011 or an average of 11,658 herds.
In 2010 there were approximately 1.5 million hectares used for dairy farming.
On average, New Zealand dairy cows produce 3,800 litres per head per year.
The majority of dairy herds (76%) are in the North Island, with 30% in the Waikato.
In 2010, 65% of dairy farmers who invest in farm businesses were owner operators. The remaining 35% have a part share or equity partner.
For the year ended 30 June 2011, dairy export revenue came from whole milk powder (37%); with the rest comprising butter, AMF (Andhydrous Milk Fat) and cream (18%); cheese (14%); skim milk, buttermilk, powder and infant foods (16%); casein, protein products and albumins (12%); and other dairy products (3%).
New Zealand produces approximately 2% of total world production of milk at around 16 billion litres per annum.
Main dairy exports are concentrated milk (58% share), butter (21%), cheese (11%), whey and milk products (6%), and not-concentrated milk (2%) in 2011.
New Zealand’s cow population is rapidly growing (4.5 million), at a rate faster than the country’s population (4.4 million).
Approximately 95% of all New Zealand dairy production is exported.
Dairy production has increased by 77% during the past 20 years”
(http://www.dairynz.co.nz).
According to the Food and Agriculture Organization (FAO) of the United Nations, by country the largest producer and consumer of milk in the world is India with 16% (110 billion litres per annum). More than half or approximately 55% of India’s production is buffalo milk.However, New Zealand is the world’s largest global milk exporter even though it only produces approximately 2% (16 billion litres per annum) of global production. New Zealand milk production per thousand kilograms of milk solids is shown in Appendix 1. “It takes about one kilogram of dry pasture eaten by a cow to produce one kilogram (about a litre) of milk. In New Zealand, cows are generally milked twice a day taking about two hours per milking. Mature cows eat about 17 kilograms of dry pasture each day and drink up to 50 litres of water. Grazed pasture costs less than five cents per kilogram to produce. Including capital farm costs, the cost of producing one litre of milk is 10–12 cents. In 2007/08 New Zealand farmers were paid more than 90 cents per litre” (The Encyclopedia of New Zealand, 2012). To build a complete picture of the New Zealand dairy industry, three areas require additional
commentary. They are (1) an awareness of the median price of a typical dairy farm (a possible entry barrier to many younger generation farmers with aspirations of owning their own farm); (2) factors such as payouts to dairy farmers and the effect profitability may have on their ability to enhance electricity efficiency on the potential for base-load savings through exploring alternative clean energy options; and (3) an analysis of the distribution of dairy farms around the country and what this means for the future of dairying.
The 2008 global financial crisis (GFC) and more recently the European sovereign-debt crisis resulted in significant monetary constraints on all sectors of society. Debt funding is a reality in modern day dairying and it is well known that New Zealand dairy farms are heavily indebted enterprises. Many farmers are servicing too much debt and such pressures, together with sensitivity to interest rate fluctuations has made a profitable lifestyle increasingly difficult for many farmers. Indeed, a number of dairy farmers appear to be relying on future capital gains from farm sales as their primary source of income and financial security over the long-term. “New Zealand dairy farmers had an estimated $10.6 billion of term debt (mostly in mortgages) by the end of the 2002 season. By the end of the 2009 season, this had risen to about $28 billion. The nearly three-fold increase in debt over a mere seven years is cause for concern to the industry.
In the 2009 season, farmers’ interest and rent accounted for 33% of gross farm revenue, up from 12% in the 2002 season” (Morrison, 2010). The risk of lower dairy returns, particularly as a result of increased global competition, will negatively impact on debt servicing and farmer drawings. Put simply, it affects not only farmers’ standard of living but other areas such as the retail sector in rural communities and the New Zealand
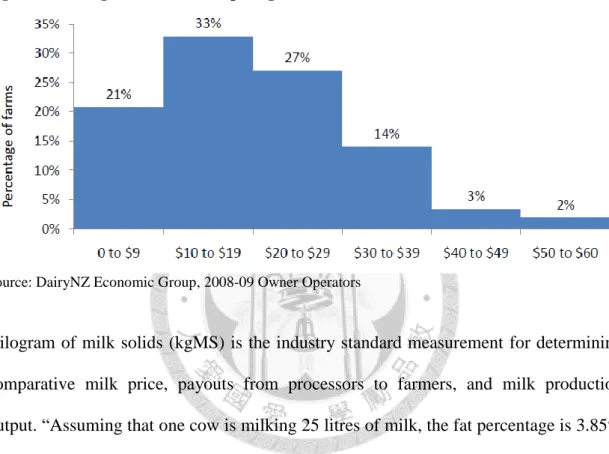
economy in general because of a reduction in discretionary spending power. As New Zealand’s top export earner these concerns are critically important. Figure 5 indicates that nearly one-third of dairy farmers’ income will be used to service interest borrowing costs of the 19% of farmers with debt in excess of $30/kgMS.
Figure 5: Closing Term Liabilities per kgMS
Source: DairyNZ Economic Group, 2008-09 Owner Operators
Kilogram of milk solids (kgMS) is the industry standard measurement for determining comparative milk price, payouts from processors to farmers, and milk production output. “Assuming that one cow is milking 25 litres of milk, the fat percentage is 3.85%
and protein is 3.45%. To convert to milk solids, the first step is to convert the litres of milk to kg. The multiplier 1.03 converts litres to kilograms. The example demonstrates that 25 litres x 1.03 equals 25.75kg of milk (5.5 gallons). The next step is to add the fat and protein percentages, i.e. 3.85 + 3.45 = 7.3% solids. Therefore, the fat and protein content of the milk is 7.3% of 25.75kg/day or 1.8kg of milk solids per cow per day”
(Kennedy, 2010). One mechanism of determining the return of capital investment in dairy farm land is to calculate how much milk solids per hectare can be produced, rather than focus on milk per cow. This is achieved by multiplying the stock rate (i.e. three
cows per hectare) by the milk solids per cow. “On average, New Zealand dairy cows produce 3,800 litres per head, which is equal to 10.4 litres of milk per cow per day” (Go Dairy, 2012). The following calculation shows the total milk solids per hectare that a typical New Zealand dairy farm produces. “The average size of a New Zealand dairy farm is 172.2 hectares” (Land Information New Zealand, 2012).
Step 1: 10.4 litres x 1.03 kg = 10.7 kg of milk
Step 2: 10.7 x (3.85 + 3.45) 7.3% = 0.8 kgMS/cow/day (292 kgMS/year) Step 3: 3 cows x 0.8 kgMS = 2.4 kg MS/hectare/cow/day (876 kgMS/year) Step 4: 876 kgMS x 172.2 = 150,847 kgMS
This means the average annual production from an average size dairy farm herd is 150,847kg of milk solids, per hectare (876kg) and per cow (292kg). “Fonterra is revising its milk payout forecast range for the 2012-13 season down 30 cents, to
$5.25/kgMS from $5.50/kg. That means $500 million less for the New Zealand economy than predicted for this dairy season. The opening season forecast was $5.65 -
$5.75 before retentions for a fully shared-up farmer. Westland Milk Products also downgraded its payout forecast earlier this month. The West Coast co-operative is now forecasting a $5.00 - $5.40/kgMS payout instead of a budgeted $5.70 - $6.10. Given farm working expenses before interest and tax were around $4.20/kgMS, Fonterra’s key milk price forecast of $5.25/kgMS leaves little or no free room” (Fox, 2012). For example, using these calculations a typical dairy farmer is left in the following financial position.
Statement of Income Revenue
Sales Revenue – Fonterra $791,946
150,847kg/MS x $5.25/kg
Operating Expenses
COGS, SG&A, Depreciation etc. $633,557
150,847kg/MS x $4.20/kg
Earnings Before Income and Taxes (EBIT) $158,389
Europe’s debt problems continue to affect milk prices for New Zealand farmers. “The final milk price for 2010-11 was $7.60/kgMS with a dividend of $0.65 per share before retentions. Fonterra’s 2011-12 final payout to farmers was $6.40/kgMS, down 19% on the previous year, with the high New Zealand dollar and increased production by other countries having eroded global market returns. This comprised a farm-gate payout of
$6.08/kg for milk solids (down from $7.60 last year) and a $0.32 dividend per share.
New Zealand milk output rose to a record of nearly 1.5 billion kilograms or 11% on the previous year, and Fonterra reported a profit of $642 million for the year to July, despite one-off tax credits of $202 million” (Executive News, 2012).
Some of the smaller dairy co-operatives competing against Fonterra are beginning to make in-roads on increasing production output and farm-gate payouts. “Small Waikato dairy co-operative Tatua has reported a near doubling of profit to $200 million and announced a payout to farmers of $8.00/kgmMS, far above Fonterra’s $6.40 /kgMS”
(Executive News, 2012). Turning to farm ownership affordability, Figure 6 shows that the median sale price for dairy farms as at June 2011 was $30,000 per hectare, considerably lower since the height of around $42,000 in June 2010. Farm sale prices for dairy units are still healthy with a 67% or $12,000 per hectare price difference
premium attainable for dairy farms over all other farm sales as at June 2011. The higher sales price for dairy farms reflects the importance of this industry to the economy.
Figure 6: Farm Sales, Median Price
Source: ANZ, National Bank, REINZ
“Fonterra, New Zealand’s largest co-operative with 10,500 farmer-shareholders, confidently predicts that the Chinese dairy market will treble over the next decade. The dairying regions of Canterbury, Otago and Southland, are growing by as much as 5% a year. In July 2010, China’s Bright Dairy invested $82 million in Canterbury’s Synlait Milk Ltd to expand its milk-processing plant. Fonterra will build a $150 million milk powder plant at Darfield in Canterbury to meet additional future milk volumes” (NZ Listener, 2010). With these factors taken into consideration, a focus of this study will be on exploring how this energy-intensive business can find ways to develop and introduce energy savings tools to reduce
costs and GHG emissions. New initiatives are underway, for example in 2010 a pilot Dairy Energy Action Programme from Fonterra, the Energy Efficiency and Conservation Authority (EECA) and the Ministry of Agriculture and Forestry (MAF) launched a pilot programme over 150 dairy farms, which included an energy audit with the aim of
helping farmers cut their energy spend by at least 10%. This would be worth around
$16 million annually if achieved throughout the sector. “Dairy farms account for nearly 2.5% of the country’s electricity use, with the average dairy farm consuming
Figure 7: Regional Distribution of Dairy Cows 2010-11
Source: DairyNZ
88,000kWh per year (costing around $14,000). A 10% reduction in electricity use and associated CO2 emissions spread across the 150 pilot farms, would deliver annual savings of around $210,000 per year” (Rural Bulletin, 2010). The pilot programme found:
Dairy farmers could save 16% on power consumption and cost-effective annual energy savings of at least 68.4mkWh in the dairy shed.
The average farm milking operation, including irrigation, in the sample used 112,100kWh of electricity in the 2009/10 season.
Water heating accounted for 24% of consumption, water pumping 22%, refrigeration 17% and vacuum pumps 15%.
Over 70% of savings opportunities relate to water heating and EECA is now looking at how electricity efficiency can be enhanced, primarily by heat recovery technology.
Farmers in the pilot have been quick to take up savings ideas with 23% already adopting at least one recommendation delivering at least 161,000kWh of total annual savings.
With 42% of participants reporting they will probably adopt recommendations over the next three years, savings from the audits could rise to 297,000kWh.
Audits contracted individually can cost between $1,500 and $2,000 so Fonterra is looking at achieving economies of scale by clustering audits in districts to save travel time and costs.
A post-pilot survey showed 46% of farmers will adopt savings technologies if their costs can be recouped within three years (NZ Energy & Environment Business Week, 2012).
“Energy efficiency usually comes with a very attractive payback. Typically, every dollar invested in an energy audit brings a return of $7.50 in savings” (New Zealand Management, 2011). “What is given by the land should return to the land” is a well- known proverb about showing mutual respect for the land and what it has to offer all living beings. In return, those who reap a living from the land have an obligation to return something to the land and leave it in the same or better condition than when they took control of it. It is encouraging that the dairy sector is beginning to take environmental and sustainable dairy practices seriously by improving energy performance. Fuel cell technology may go some way to help the industry achieve a reduction in operating costs through improved energy efficiencies, a corresponding reduction in CO2 emissions, and increased stability to energy costs.
2.3 Energy Industry
According to the Ministry of Economic Development, in 2011, 77% of New Zealand’s electricity generation came from renewable sources (Energy Data File, 2012). This is the second highest ranking for countries in the OECD for the contribution that renewable energy makes to electricity. Natural gas has a more favourable impact on the environment than coal and for the New Zealand dairy industry there are advantages in substituting natural gas for coal when it can reduce the level of CO2 emissions by between 40% and 60% depending largely on factors such as age and efficiency of coal units. There have been recent breakthroughs in natural gas extraction which underline changes and a shift away from New Zealand’s reliance on oil and coal extraction to cheaper and relatively clean sources like natural gas to power economic growth and improve living standards.
It will be imperative for governments to develop long-term initiatives together with industry leaders to ensure the sustainability and reduction in carbon emissions over the next 20 to 40 years. New technologies particularly associated with gas extraction have been receiving a great deal of attention in recent times. Hydraulic fracturing or
“fracking” for example, involves the release and extraction of natural gas from shale rock deep below the ground. This is achieved through a process of fracturing the shale rock by drilling and injecting a combination of water, quartz sand, and chemicals into the ground at high pressure. The associated pressure build-up causes natural gas to flow into the well through a series of fissures or cracks in the shale rock. In some respects the ability to obtain natural gas from shale rock has undermined the case for renewable energy as a source for electricity. But this practice is not without its critics. Likewise coal seam gas (CSG) which is methane gas found in coal seams, is another controversial area that the coal industry is exploring as a means of utilizing to counter the effects of peak oil.
Dr M King Hubbert, a renowned geophysicist and expert in the field of estimating energy resources, accurately predicted in 1956 that United States oil production would peak in the early 1970’s. Around 1980 the world began to produce more oil than what was being discovered. Today, about four barrels of oil are consumed for every one barrel that is found. With the help of Hubbert’s peak model and other methodologies, it is predicted that world oil and liquid gas will peak around 2030 (http://en.wikipedia.org/wiki/Peak_oil). According to the World Energy Outlook of 2010, the International Energy Agency (IEA) stated that conventional crude oil production “never regains its all-time peak of 70 million barrels per day reached in
2006” (http://www.energybulletin.net) Oil producing countries already in decline include the United States (1970), Indonesia (1997), Australia (2000), United Kingdom (1999), Norway (2001), and Mexico (2004). An interesting debate about such developments as tapping shale deposits and CSG exploration has been taking place in recent months. “One argument is that the environmental movement is really less concerned with immediate environmental impacts and more concerned about fracking (and deep-sea oil extraction) sounding the death-knell on the “peak oil” theory. In other words, if lobbying and scare tactics can keep major new oil and gas sources in the ground, then peak oil might just come true” (NZ Energy & Environment Business Week, 2012). It could be argued that this is a rather cynical view that plays into the hands of oil and gas multinationals bent on promoting fossil fuel development over wind and solar. All stakeholders in the energy industry, including governments, must step back and consider the role that the public and private sector have in creating a level playing field for developing a sustainable and secure low carbon energy future. Most would agree an element of initial start-up support by governments for new technologies is a good way to create confidence and attract private sector investors in new energy initiatives that would otherwise not occur.
But after they become profitable and support is no longer necessary, the question is whether governments that continue to subsidize fossil fuels and renewable energy development simply create a false reality and delay the real task of addressing energy reform? Alongside the tax breaks to big oil companies over many decades, agricultural lobby groups also share an element of responsibility through their promotion, for example, of multi-billion dollar subsidies for corn ethanol.
“Corn ethanol generated more carbon dioxide than gasoline after taking into account the emissions caused when new land was cleared to replace the food lost to fuel production”
(The New York Times, 2012). The fluidity of global trade patterns, increased reliance on bilateral and regional trade agreements around the world, and changing forms of energy use created by a combination of supply and demand constraints is bringing about important discourse on the future of energy. In the United Kingdom, the energy secretary, Ed Davey, published a draft bill setting out the framework for investment in new power stations. Central to Mr Davey’s plan is a regime that involves the state setting minimum prices for power generated from different sources. “The idea is to let the government set the power mix – so much to come from renewables; so much from nuclear and gas and so on – and hence achieve its overall desire for more electricity to come from cleaner technologies” (Financial Times, July 2012). George Osborne, Chancellor of the Exchequer wants to cut incentives for renewables. Mr Osborne believes wind could crowd out future investment in gas-fired stations and saddle the consumer with excessive costs.
Such debates are proceeding in New Zealand with a similar point of reference. The Tiwai Point aluminium smelter near Invercargill at the bottom of the South Island, for example, “employs nearly 1,000 workers and uses one-seventh (14.29%) of New Zealand’s electricity to produce more than 250,000 tonnes of aluminium annually” (The National Business Review, 2012). Analysts say that if it closes or greatly reduces its power usage, national power prices will fall significantly, impacting on the value of the three state-owned energy companies (including Meridian its electricity supplier) scheduled for partial privatization in early 2013.
“Trade unions and Southland community leaders have called on the government to step in as owner of Meridian and enable the smelter to keep operating at full capacity”
(Executive News Service, September 2012). Rio Tinto owns 79% of the Tiwai Point aluminium smelter (the balance is owned by Sumitomo Chemical) and must honour its current power price contract without distorting the electricity supply market to benefit its own commercial gains at the expense of taxpayer funded incentives. In the energy sector it could be argued that venture capital should remain the responsibility of the private not public sector and the folly of governments that view their responsibilities in this role exacerbate delays in addressing necessary regulations on carbon and air pollution. Comparable with the debate underway in the UK, incentives in the form of tax breaks and other subsidies result in long-term additional costs for consumers and a distortion of actual costs relative to the actual value provided by some technologies. If governments concentrate on setting the benchmark on reducing GHG emissions then it should follow that the market will develop the best clean or renewable technology to shoulder the electricity load.
2.4 International Legislation
Energy activities are governed by country specific laws and international legislation, treaties, and protocols. There is little point in the New Zealand Government enacting legislation to reduce GHG emissions if it does not align with general international law applicable to energy and natural resource activities, including nation sovereignty over natural resources and sustainable development. Today the world is faced with a number of conflicting views on climate change which is exacerbated by a vacuum or limited means of measuring the effects that human activity has on the environment. A carbon
footprint has historically been defined by the UK Carbon Trust as “the total set of GHG emissions caused by an organization, event, product or person”
(http://www.ukcarbontrust.
com).Carbon footprint has also been described as the total amount of GHG emissions associated with a product, along its supply chain, and sometimes includes emissions from consumption, end-of-life recovery and disposal. It is
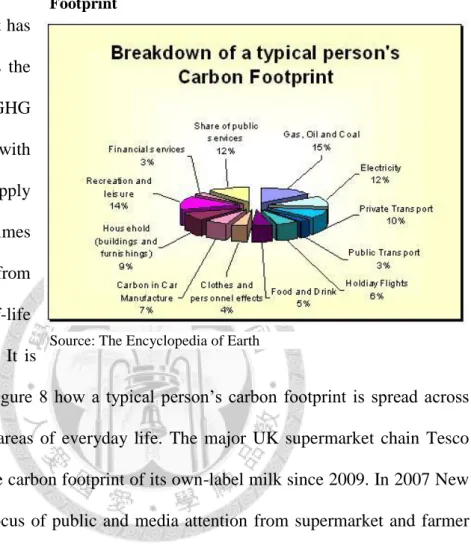
interesting to see in Figure 8 how a typical person’s carbon footprint is spread across various activities and areas of everyday life. The major UK supermarket chain Tesco has been displaying the carbon footprint of its own-label milk since 2009. In 2007 New Zealand became the focus of public and media attention from supermarket and farmer interests in the UK because of the carbon footprint of New Zealand food products that the country exports to the UK and Europe. “Dr Caroline Saunders, Lincoln University professor of trade and environmental economics, was instrumental in 2007 in proving New Zealand lamb had significantly less carbon output in its production and delivery than UK lamb, despite its distance to market.” (Rennie, 2012). The term “food miles” or how far food has travelled to reach consumer markets became a major focus. However, other factors such as water and fertilizer use, harvesting techniques, renewable energy application, and mode of transport should be included in the calculation of a product’s
Source: The Encyclopedia of Earth
Figure 8: Breakdown of a Typical Person’s Carbon Footprint
carbon footprint. The Lincoln University scientists found that “lamb raised on New Zealand’s clover-choked pastures and shipped 11,000 miles by boat to Britain produced 1,520 pounds of carbon dioxide emissions per ton while British lamb produced 6,280 pounds of carbon dioxide per ton, in part because poorer British pastures force farmers to use feed. Similar figures were found for dairy products.” (McWilliams, 2007).
Some key fundamentals on the international stage to deal with GHG emissions and climate change include the United Nations Framework Convention on Climate Change (UNFCCC) which is an international environmental treaty that came about at the UN Earth Summit in Rio de Janeiro in June 1992. From the UNFCCC came the Kyoto Protocol in 1997 which established legally binding obligations for developed countries to reduce their GHG emissions. New Zealand has been at the forefront of international legislation in a number of areas, particularly governing Antarctica. For example, the Antarctica (Environmental Protection) Act 1994, is a piece of New Zealand legislation that provides for the comprehensive protection of the Antarctic environment and to recognize Antarctica as a natural reserve devoted to peace and science and to implement the Protocol on Environmental Protection to the Antarctic Treaty. New Zealand is conscious of the Energy Charter Treaty (ECT), a multilateral treaty in the energy sector, which came into force in April 1998. It provides a legally binding set of rules for international energy investments and trade. The ECT was signed by New Zealand, Australia, United States, Canada and Japan in December 1991, together with 47 other nations, consisting of most western and eastern European countries. In 1994 agreement was reached on the terms to turn it into a binding treaty, but New Zealand pulled out of negotiations after they became protracted and it was no longer felt applicable to