國立臺灣大學電機資訊學院生醫電子與資訊學研究所 碩士論文
Graduate Institute of Biomedical Electronics and Bioinformatics College of Electrical Engineering and Computer Science
National Taiwan University Master Thesis
微型核醣核酸在乳癌所調控的蛋白質交互作用網路及其功能 MicroRNA-regulated protein-protein interaction networks and
their functions in breast cancer
李佳憲 Chia-Hsien Lee
指導教授: 阮雪芬 博士 歐陽彥正 博士
Advisor: Hsueh-Fen Juan, Ph.D.
Yen-Jen Oyang, Ph.D.
中華民國 101 年 6 月
June, 2012
誌謝 誌謝 誌謝 誌謝
經過了兩年的時間,在許多人的幫助下,終於完成了這篇論文。雖然有句話 說「要感謝的人太多,就謝天吧」,但我認為這樣做對不起那些努力幫助過我的人 們。
能夠完成這篇論文,首先必須感謝我的指導老師阮雪芬老師、歐陽彥正老師,
以及陽明大學生物醫學資訊研究所的黃宣誠老師。阮老師和黃老師帶領我進入生 物資訊的世界,並在整個實驗方向,從資料分析、結果判讀以及最後的圖表呈現,
都給予了許多珍貴的建議,並且提供了經濟上的幫助,讓我能夠無後顧之憂地完 成這個研究。歐陽老師則給了我許多統計的基礎,並幫助我加強本論文的架構。
此外,除了我的指導教授外,也感謝台大生機系的陳倩瑜老師,以及中研院資訊 科學研究所的蔡懷寬老師在百忙中抽空審閱我的論文,給我意見,並且參加我的 口試,以及給予我論文口試時口頭報告上的建議;以及臺大醫院的郭文宏醫師,
他提供了一組有趣的病人的基因與微型核糖核酸表現資料,並參與了資料分析的 討論。如果沒有這些師長的幫忙,這篇論文就無法被完成。
我還要感謝我的實驗室夥伴在我從大三進來這個實驗室開始到現在的陪伴以 及幫助。在這段期間,要感謝翠琴和心儀學姊一開始帶我做實驗,並且(和阮老師 一起)讓我明白自己沒有那麼適合做實驗,進而走向生物資訊的道路。也感謝振慶 和卓逸學長在這個研究流程中的實作方面給我的許多建議。在和他們討論的過程 中,我學到了許多的資料處理方法,還有許多要注意的細節。此外也感謝實驗室 其他所有的同仁在這段時間中給我帶來的歡樂時光。
最後,要感謝這一路上支持我的人們。首先是我的家人:父母親、弟弟、還 有我的兩隻可愛的寵物龜。沒有他們的經濟以及精神上的支持,我應該沒有辦法 走到這一步。接著,要感謝自由軟體運動的發起人理查‧史托曼先生(Richard M.
Stallman)。沒有他和他的自由軟體運動,就沒有在本研究中使用到的許多優秀的好 軟體(Python, R 等),也會讓我少掉一項重要有趣的休閒活動並失去 GNU/Linux 的 陪伴。最後,要特別感謝花澤香菜(Kana Hanazawa)小姐(日本配音員、歌手):她 甜美的聲音支持著我,讓我得以度過每一個難熬又可怕的挫折。
謹將這個論文獻給支持我或是讓我看見夢想的人們。
中文摘要 中文摘要 中文摘要 中文摘要
微型核醣核酸是一種被發現和許多種的癌症有關連性的內生性基因調節分 子。有些微型核醣核酸會調控和癌症功能相關的基因,包括細胞凋亡、細胞新生、
抑制癌症或是導致癌症產生。乳癌對於全世界的女性而言是一個主要的健康威 脅。有許多的微型核醣核酸被報導與乳癌的癌化及進程有關,本研究主要在探討 並試圖尋找新的與乳癌相關的微型核醣核酸。
首先,我們把微型核醣核酸的目標預測資料庫與微型核糖核酸、訊息核糖核 酸的表現資訊整合在一起,以找出具信心的微型核醣核酸─目標配對。由於我們 把實際在乳癌與正常組織中的表現資訊考慮進去,我們得以降低偽陽性,並且取 得與乳癌功能相關的微型核醣核酸─目標配對。接著,我們利用具信心的微型核 醣核酸─目標配對,以及在 HPRD 中已知的蛋白質交互作用資料來建立微型核醣 核酸與其調控的蛋白質交互作用網路。最後,我們利用功能性分析來找出微型核 糖核酸與其調控的蛋白質交互作用網路所擁有的功能。
從我們的結果看來,我們除了找到了 miR-125a、miR-125b、miR-21 以及 miR-497 這些之前已知和乳癌相關的微型核糖核酸,也找到有些以前未曾報告過與 乳癌相關的微型核糖核酸,例如 miR-139 和 miR-383;同時,我們也試著在這篇研 究中推測它們的功能。我們更利用其他表現量資料跑 ROC 曲線分析,使用 GOBO 做存活率分析,以及文獻搜尋來驗證我們的結果。我們的結果可能可以替未來的 乳癌相關的微型核糖核酸的研究提供一些新的線索。
關鍵字關鍵字
關鍵字關鍵字:微型核醣核酸, 乳癌, 蛋白質交互作用網路, 功能性分析
ABSTRACT
MicroRNAs, small endogenous RNA regulators, were found to be related to various types of cancer. Some of the miRNAs which target some tumor related genes, including apoptosis and cell proliferation, were confirmed to be tumor suppressors or oncomirs. Breast cancer is a major health threat for women worldwide. Many miRNAs were reported to be associated to the progression and carcinogenesis of breast cancer. In this work, we tried to elucidate and discover novel breast cancer related miRNAs.
First, we find confident miRNA-target pairs by combining miRNA target prediction databases and expression profiles of miRNA and mRNA. By considering actual expression profiles in normal and breast tumor samples, we may reduce false positives while obtaining the miRNA-target pairs relevant to breast cancer.
miRNA-regulated PINs were then constructed with the confident pairs and known interaction data in HPRD. Finally, the functions of miRNA-regulated PINs were then elucidated by functional enrichment analysis.
From the result, we found some previously known breast cancer-related miRNAs and functions of the PIN, like miR-125b, miR-125a, miR-21, and miR-497. Some miRNAs without known association to breast cancer were also found, and the putative functions of their PINs were also elucidated. Such novel miRNAs were miR-139 and miR-383. Furthermore, we tried to validate our result by ROC analysis using another expression profile data, GOBO survival analysis, and literature search. Our results may provide new insights for researches of breast cancer associated miRNAs.
Keywords: miRNA, breast cancer, protein interaction network, functional analysis
CONTENTS
口試委員會審定書 ...i
誌謝 ... iii
中文摘要 ... v
ABSTRACT ... vii
CONTENTS ...ix
LIST OF FIGURES ...xi
LIST OF TABLES ... xiii
Chapter 1 Introduction ... 1
1.1 Breast Cancer and miRNA ... 1
1.2 Integrated Analysis of miRNA and mRNA Expression Profiles ... 3
1.3 Specific aims ... 4
Chapter 2 Materials and Methods ... 5
2.1 Expression datasets ... 5
2.1.1 Public mRNA Microarray Data ... 5
2.1.2 Public RNA-seq miRNA data ... 6
2.1.3 miRNA array dataset obtained from clinical trial ... 7
2.2 Databases related to miRNAs ... 8
2.2.1 miRBase ... 8
2.2.2 TargetScan ... 9
2.2.3 miRanda ... 9
2.2.4 PicTar ... 9
2.3 Construction of miRNA target prediction collection from TargetScan, MiRanda and PicTar ... 10
2.4 Significance Analysis of Microarrays (SAM) ... 10
2.5 Protein-protein interaction database ... 10
2.6 Construction of miRNA-regulated protein interaction network ... 11
2.7 Gene Ontology ... 11
2.8 Hypergeometric Test and GO Enrichment Analysis ... 12
2.9 Activity analysis ... 13
2.10 ROC curve and ROC analysis ... 14
2.11 Survival analysis with GOBO ... 15
Chapter 3 Results ... 16
3.1 Differentially expressed miRNAs and mRNAs ... 16
3.2 miRNA-regulated PINs ... 16
3.3 Enriched GO Terms in the miRNA-regulated PINs ... 16
3.4 Activity of the miRNA-regulated PINs ... 17
3.5 Validation ... 18
3.5.1 ROC curve and ROC analysis on NTUH miRNA array data ... 18
3.5.2 Validation of functional analysis by GOBO ... 18
Chapter 4 Discussions ... 19
4.1 Construction of miRNA-regulated PINs ... 19
4.2 Functional analysis of miRNA-regulated PINs ... 21
Chapter 5 Conclusions ... 24
FIGURES ... 25
TABLES ... 57
REFERENCE ... 89
LIST OF FIGURES
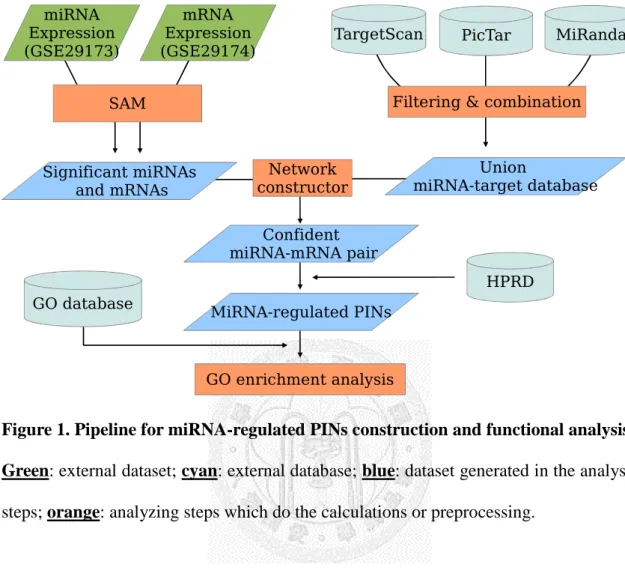
Figure 1. Pipeline for miRNA-regulated PINs construction and functional analysis. .... 25
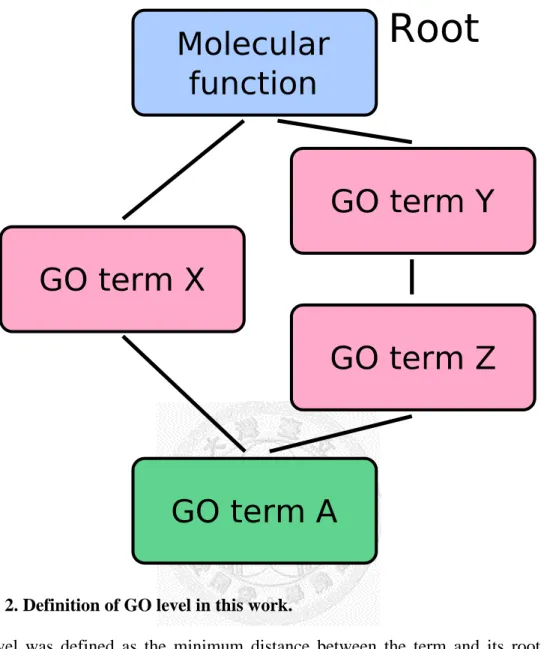
Figure 2. Definition of GO level in this work. ... 26
Figure 3. Schematic figure describing activity analysis. ... 27
Figure 4. Distribution of miRNA dataset GSE29173. ... 28
Figure 5. Distribution of gene expression dataset GSE29174. ... 29
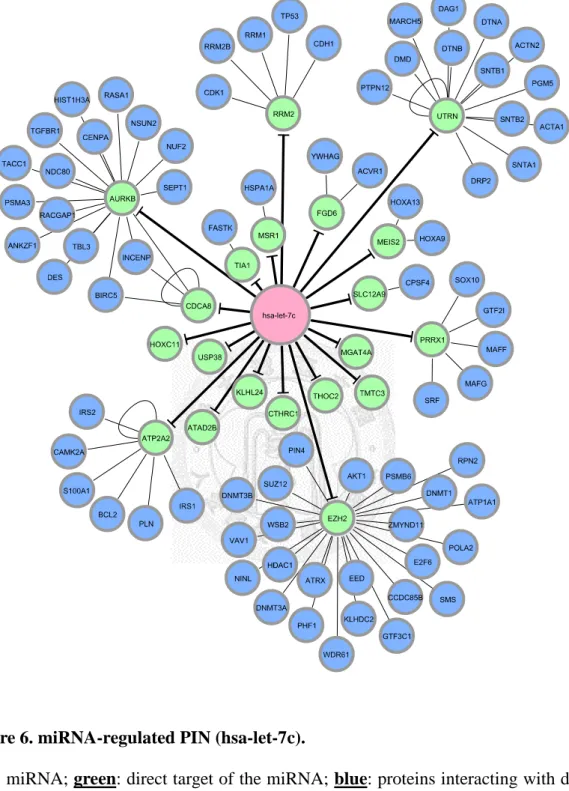
Figure 6. miRNA-regulated PIN (hsa-let-7c). ... 30
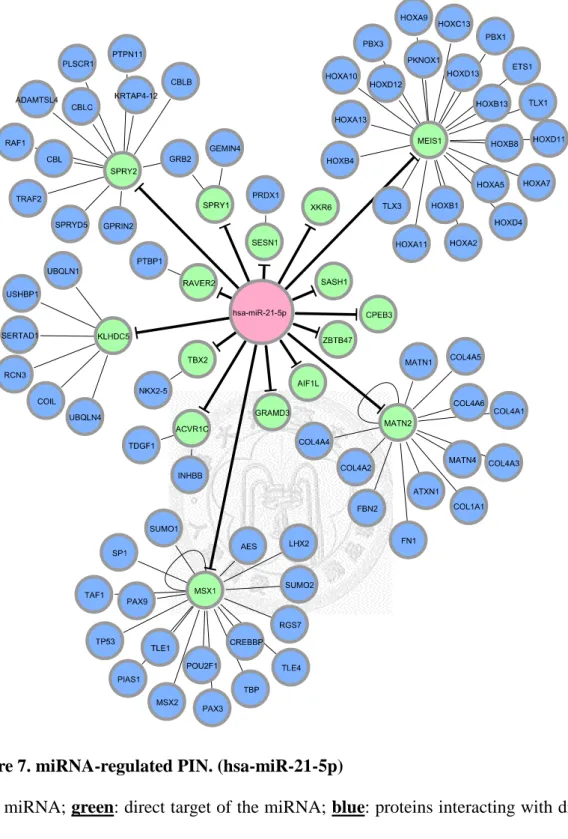
Figure 7. miRNA-regulated PIN. (hsa-miR-21-5p) ... 31
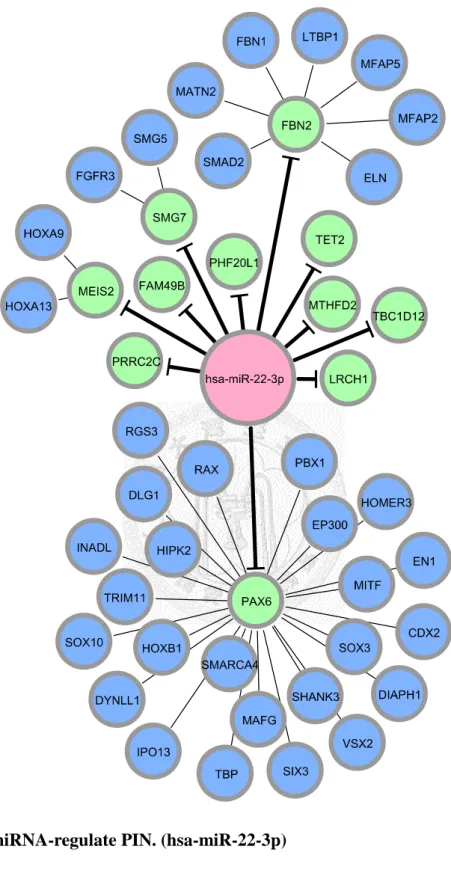
Figure 8. miRNA-regulate PIN. (hsa-miR-22-3p) ... 32
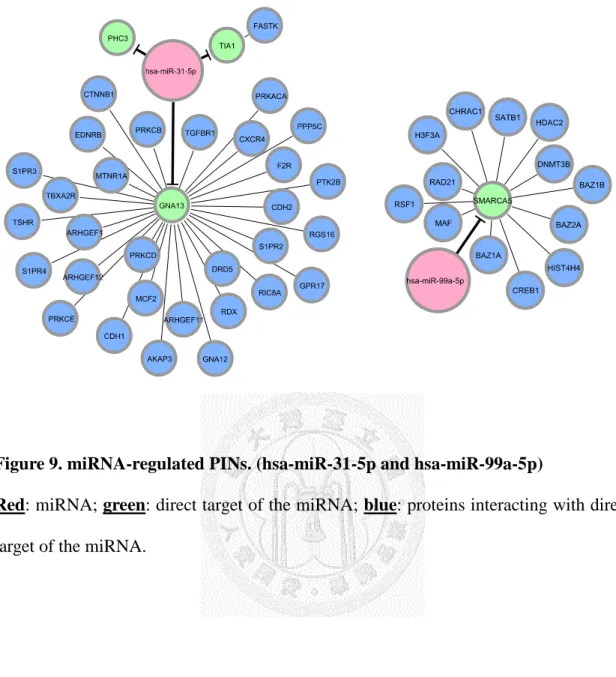
Figure 9. miRNA-regulated PINs. (hsa-miR-31-5p and hsa-miR-99a-5p) ... 33
Figure 10. miRNA-regulated PINs. (hsa-miR-100-5p and hsa-miR-139-5p) ... 34
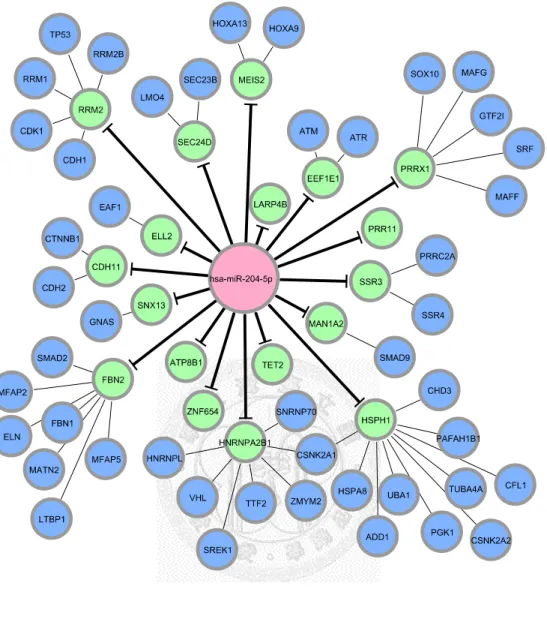
Figure 11. miRNA-regulated PIN. (hsa-204-5p) ... 35
Figure 12. miRNA-regulated PINs. (hsa-miR-214-3p, hsa-miR-215, and hsa-miR-122-5p) ... 36
Figure 13. miRNA-regulated PIN. (hsa-miR-125b-5p) ... 37
Figure 14. miRNA-regulated PIN. (hsa-miR-145-5p) ... 38
Figure 15. miRNA-regulated PIN. (hsa-miR-125a-5p) ... 39
Figure 16. miRNA-regulated PINs. (hsa-miR-383 and hsa-miR-193b-3p) ... 40
Figure 17. miRNA-regulated PIN. (hsa-miR-497-5p) ... 41
Figure 18. miRNA-regulated PIN. (hsa-miR-520d-3p) ... 42
Figure 19. Distribution of Pearson correlation coefficient of gene pairs in microarray data. ... 43
Figure 20. ROC curves and expression distribution of miRNAs. ... 44 Figure 21 GOBO Kaplan-Meier survival curve of selected gene set with significant
clinical outcome. ... 53
LIST OF TABLES
Table 1. Significantly differentially expressed miRNAs found in dataset GSE29173. ... 57
Table 2. Down-regulated genes found in dataset GSE29174. ... 58
Table 3. Up-regulated genes found in dataset GSE29174. ... 65
Table 4. Raw data count of each prediction database. ... 70
Table 5. Summary of constructed miRNA-regulated networks. ... 71
Table 6. Specific enriched GO terms of each miRNA-regulated PINs. ... 72
Table 7. P-value of activation status of each miRNA-regulated PINs. ... 83
Table 8. Result of ROC curve analysis on NTUH miRNA array data. ... 84
Table 9. GOBO survival analysis results. ... 85
Chapter 1 Introduction
1.1 Breast Cancer and miRNA
Breast cancer is a global threat to women health. According to a 2008 survey [1], breast cancer was the leading cause of cancer death in women. Currently, we know some possible risk factors, diagnostic methods and some drug and surgery procedure for treatment, but we don’t know the detail of progression of breast carcinoma, and the most important, how to cure breast cancer.
From previous researches, we knew some risk factors of breast cancer. Early menarche, late menopause, obesity, late first full pregnancy, and hormone replacement therapy were considered as high risk factors of breast cancer [2]. Breast cancer risk was also reported to be related to fat intake when red meats and high-fat dairy foods were main source of fat [3].
For diagnosis, the most widely used measures are mammography, ultrasonography, MRI (magnetic resonance imaging) and PET (positron emission tomography) [2].
Biopsy may be used to confirm the existence of malignant tissue if suspicious results are produced in the diagnosis stage. Further analysis on the tissue obtained from biopsy may point out the best methods for treatment. After breast tumor is confirmed, the patient can be treated by surgery, radiotherapy, chemotherapy, and targeting therapy, depending on the conditions of the patient.
One of the most widely used classifying methods for breast cancer is to use expression state of three biological markers: estrogen receptors (ER), progesterone receptors (PR), and HER2/neu [4]. ER and PR were hormone receptors which may be over-expressed in breast carcinoma. To treat ER positive patients, it is possible to use anti-estrogen therapy or tamoxifen, which is a selective ER modulator [5]. It was
reported that chemotherapy had better performance in ER negative patients than ER positive ones [6]. Her2/neu is a widely used prognostic and predictive marker in breast cancer. For patients with newly diagnosed breast cancer without receiving adjuvant systemic therapy, overexpression of Her2/neu is associated to bad prognosis [7]. A targeting therapy, trastuzumab, which is a Her2/neu targeting antibody, was developed for breast cancer treatment [8].
MicroRNAs (miRNAs), one of the small non-coding RNAs [9], are short endogenous nucleotides which is able to regulate gene expression. After miRNAs precursor are transcribed from the genome, or generated from spliceosomes, they are exported to cytoplasm and further processed by Dicer complex [10]. The mature miRNA would be then bound to Argonaute protein, forming a miRNA-protein complex known as miRNP or RNAi (RNA interference) enzyme complex [11, 12]. The miRNP complex was reported to be able to down-regulate target genes by translational repression [13] or mRNA cleavage [14].
Like other protein-based regulators, miRNAs were known to have important roles in cancer. Calin et al. reported that miR-15 and miR-16 were deleted in leukemia [15], which was believed to be one of the earliest report of the association of miRNA and cancer [16]. After the report, many miRNAs acting as tumor suppressor or oncogenes (which were also known as oncomirs) were found. For example, miR-21 was identified as oncomir at least in hepatocellular cancer [17], breast cancer [18], and kidney cancer [19]. Let-7c was found to be a tumor suppressor in prostate cancer [20]. miR-181a was reported as a tumor suppressor in glioma [21]. MiR-125b [22], and miR-145 [23] were known as tumor suppressors of breast cancer. Mir-125a was found to repress tumor growth in breast cancer [24]. It is thus undeniable that miRNAs play an important role in breast cancer.
1.2 Integrated Analysis of miRNA and mRNA Expression Profiles
Since miRNA functions by regulating its target genes, we may deduce the effect of a miRNA by analyzing its regulated networks. To use such a method to elucidate miRNA functions, targets of miRNAs should be deduced. Currently, predictions in most target prediction database were based on sequence and statistical methods [25]. For example, in TargetScan, seed base pairing, target site context, conservation of target site and miRNA, and site accessibility were considered in the prediction process [26].
Another way to elucidate targets of miRNAs is to integrate expression profiles of miRNA and mRNA. In the work of Huang et al. [27], they developed a Bayesian-based algorithms, GenMiR++, to predict possible targets of 104 miRNAs in human. They also verified their results by RT-PCR and microarray experiments. However, the power of other sequence-based target prediction algorithms was not utilized in their work.
It is also possible to combine sequence-based target prediction and expression-based target prediction methods. By integrating expression data into sequence-based predictions, possible false positives can be reduced. Previously, miRNA-mRNA interactions were explored with splitting-averaging Bayesian networks [28]. In that work, expression profiles of miRNA and mRNA from public databases, miRNA target prediction databases, and miRNA sequence information were integrated together to discover miRNA-mRNA interaction network.
Here, we combined expression profiles of miRNA and mRNA, and 3 target prediction databases, TargetScan, PicTar and miRanda, to obtain confident miRNA-mRNA relationships and construct miRNA-regulated protein-protein networks for breast cancer. Furthermore, we explored the functions of the miRNAs by inspecting
the underlying PINs of the miRNA with functional enrichment analysis. This method was already used previously to find functions of gastric cancer related miRNAs in the work of Tseng et al. [29]. In that research, a gastric cancer related miRNA, miR-148a, were discovered and validated to be related to tumor proliferation, invasion, migration, and survival rate of the patients. By using similar method, we wish to elucidate breast cancer related miRNA-regulated protein interaction networks (PINs) and their functions.
1.3 Specific aims
Main purposes of this work are described as follows:
1. To construct breast cancer-related miRNA-regulated protein interaction networks.
2. To elucidate the function of miRNA-regulated PINs.
3. To validate the results of the previous step by another expression profiles with clinical annotations (such as metastasis, survival).
Chapter 2 Materials and Methods
Overall workflow design was similar to the previous work of Tseng et al [29] (see
Figure 1). However, we applied the workflow on breast cancer expression profile
instead of gastric cancer in the work of Tseng et al. Additionally, we used 3 miRNA target prediction databases, TargetScan, PicTar, and miRanda here, while only TargetScan was used before.We first elucidated differentiated miRNAs and mRNAs, and combined the results with target prediction databases. By these means we can construct a miRNA-target networks consisted only genes directly regulated by the miRNA. We defined such network “miRNA-L0 network”. To extend our view, we combined interaction data from HPRD with our miRNA-L0 network and constructed miRNA-regulated PINs. We then elucidated putative functions of the miRNA-regulated PINs by GO enrichment analysis and validated our results by literature search and GOBO.
2.1 Expression datasets
2.1.1 Public mRNA Microarray Data
The mRNA expression profile used in this work for miRNA-regulated protein-protein interaction network construction is fetched from Gene Expression Omnibus (GEO, http://www.ncbi.nlm.nih.gov/geo/, ID: GSE29174). This dataset was produced by Farazi et al [30]. There are totally 161 clinical samples collected from breast cancer patients by biopsy in this dataset: 110 IDC, 11 normal, 17 DCIS, 1 mucinous A, 8 atypical medullary, 4 apocrine, 8 metaplastic, and 2 adenoid, as classified by Farazi et al. We used the 110 IDC samples as tumor group and 11 normal samples as normal group in this research. The array platform used in the dataset, NKI-CMF Homo sapiens 35k oligo array, contains 37,632 probes.
The array data was normalized with R using limma package (version 3.10.0). First, we used quantile normalization function provided by limma package. Then, we used following formula to scale the array.
) max(
) , (
) ,
( NE
g s NE
e g s
SNE =
where SNE is “scaled normalized expression”, NE is “normalized expression”. The parameter ‘s’ and ‘g’ represents “sample” and “gene” respectively.
After normalization, we transformed probe ID into gene ID. For those genes represented by multiple probes, we picked the probe with highest absolute expression value as expression of the gene. (This method was inspired by Miller et al. [31]) After these preprocessing steps, 15,560 genes were retained and would be used in the analysis step.
2.1.2 Public RNA-seq miRNA data
The miRNA expression profile used in this work was fetched from supplementary table S4A of the work of Farazi et al [30]. The table is actually the refined (by Farazi et
al.) version of GEO dataset GSE29173. Since the data in GEO is stored as
sequence-read pair, for example, sequence “CTTGACCGCTCTGACCA” has 279 reads.
It would be easier to use the refined table provided by Farazi et al. There were 189 samples in this dataset, 6 of them were from the cell line, and another 183 samples are from patient tissues. In the 183 clinical samples collected from breast cancer patients by biopsy in this dataset, there were 128 IDC, 11 normal, 18 DCIS, 1 mucinous A, 8 atypical medullary, 4 apocrine, 9 metaplastic, and 2 adenoid, as classified by Farazi et al.
We used the 128 IDC samples as tumor group and 11 normal samples as normal group in this research. “Predominant miR sequence” in supplementary table S4F of the work of Farazi et al. is used to determine miRBase accession number of the miRNAs in the
dataset.
The normalization steps used here is the same as mRNA array data described in section 2.1.1. We removed miRNAs which could not be mapped to a miRNA accession number in miRBase after normalization. There were 816 miRNAs left after all the preprocessing steps were completed.
2.1.3 miRNA array dataset obtained from clinical trial
A miRNA expression dataset generated by miRNA microarray were obtained from Dr. Wen-Hong Kuo, National Taiwan University Hospital. There were totally 15 normal samples and 101 tumor samples used in this work. All the human tissue samples collected from breast cancer patients have been approved and human subject confidentiality has been protected by the Institute Review Board (IRB, 20071211R).
Collected samples were sent to Welgene for RNA extraction and miRNA array experiments, describes below.
For RNA extraction, total RNA was extracted from tissues collected from the patients by Trizol® Reagent (Invitrogen, USA) according to the instruction mannual.
RNA purified was quantified at OD260nm by using a ND-1000 spectrophotometer (Nanodrop Technology, USA) and qualitated by using a Bioanalyzer 2100 (Agilent Technology, USA) with RNA 6000 nano labchip kit (Agilent Technologies, USA).
After RNA extraction,
100 ng of total RNAs were dephosphorylated and labeled
with pCp-Cy3 by Agilent miRNA Complete Labeling and Hyb Kit
(Agilent Technologies, USA, microRNA Spike- In Apply). 2X hybridization buffer (AgilentTechnologies, USA) was added to the labeled mixture to a final volume of 45 µl. The
mixture was heated for 5 min at 100°C and immediately cooled to 0°C. Each 45 µl
sample was hybridized onto an Agilent human miRNA Microarray Release 12.0, 8x15K
(Agilent Technologies, USA) at 55°C for 20 hours. After hybridization, slides were washed for 5 min in Gene Expression Wash Buffer 1 at room temperature, then for 5 min in Gene Expression Wash Buffer 2 at 37°C. Slides were scanned on an Agilent microarray scanner (Agilent Technologies, model G2505C) at 100% and 5% sensitivity settings. Feature Extraction (Agilent Technologies) software version 10.7.3.1 was used for image analysis.
To preprocess the dataset, we first extracted the expression value from original data provided by Welgene. In the data provided by Welgene, there were 2 columns, called gTotalGeneSignal (expression value) and gIsGeneDetected (is the gene actually being detected?). We utilized them by setting gTotalGeneSignal to 0.1 (minimum value of all expression data) while gIsGeneDetected is 0 (i.e. not detected). After the initial table were extracted by the steps above, we preprocess (i.e. normalizing and scaling) the data by the steps described in section 2.1.1. This dataset would be called NTUH miRNA array data from now on.
2.2 Databases related to miRNAs 2.2.1 miRBase
In this work, miRBase [32], containing information of miRNA names, accession number, sequence, and related citations, was used to provide a reference ID (miRBase accession number). If the miRNA identity used in a dataset is “miRNA name”, it should be converted, according to mature.fa data file, which contains name, accession number, and sequence of a miRNA, of miRBase data, to miRBase accession number before using it in the analysis pipeline. After all analysis was done, miRBase can also be used to convert miRBase accession number back to human-readable miRNA name.
2.2.2 TargetScan
TargetScan v6.0 [26, 33, 34] was one of the three miRNA target prediction databases used for miRNA target prediction collection in this work. There are totally 4,305,160 miRNA-target gene pairs in this database.
Two types of conservation were defined in TargetScan: conserved miRNA and conserved sites. To determine if a miRNA is conserved or not, we used “miR Family”
table of TargetScan database. To determine if a target site is conserved, we used
“Conserved site context+ scores” and “Nonconserved site context+ scores”.
2.2.3 miRanda
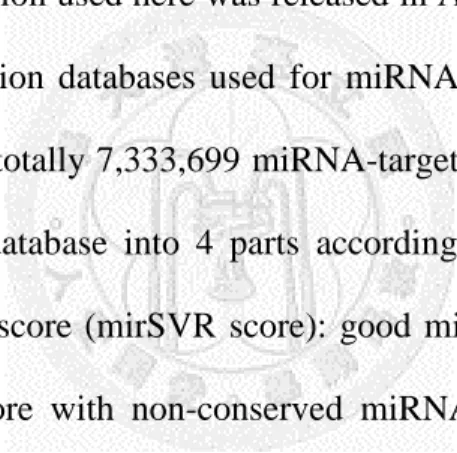
miRanda [35] (the version used here was released in August, 2010) was one of the three miRNA target prediction databases used for miRNA target prediction collection here. For human, there are totally 7,333,699 miRNA-target gene pairs in this database.
The author separated the database into 4 parts according to the conservation of the miRNA and the prediction score (mirSVR score): good mirSVR score with conserved miRNA, good mirSVR score with non-conserved miRNA, non-good mirSVR score with conserved miRNA, and non-good mirSVR score with non-conserved miRNA.
2.2.4 PicTar
PicTar [36, 37] was one of the three miRNA target prediction databases used for miRNA target prediction collection here. PicTar data table, which was built upon reference genome hg17 and arranged as a data track in UCSC genome browser, was downloaded from UCSC genome browser, and of PicTar 5sp and 4sp, PicTar 5sp were used in this work. There are totally 56,058 miRNA-target gene pairs in PicTar 5sp. The
“sp” in PicTar 5sp means “species”. In PicTar 5sp, conservation among five vertebrates, human, mouse, rat, dog, and chicken, were considered when building the database. We
used only ‘name’ column in downloaded PicTar 5sp data, since it contains NCBI accession number of target mRNA and miRNA name.
2.3 Construction of miRNA target prediction collection from TargetScan, MiRanda and PicTar
First, we applied different filters for each database. For TargetScan, we used miRNA-target gene pairs whose target site and miRNA were both conserved. For MiRanda, we used miRNA-target gene pairs marked as “high score and conserved miRNA” (which was classified by miRanda authors). For PicTar, we used all data included in the 5sp dataset. After we processed each of the target prediction databases, we combined them by selecting the miRNA-target gene pairs which were in 2 of 3 target prediction databases and removing the rest of the pairs.
2.4 Significance Analysis of Microarrays (SAM)
To get a list of differentially expressed genes and miRNAs between normal and tumor group, we used significance analysis of microarrays (SAM) [38] implemented in R package samr (version 2.0). We set FDR <= 0.0001%, fold change >= 2.5 for miRNA, and fold change >= 1.9 for genes as thresholds to reduce false positives. If one gene / miRNA were expressed higher in normal group than in tumor group, we defined that gene / miRNA as a down-regulated gene / miRNA, and vice versa.
2.5 Protein-protein interaction database
We used Human Protein Reference Database (HPRD) release 9 [39], which contains known protein-protein interaction data obtained by experimental methods and related citations, in the miRNA-regulated protein-protein interaction network construction process. There are 39,240 raw data, 38,923 irredundant interactions in this
database.
2.6 Construction of miRNA-regulated protein interaction network
To construct miRNA-regulated protein interaction networks (miRNA-regulated PINs), we combined expression profiles of miRNA and mRNA, and miRNA-target gene pairs provided by miRNA target prediction collection (method of collection construction was described in section 2.3). First, we picked significant miRNAs and genes with reverse trends and made them form miRNA-gene pairs (for example, down-regulated gene would be paired with up-regulated miRNA). Then, we removed the pairs which cannot be found in the miRNA target prediction collection. The miRNA-gene pairs left were defined as confident miRNA-gene pairs. By these confident miRNA-gene pairs, we could construct miRNA-regulated L0 PINs. L0 genes were thus defined by genes connected directly to the miRNAs.
Since number of direct targets of each miRNA was often small, we extended the miRNA-regulated L0 PINs by incorporating HPRD protein-protein interaction data: the interacting partners of L0 proteins were added into each miRNA-regulated PIN. Genes who were connected with L0 genes only were then defined as L1 genes.
2.7 Gene Ontology
We chose gene ontology (GO) [40] as the functional annotation used in this work.
In GO, functions of a gene were described by a set of pre-defined, hierarchical terms. To obtain the GO annotations for proteins in miRNA-regulated PINs, we downloaded NCBI gene2go database, which contains genes (in gene ID) and their associated GO terms, from its FTP site (downloaded at Jan. 16, 2012). For human (Homo sapiens, NCBI taxonomy ID 9606), there were 17,967 unique genes, 12,314 unique GOs,
203,844 irredundant annotations in this database.
2.8 Hypergeometric Test and GO Enrichment Analysis
Sometimes we wish to determine if the ratio of individuals associated with some specific attributes in a designated group was higher than background (i.e. the population) or not. In other words, we want to test if the attributes were enriched in a specific set of individuals. In such situation, we can use chi-square test, Fisher’s exact test, or hypergeometric test.
To determine if a GO term was enriched (i.e. overrepresented) in a miRNA-regulated PIN, we used hypergeometric test. P-value of hypergeometric test can be calculated by the following formula [41]:
∑
( )
−
−
m n, min
m
= i
n N
i n
m N i m
where N is number of genes in the genome, m is number of genes annotated with specific GO term in the genome, n is number of genes in the miRNA-regulated PIN, k is number of genes annotated with specific GO term in the miRNA-regulated PIN.
In our enrichment analysis, we excluded miRNA-regulated PINs whose number of genes in the network were smaller than 5. We also excluded GO terms whose level were smaller than 5 to avoid general GO terms and use more specific GO terms. Level of GO terms was defined as the minimum distance between the term and its root term. (See
Figure 2 for an example.)
Since we tested multiple GO terms on each miRNA-regulated PIN, the significance of the test should be adjusted. Here, we used the false discovery rate method developed by Benjamini et al. [42], which was also implemented and used in
BiNGO [43] for multiple test adjustment, to calculate adjusted p-value for each GO enrichment test. Adjusted p-value can be calculated as follows:
∑
= =
=
mg k m
i k adj
i
p g
k p m
1
~
1 ))
, 1 (min(
min
for i in 1 to mwhere m is number of p-values which will be adjusted. We used adjusted p-value <
0.0001 as our threshold. The adjustment was run for each network: for each network, we run the GO enrichment analysis, collected the calculated p-values, and adjusted them with the formula above.
2.9 Activity analysis
It makes sense that when a miRNA is down-regulated in cancer, proteins in the PIN regulated by that miRNA should be expressed higher and functional, and vice versa. We define such PIN as activated. The concept was shown in Figure 3. We used Pearson correlation coefficient (PCC) as an index for co-expression. We can calculate PCC of expression between 2 genes with the following formula:
∑
∑
∑
=
=
=
−
−
−
−
=
ni i n
i i n
i
i i
Y Y X
X
Y Y X X r
1 1
1
) ( ) (
) )(
(
where i represents each sample, n is number of samples, Xi and Yi are expression of each gene in sample i, and r is Pearson correlation coefficient of the 2 genes.
To determine if a miRNA-regulated PIN was activated, we considered the proportion of co-expressed PPIs in the PIN. A co-expressed PPI (CePPI) was defined as the PPI whose interactants were highly co-expressed. To define thresholds for high and low co-expression discrimination, we first plot histograms, comparing distribution of PCC of the pairs formed by all genes in the gene microarray (All PCC) and of the PPI pairs in HPRD (PPI PCC). By comparing such graph, we can obtain the PCC, defined
as threshold A, when the proportion of PPI PCC was higher than All PCC. After that, we obtained threshold B by using the minimum value of top 5% of sorted All PCC, which was sorted in descending order. Finally we defined the final threshold as threshold B when threshold B was larger than threshold A. Threshold for normal and tumor samples was determined separately.
To determine if CePPI was enriched in a miRNA-regulated PIN, we use hypergeometric test, which was described in section 2.8.
2.10 ROC curve and ROC analysis
To see if the miRNAs we found can be served as a classification marker for discriminating between normal and tumor samples, we applied ROC analysis on the miRNA array data obtained from National Taiwan University Hospital (described in section 2.1.3). ROC analysis is usually used to evaluate the efficiency of a classifier or a biological marker.
R package ROCR [44] (version 1.0.4) was used to plot the ROC curve and calculate AUC (area under curve). After we obtained AUC, methods described in the work of Hanlye and McNeil was used to calculate standard error of AUC [45], which is listed below.
( ) ( ) ( ) ( ) ( ) ( )
N A
N A
n n
Q θ n
θ + Q n
θ +
= θ AUC
= SE θ
2 2 2
1 1
1
1
− − − − −
where:
Q
1= θ 2 θQ
2= 2θ21+θ
To test if selected markers have diagnostic value, we applied a statistical test. In that test, the null hypothesis was that the AUC was smaller than or equal to as 0.5,
which means the marker was useless, since its performance was not better than random guess, and the alternative hypothesis was that the AUC was larger than 0.5. After calculating Z-score of AUC obtained from ROCR with the following formula, we can determine p-value of our hypothesis by the Z-score:
Z= AUC
0.5SE
(θ=0.5)2.11 Survival analysis with GOBO
To further validate if the PINs we found were related to cancer, we used survival analysis implemented in GOBO [46], which provides large amount of breast cancer gene expression profile collected from public databases with clinical outcome data.
GOBO is available at
http://co.bmc.lu.se/gobo. Kaplan-Meier survival analysis can be
done by using a gene set as input. To select gene set for GOBO analysis, we choose genes which were in specific miRNA-regulated network and annotated with survival-related GO terms. Survival-related terms were defined as GO terms which include “proliferation”, “death”, “apoptosis”, “signaling”, “actin”, or “microtubule” in their GO term description text. Parameter “number of groups (quantiles)” was set to 2,“censoring (years)” was set to 10, “end-point” was set to “overall survival”, and no multivariate analysis were selected. Results of survival analysis would be included in N_GOBO_GeneSetAnalysis_KaplanMeier_Pvalues.txt (where N is an arbitrary ID), which is one of downloadable data files after running GOBO. In this work, we collected the p-values of survival analysis to determine if the gene set was related to survival in another clinical data.
Chapter 3 Results
3.1 Differentially expressed miRNAs and mRNAs
To construct miRNA-regulated PINs, we should extract differentially expressed miRNAs and genes form our dataset after we properly processed our expression profiles.
We applied quantile normalization and scaling (as described in section 2.1.1) to our datasets. The distribution of normalized data can be seen in Figure 4 and Figure 5.
From our selected miRNA dataset, GSE29173, we found 89 down-regulated miRNAs (93 before filtered with fold change filter) and only 1 up-regulated miRNAs (Table 1).
In gene expression dataset GSE29174, we found totally 1,268 down-regulated genes and 587 up-regulated genes before applying fold change filter. There were 726 down-regulated genes (Table 2) and 437 up-regulated genes (Table 3) after significantly and differentially expressed genes were filtered with the fold change (fold change > 2) filter.
3.2 miRNA-regulated PINs
After we appropriately processed miRNA target prediction databases and elucidated differentially expressed miRNAs and genes, miRNA-regulated PINs could then be constructed. We identified and constructed the partial network, containing miRNA and its direct target, with the differentially expressed miRNAs and genes by the methods described in section 2.3. We then extended the network by appending known interactions in HPRD database. Finally, 18 miRNA-regulated PINs were constructed by the steps described above (see Figure 6 to Figure 18 and Table 5).
3.3 Enriched GO Terms in the miRNA-regulated PINs
To elucidate functions of a miRNA with a regulated PIN, GO enrichment analysis
was applied to the miRNA-regulated PINs. We did not consider the miRNAs with 5 or less genes in its regulated PINs, and some of the miRNA-regulated PINs have no enriched functions in this threshold (FDR < 0.0001). To exclude GO terms that were too general, we only included GO terms which level was larger than 5.
We listed the result related to cancer in Table 4. We define a GO term cancer-related if a GO term contained “cell proliferation”, “cell death”, “apoptosis”,
“signaling”, “microtubule”, and “actin”. One may notice that 7 miRNAs have enriched GO terms related to apoptosis, cell death, and cell proliferation: they are miR-520d-3p, miR-497-5p, miR-125b-5p, miR-21-5p, miR-31-5p, let-7c, and miR-125-5p. We may also find that some miRNA-regulated PINs may have functions other than cell survival.
For example, nerve growth factor receptor pathway was enriched in miR-regulated PINs of miR-520d-3p, miR-497-5p, miR-125a-5p, miR-125b-5p, and 31-5p, and epidermal growth factor receptor pathway was enriched in miR-regulated PINs of miR-520d-3p, miR-21-5p, and miR-497-5p.
3.4 Activity of the miRNA-regulated PINs
To do enrichment analysis for CePPI, we should first determine the threshold of PCC for CePPI. The distribution histograms were in Figure 19. From the figure, when PCC was larger than 0.4~0.5, the proportion of PPI PCC was larger than All Paired PCC, and when PCC was larger than 0.1~0.2, the proportion of PPI PCC was larger than All Paired PCC. To actually determine the threshold, we need to elucidate the minimum of top 5% PCCs. From the distribution of All Paired PCC, the minimum of top 5% PCCs was 0.69522 for normal samples, and 0.2788 for tumor samples. Since 0.69522 is larger than 0.5 for normal samples, and 0.2788 is larger than 0.2 for tumor samples, we set 0.69522 as threshold for normal CePPI, and 0.2788 for tumor CePPI.
After thresholds were determined, we conduct the CePPI enrichment analysis. The p-values of activation status were shown in Table 7. From Table 7, we found that 7/18 of the miRNA-regulated PINs was activated in normal, while 3/18 of the PINs was activated in tumor.
3.5 Validation
3.5.1 ROC curve and ROC analysis on NTUH miRNA array data
We used ROC analysis to validate the classification efficiency when our miRNAs were selected as a biomarker (i.e. the diagnostic value of the miRNA). The result of ROC analysis, including p-value testing if AUC > 0.5, was listed in Table 8 and Figure
20. From Table 8 and Figure 20, we found that most of the miRNAs had good
performance when used as diagnostic marker.3.5.2 Validation of functional analysis by GOBO
To verify the functions found in GO enrichment analysis, we use survival analysis on the genes set which is annotated with GO terms related to cancer, such as apoptosis and cell proliferation, by GOBO. The results were in Table 9 (full list) and Figure 21 (significant part only). As one may notice from the result, most of the gene sets were not related to overall survival significantly.
Chapter 4 Discussions
4.1 Construction of miRNA-regulated PINs
Before constructing miRNA-regulated PINs, we should first find out significantly expressed genes and miRNAs. From the results of SAM analysis (Table 1), we could see some well-known breast cancer related miRNAs. For example, hsa-miR-214-3p [47]
and hsa-miR-335-5p [48] were known to be down-regulated in previous literatures.
Hsa-let-7c, one of let-7 families [49], was found to be down-regulated in previous work.
We also found that miR-21-5p, the sole up-regulated miRNAs in our list, was also found to be up-regulated previously [18, 50]. However, most of miRNAs in our down-regulated list were not known to be changed in previous literature. Those miRNAs might be false positives, however, we could not rule out the possibility that they were novel breast cancer-related miRNAs.
The construction step relied on not only differentially expressed miRNAs and genes but also information in the target prediction databases. Also, the preprocessing step on the target prediction database would play a role in our result. Our current preprocessing parameters, using only the predictions presented in at least 2 of 3 databases, were to reduce some possible false positives in the target prediction databases. This setting would also remove some novel miRNAs, since they were too new to be included in the prediction dataset, thus not suitable for functionary discovery of novel miRNAs. However, this problem could be settled by using only the target prediction database with novel miRNAs instead of requiring that a prediction should exist in at least 2 databases.
After construction of the 18 PINs was completed (Figure 6 to Figure 18), we found that size of the PINs were not similar: some of the miRNAs seems to regulate
large size of PINs, while other miRNAs affect only small number of genes. Small miRNA-regulated PINs may be caused by the strict q-value threshold set on SAM analysis, by the processing steps performed on the target prediction databases discussed before, and possibly by lack of protein-protein interaction data of some proteins in HPRD. Although HPRD was known to be the most comprehensive source of protein-protein interaction data [51], there were some proteins not considered and researched by other investigators, and interaction data for those proteins would not be in HPRD. However, it may be true that some of the miRNA-regulated PINs did be small in breast cancer, since the construction of the PINs were based on differentially expressed miRNAs and genes between normal tissues and tumor samples, and those miRNAs with small PINs may not be as important as others with larger PINs.
We further used activity analysis to check if the miRNA-regulated PINs were activated in certain conditions. In the process of threshold determination, we found that the shape of PCC distributions were different between normal and tumor samples. This may be related to the difference of number of samples (which can affect shape of PCC distribution): we had 11 normal samples, 110 tumor samples in our microarray data (GSE29174). For those miRNAs which is down-regulated in tumor tissue, the PIN it regulates would be activated, due to the repression of the miRNAs became lower, and vice versa. However, only 3 (total 17) PINs of down-regulated miRNAs were activated in tumor. In addition, 7 (total 17) PINs of down-regulated miRNAs were activated in normal condition. This result may suggest participation of other biomolecules, such as transcription factors, which could affect the expression of the PINs, thus we could not observe PIN activation in tumor condition for down-regulated miRNAs.
4.2 Functional analysis of miRNA-regulated PINs
To elucidate functions of miRNA-regulated PINs, we conducted GO enrichment analysis on the PINs (for a list of cancer-associated enriched GO terms, see Table 6).
The first thing we noticed was the miRNA-regulated PINs enriched with apoptosis and / or cell proliferation related GO terms. Such miRNAs were miR-520d-3p, miR-497-5p, miR-125b-5p, miR-21-5p, miR-31-5p, let-7c, and miR-125-5p. Most of the miRNAs were discussed and researched before and known to be related to breast cancer.
mir-125b-5p, which was down-regulated in tumor tissue, was previously known as a tumor suppressor [22], and such finding was consistent to our functional enrichment results. mir-125a-5p-regulated PIN was found to have anti-apoptosis activity and the ability to regulate epithelial cell proliferation, and the miRNA was known to repress cell growth [52].
We also found that some breast cancer specific functions were enriched in our results. For example, in miR-497-5p-regulated PIN, function “androgen receptor signaling pathway” was enriched. Although it is not clear whether androgens were related to breast cancer, androgen receptors were known to be up-regulated in breast cancer and relate to node invasiveness [53].
To further verify the findings of enriched cancer-related functions, we used GOBO for survival analysis. Our hypothesis is that expression of genes annotated with enriched cancer-related terms may be related to survival outcome of the patients. Except some cell death / proliferation related terms, we knew that some pathways or functions are also related to clinical outcomes. For example, cell proliferation-related GO terms have high probability to affect survival of cancer tissue. The patient may become worse if cancer tissue survives. In addition, some signaling pathways were known to enhance
invasiveness, migration abilities, or even decrease the survivability of the patient. For example, BMP signaling pathway was known to confer various tumor cells with migration and invasion ability [54]. NGFR was found to be associated with overall survival of breast cancer [54]. Furthermore, Toll-like receptor 4 was known to promote adhesion and invasive migration in breast cancer [55]. Finally, cytoskeleton is an important part for every kind of cells in cell mobility. Actin filament was known to be participated in the process of invasive migration of cancer cells [56]. Since we had some of these functions in our enriched terms, we wished to test if the expression of gene set annotated to the cancer related enriched terms in the PIN would be related to clinical outcome of patients.
Our results showed in Table 9 and Figure 21. As one can see, only some of the enriched terms were associated significantly with clinical outcome. It may be that the changes of these key genes occurred on protein level, such as protein expression or post-translational modification, so association of such genes to clinical outcomes cannot be explored by tools like GOBO. It may also because the miRNA did not regulate whole pathway, or the miRNA did not target the key part of the pathway directly, thus we cannot find the clinical outcome of gene sets of the enriched GO terms in such condition.
However, we did find some functions associated with clinical outcomes. For example, enriched term “regulation of epithelial cell proliferation” of both miR-125a-5p and miR-125b-5p were found to be associated with overall 10 years survival of patients.
This result acted as evidence that further supported GO enrichment analysis and the discussion before.
Since the miRNAs of the miRNA-regulated PINs were differentially expressed between normal and tumor tissue, and we found some cancer related functions in our functional enrichment analysis, the miRNAs may be used as diagnostic marker for
breast cancer. To verify this, we applied ROC curve analysis on the miRNA expression profile which was obtained from NTU Hospital and was not used in construction process of miRNA-regulated PINs. Notably, our results showed that miR-497-5p, miR-125b-5p, along with some other miRNAs of miRNA-regulated PINs, had good performance when used as diagnostic marker. The results were not beyond our expectation, since miR-497-5p and miR-125b-5p were found to have cancer-related functions in this work and in literature (discussed before).
Chapter 5 Conclusions
In this work, we obtained confident miRNA-target pairs by combining differentially expressed miRNAs and mRNAs elucidated from expression profiles and popular target prediction databases. By incorporating known protein interaction data in HPRD and confident miRNA-target pairs, breast cancer specific miRNA-regulated networks were constructed. After network construction, putative functions of the miRNA-regulated networks were discovered by GO enrichment analysis. From the result, we found previously known miRNAs which were enriched with cancer-related terms, such as “apoptosis” and “cell proliferation”. Novel breast cancer related miRNAs and putative functions of their PINs were also discovered in our work. We also validated some of our results by ROC curve analysis, survival analysis (GOBO), and literature search. This work may contribute to further research of breast cancer and related miRNAs, since some novel miRNAs associated with breast cancer were found.
Furthermore, it is also possible to apply the method used in this work to other cancers for novel cancer-associated miRNA discovery and functional elucidation.
FIGURES
SAM
Network constructor
Filtering & combination miRNA
Expression (GSE29173)
mRNA Expression (GSE29174)
Union
miRNA-target database Significant miRNAs
and mRNAs
Confident miRNA-mRNA pair
GO enrichment analysis MiRNA-regulated PINs
HPRD GO database
TargetScan PicTar MiRanda
Figure 1. Pipeline for miRNA-regulated PINs construction and functional analysis.
Green: external dataset; cyan: external database; blue: dataset generated in the analysis
steps; orange: analyzing steps which do the calculations or preprocessing.Figure 2. Definition of GO level in this work.
GO level was defined as the minimum distance between the term and its root node.
Thus, GO level of GO term Y and term X is 1; GO level of GO term is Z; GO level of GO term A is also 2, since 2 is the minimum distance of the 2 possible paths to its root node.
Figure 3. Schematic figure describing activity analysis.
Red edge stands for co-expressed PPI. A: Co-expression means that expression of two
interacting gene are positively correlated. B: When the co-expressed interactions are enriched in a network (right part), we define it to be activated.A
B
Figure 4. Distribution of miRNA dataset GSE29173.
Each bar represents data distribution of a single sample. A: Distribution, presented in boxplot, of the original dataset. B: Distribution of the dataset after normalization steps.
A
B
Figure 5. Distribution of gene expression dataset GSE29174.
Each bar represents data distribution of a single sample. A: Distribution, presented in boxplot, of the original dataset. B: Distribution of the dataset after normalization steps.
Figure 6. miRNA-regulated PIN (hsa-let-7c).
Red: miRNA; green: direct target of the miRNA; blue: proteins interacting with direct
target of the miRNA.Figure 7. miRNA-regulated PIN. (hsa-miR-21-5p)
Red: miRNA; green: direct target of the miRNA; blue: proteins interacting with direct
target of the miRNA.Figure 8. miRNA-regulate PIN. (hsa-miR-22-3p)
Red: miRNA; green: direct target of the miRNA; blue: proteins interacting with direct
target of the miRNA.Figure 9. miRNA-regulated PINs. (hsa-miR-31-5p and hsa-miR-99a-5p)
Red: miRNA; green: direct target of the miRNA; blue: proteins interacting with direct
target of the miRNA.Figure 10. miRNA-regulated PINs. (hsa-miR-100-5p and hsa-miR-139-5p)
Red: miRNA; green: direct target of the miRNA; blue: proteins interacting with direct
target of the miRNA.Figure 11. miRNA-regulated PIN. (hsa-204-5p)
Red: miRNA; green: direct target of the miRNA; blue: proteins interacting with direct
target of the miRNA.Figure 12. miRNA-regulated PINs. (hsa-miR-214-3p, hsa-miR-215, and hsa-miR-122-5p)
Red: miRNA; green: direct target of the miRNA; blue: proteins interacting with direct
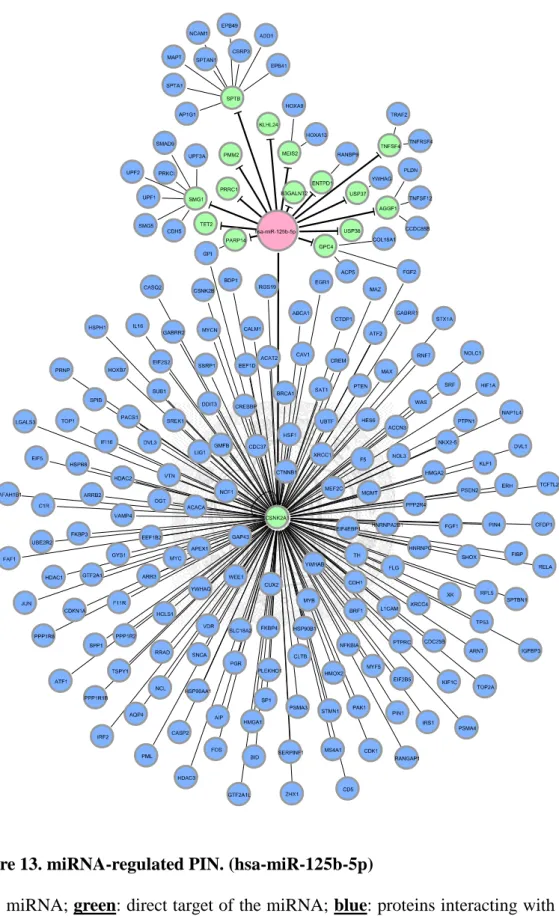
target of the miRNA.Figure 13. miRNA-regulated PIN. (hsa-miR-125b-5p)
Red: miRNA; green: direct target of the miRNA; blue: proteins interacting with direct
target of the miRNA.Figure 14. miRNA-regulated PIN. (hsa-miR-145-5p)
Red: miRNA; green: direct target of the miRNA; blue: proteins interacting with direct
target of the miRNA.Figure 15. miRNA-regulated PIN. (hsa-miR-125a-5p)
Red: miRNA; green: direct target of the miRNA; blue: proteins interacting with direct
target of the miRNA.Figure 16. miRNA-regulated PINs. (hsa-miR-383 and hsa-miR-193b-3p)
Red: miRNA; green: direct target of the miRNA; blue: proteins interacting with direct
target of the miRNA.Figure 17. miRNA-regulated PIN. (hsa-miR-497-5p)
Red: miRNA; green: direct target of the miRNA; blue: proteins interacting with direct
target of the miRNA.Figure 18. miRNA-regulated PIN. (hsa-miR-520d-3p)
Red: miRNA; green: direct target of the miRNA; blue: proteins interacting with direct
target of the miRNA.A
B
Figure 19. Distribution of Pearson correlation coefficient of gene pairs in microarray data.
Here, PCC is the expression correlation of two genes. In normal sample, from when PCC > 0.4~0.5, the proportion of PPIPaired is greater than AllPaired. In tumor samples, from when PCC > 0.1~0.2, the proportion of PPIPaired is greater than AllPaired. A:
Distribution of PCCs calculated by normal samples. B: Distribution of PCCs calculated by tumor samples. AllPaired: Distribution of PCCs of gene pairs formed by any two genes in the gene microarray. PPIPaired: Distribution of PCCs of HPRD PPIs.
A. hsa-let-7c. MIMAT0000064. ***
B. hsa-miR-21-5p. MIMAT0000076. ***
Figure 20. ROC curves and expression distribution of miRNAs.
Expression value from NTUH miRNA dataset was used for validating our results. Solid
line: actual prediction performance of the miRNA as diagnostic marker; dashed line:
AUC = 0.5 (no predictive power). *: p-value < 0.05; **: p-value < 0.01; ***: p-value <
0.001.
C. hsa-miR-22-3p. MIMAT0000077.
D. hsa-miR-31-5p. MIMAT0000089. ***
Figure 20. ROC curves and expression distribution of miRNAs. (continue)
Solid line: actual prediction performance of the miRNA as diagnostic marker; dashed line: AUC = 0.5 (no predictive power). *: p-value < 0.05; **: p-value < 0.01; ***:
p-value < 0.001.
E. hsa-miR-99a-5p. MIMAT0000097. ***
F. hsa-miR-100-5p. MIMAT0000098. ***
Figure 20. ROC curves and expression distribution of miRNAs. (continue)
Solid line: actual prediction performance of the miRNA as diagnostic marker; dashed line: AUC = 0.5 (no predictive power). *: p-value < 0.05; **: p-value < 0.01; ***:
p-value < 0.001.
G. hsa-miR-139-5p. MIMAT0000250. ***
H. hsa-miR-204-5p. MIMAT0000265. ***
Figure 20. ROC curves and expression distribution of miRNAs. (continue)
Solid line: actual prediction performance of the miRNA as diagnostic marker; dashed line: AUC = 0.5 (no predictive power). *: p-value < 0.05; **: p-value < 0.01; ***:
p-value < 0.001.
I. hsa-miR-214-3p. MIMAT0000271. *
J. hsa-miR-215. MIMAT0000272.
Figure 20. ROC curves and expression distribution of miRNAs. (continue)
Solid line: actual prediction performance of the miRNA as diagnostic marker; dashed line: AUC = 0.5 (no predictive power). *: p-value < 0.05; **: p-value < 0.01; ***:
p-value < 0.001.
K. hsa-miR-122-5p. MIMAT0000421.
L. hsa-miR-125b-5p. MIMAT0000423. ***
Figure 20. ROC curves and expression distribution of miRNAs. (continue)
Solid line: actual prediction performance of the miRNA as diagnostic marker; dashed line: AUC = 0.5 (no predictive power). *: p-value < 0.05; **: p-value < 0.01; ***:
p-value < 0.001.
M. hsa-miR-145-5p. MIMAT0000437. ***
N. hsa-miR-125a-5p. MIMAT0000443.
Figure 20. ROC curves and expression distribution of miRNAs. (continue)
Solid line: actual prediction performance of the miRNA as diagnostic marker; dashed line: AUC = 0.5 (no predictive power). *: p-value < 0.05; **: p-value < 0.01; ***:
p-value < 0.001.
O. hsa-miR-383. MIMAT0000738.
P. hsa-miR-193b-3p. MIMAT0002819.
Figure 20. ROC curves and expression distribution of miRNAs. (continue)
Solid line: actual prediction performance of the miRNA as diagnostic marker; dashed line: AUC = 0.5 (no predictive power). *: p-value < 0.05; **: p-value < 0.01; ***:
p-value < 0.001.
Q. hsa-miR-497-5p. MIMAT0002820. ***
R. hsa-miR-520d-3p. MIMAT0002856.
Figure 20. ROC curves and expression distribution of miRNAs. (continue)
Solid line: actual prediction performance of the miRNA as diagnostic marker; dashed line: AUC = 0.5 (no predictive power). *: p-value < 0.05; **: p-value < 0.01; ***:
p-value < 0.001.
MIMAT0000064 (hsa-let-7c) GO:0015630, Microtubule cytoskeleton
MIMAT0000064 (hsa-let-7c)
GO:0043069, Negative regulation of programmed cell death
MIMAT0000064 (hsa-let-7c)
GO:0060548, Negative regulation of cell death
MIMAT0000089 (hsa-miR-31-5p) GO:0006917, Induction of apoptosis
Figure 21 GOBO Kaplan-Meier survival curve of selected gene set with significant clinical outcome.
The gene set was formed by selecting genes annotated with designated GO term in the miRNA-regulated PIN. Full GOBO Kaplan-Meier survival p-value were calculated and listed in Table 9. *: p < 0.05; **: p < 0.01; ***: p < 0.001.
MIMAT0000089 (hsa-miR-31-5p)
GO:0012502, Induction of programmed cell death
MIMAT0000423 (hsa-miR-125b-5p) GO:0015630, Microtubule cytoskeleton
MIMAT0000423 (hsa-miR-125b-5p)
GO:0050678, Regulation of epithelial cell proliferation
MIMAT0000443 (hsa-miR-125a-5p) GO:0015630, Microtubule cytoskeleton
Figure 21 GOBO Kaplan-Meier survival curve of selected gene set (continue)
*: p < 0.05; **: p < 0.01; ***: p < 0.001.
MIMAT0000443 (hsa-miR-125a-5p)
GO:0050678, Regulation of epithelial cell proliferation
MIMAT0002820 (hsa-miR-497-5p)
GO:0007179, Transforming growth factor beta receptor signaling pathway
MIMAT0002856 (hsa-miR-520d-3p) GO:0015630, Microtubule cytoskeleton
MIMAT0002856 (hsa-miR-520d-3p)
GO:0048011, Nerve growth factor receptor signaling pathway
Figure 21 GOBO Kaplan-Meier survival curve of selected gene set (continue)
*: p < 0.05; **: p < 0.01; ***: p < 0.001.
MIMAT0002856 (hsa-miR-520d-3p)
GO:0051988, Regulation of attachment of spindle microtubules to kinetochore