國立臺灣大學生物資源暨農學院森林環境暨資源學系 碩士論文
School of Forestry and Resource Conservation College of Bioresources and Agriculture
National Taiwan University Master Thesis
Sound Absorption Performance of Green Walls Constructed with Wood Plastic Composites
張嵐婷 Lan-Ting Chang
指導教授:張豐丞 博士
Advisor: Feng-Cheng Chang, Ph.D.
中華民國 107 年 8 月 August, 2018
Acknowledgement
I would like to express my gratitude to my research supervisor Dr. Feng-Cheng Chang for academic guidance and financial support. Also, special thanks to Dr. Way Long and his lab for technical support and kindly providing impedance tube, Dr. Te-Hsin Yang and his lab for advice and assistance for tensile strength measurement. And for final revision of this dissertation, I appreciate Dr. Fang-Ming Lin and Dr. Chih-lung Cho for the precious suggestions.
Secondly, I would also like to thank Huan Su WPC for kindly providing specimens, and Mr. Liau for technical support. Huge thanks to Mr. Tsai (Kire flowers) for assisting with plant sources and advice. Lots of appreciations to Dr. Chao-Nan Wang, Dr. Chang and Mr. Tsai of NTU Acoustic Lab for technical instructions and consultancy. Also, thanks to Furniture Making and Wood Finishing Lab for providing Surfcorder.
Moreover, I would appreciate all the members in School of Forestry and Resource Conservation for cultivation and companion, especially Jui-Tzu for everything through seven years. Special thanks to members of Biocomp, including Jane, Dai-Yun, Albert, Candice, Peter, Tsai-Po, Hannah, Tsai, and Christy for all the help and time together. Also, gratitude to Mr. Tsao and A-Kun for the assistance of sample preparation as well.
Last but not least, I am grateful for my family’s support that allows me to achieve everything by far.
中文摘要
回收塑膠製木塑複合材料(recycled plastic based wood plastic composites, rWPCs)
被期望於取代傳統的高碳足跡材料,為了擴展rWPCs 的應用領域,考慮其具有多
孔材料的特性,因此對於其聲學性質進行研究,且考量到其機械強度,在本實驗中
將 rWPCs 作為植生牆(LWS)的支撐體,用以發展低環境影響的全頻吸音構造。首
先本實驗以阻抗管測量rWPCs 及其與常見聲學結構的吸音效果進行較小尺度的測
試,接著在迴響室中測量rWPCs 和其作為 LWS 支撐體整體結構的吸音係數,以便
了解其於實際應用上的吸音性能。結果顯示,rWPCs 在中低頻範圍內具有中等吸 音性能,其中空結構有利於輕量設計,而裝飾或功能表面紋路均有利於吸聲。另一
方面,聲學結構的研究顯示小於3cm 的空氣層和低穿孔面積(小於 1%)對於 rWPCs
吸音改善具有相當的效果。最後,以rWPCs 為支撐系統的 LWS 具有全頻範圍吸音
能力,並且考慮支撐體、植生牆設計和植生覆蓋率對於聲學性質是必要的。
關鍵字:木塑材、吸音性能、植生牆、阻抗管、餘響室
ABSTRACT
Recycled plastic based wood plastic composites (rWPCs) is expected to replace conventional high carbon foot print materials. To expand the application field of rWPCs, considering its porous structure, the acoustic properties of rWPCs have been examined.
Also, rWPCs has sufficient mechanical strength, therefore was applied as supporting system for living wall system (LWS) to create sound absorption element with low environmental impact in this study. First, the sound absorption coefficient of rWPCs and its combination with several common acoustic mountings was measured by impedance tube. Second, selected rWPCs and LWS with rWPCs integrated as supporting system were tested in reverberation room for understanding their sound absorption performance within a practical scale. It was found that rWPCs had medium sound absorption property at mid-low frequency range with its hollow structure beneficial to lighter design, while decoration or functional surface patterns were both favorable for sound absorption. On the other hand, the result of acoustic mountings suggested that air gap less than 3 cm and perforation area of less than 1% would be sufficiently effective for rWPCs sound absorption improvement. At last, LWS with rWPCs as supporting system was successful combination for full frequency range sound absorption, and for acoustic purpose, it would be necessary to take supporting system into account as well as garden module design and coverage rate.
Keywords: wood plastic composites (WPCs), sound absorption, living wall system (LWS), impedance tube, reverberation room
CONTENTS
口試委員會審定書 ... #
Acknowledgement ... i
中文摘要 ... ii
ABSTRACT ... iii
CONTENTS ... iv
LIST OF FIGURES ... vi
LIST OF TABLES ... ix
1. Introduction ... 1
2. Literature review ... 4
2.1. Acoustics for urban building environment ... 4
2.2. Wood plastic composites and its acoustic potential ... 18
2.2.1. Wood plastic Composites ... 18
2.2.2. WPCs and acoustics ... 23
2.3. Green walls and acoustic ... 26
3. Part A: Recycled material based WPCs and Acoustics ... 30
3.1. Materials and Methods ... 30
3.1.1. Materials and sample preparation ... 30
3.1.2. Sound absorption measurement ... 34
3.1.3. Surface and morphology study ... 35
3.2. Results and discussion ... 35
3.2.1. Uniformity of specimen ... 35
3.2.2. Effect of structure on sound absorption property ... 40
3.2.3. Effect of adopting acoustic methods on sound absorption property ... 42
3.2.4. Effect of surface pattern to sound absorption property ... 46
3.3. Conclusion: Part A ... 49
4. Part B: Green wall acoustics with rWPCs supporting system ... 51
4.1. Materials and Methods ... 52
4.2. Results and discussion ... 57
4.2.1. Sound absorption of various supporting systems ... 57
4.2.2. Sound absorption of LWS with rWPCs as supporting system ... 62
4.3. Conclusion: Part B ... 68
5. Summary ... 70
5.1. General conclusion ... 70
5.2. Future work ... 72
REFERENCE ... 73
LIST OF FIGURES
Fig. 1 Energy transfer of sound wave [7]. ... 6
Fig. 2 Structure of impedance tube [14] ... 8
Fig. 3 Three types of porous materials [17] ... 13
Fig. 4 Membrane (panel) absorbent [13] ... 15
Fig. 5 Perforated panel absorbent [13] ... 16
Fig. 6 Common combined acoustic mounting structure [2] ... 17
Fig. 7 SEM of WPC with (a) sufficient coupling agent and (b) insufficient PMDI coupling agent [7] ... 22
Fig. 8 rWPCs bricks with triangle hole design for acoustic purpose by Guzman and Munno [44] ... 25
Fig. 9 Garden modules in study of Davis et al. [11] ... 27
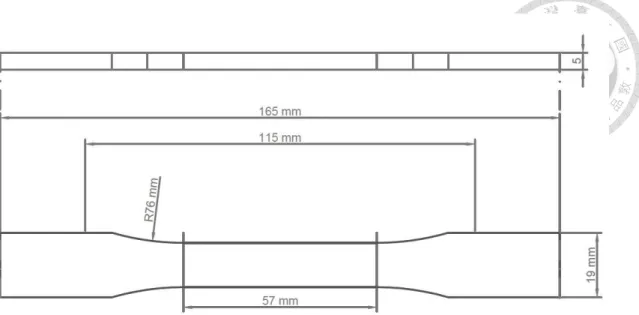
Fig. 10 Specimen for tensile test (Type I), parameters in mm. ... 32
Fig. 11 (a) side view of specimen (b) wood grain pattern and grooved pattern (opposite sides) (c) group A with plain surface and perforation design. ... 33
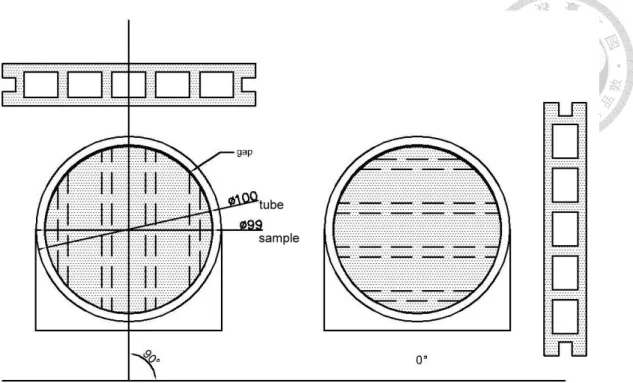
Fig. 12 Definition of rotation angle ... 34
Fig. 13 Impedance tube. ... 35
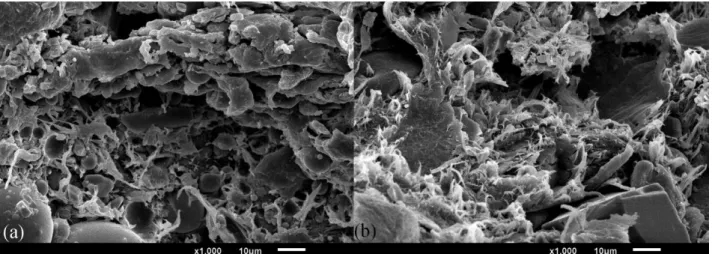
Fig. 14 (a) fracture section of rWPCs with density = 1.48 g/cm3 (b) fracture section of rWPCs with density = 1.38 g/cm3 ... 36
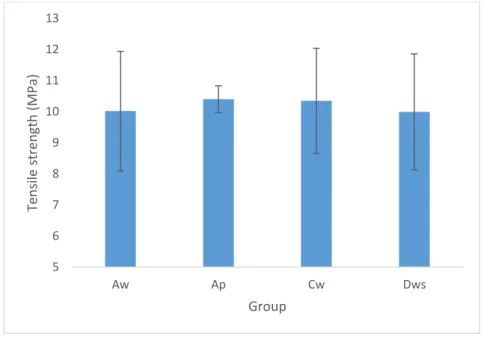
Fig. 15 Tensile strength of selected groups. ... 37
Fig. 16 Variance of sound absorption of Dw with rotation angle. ... 39
Fig. 17 Variance of sound absorption of Aw with rotation angle. ... 39
Fig. 18 Sound absorption of various structure rWPCs panels ... 41
Fig. 19 Sound absorption of Dw with various air space thickness for panel absorbent. ... 42
Fig. 20 Sound absorption of Aw with various air space thickness for panel absorbent. ... 43
Fig. 21 Sound absorption of groups with different perforation designs. ... 45
Fig. 22 Sound absorption of groups with different surface patterns. ... 47
Fig. 23 (a) surface of Ap under SEM. (b) surface of Aw under SEM. ... 47
Fig. 24 Inner view of chamber for Aw and Ap. ... 49
Fig. 25 Perforation design, parameters in mm. ... 53
Fig. 26 Coverage rate of (a) 100%, (b) 65%, (c) 33%, and (d) 0%. ... 54
Fig. 27 Setting of reverberation room. ... 55
Fig. 28 Sound absorption of various acoustic mountings for rWPCs Aw. ... 57
Fig. 29 Sound absorption of various acoustic mountings of rWPCs Aw by octave band. ... 58
Fig. 30 Sound absorption of various settings for two types of common rWPCs. ... 59
Fig. 31 Sound absorption comparison of Aw and common building materials, reproduced according to [13]. ... 60
Fig. 32 Sound absorption of A1 and B1 covered by 100 % garden modules compared to the effect with only garden modules. ... 62
Fig. 33 Sound absorption of A and B with various air gap covered by 100 % garden modules... 65
Fig. 34 Sound absorption of A and B with various air gap covered by 100 % garden modules by octave band. ... 65
Fig. 35 Sound absorption of various garden module coverage rate
with setting A6 ... 66 Fig. 36 Sound absorption of various garden module coverage rate
with setting B4. ... 67
LIST OF TABLES
Table 1 Daily noise sources ... 5
Table 2 Commonly seen octave bands ... 7
Table 3 Types of impedance tube ... 9
Table 4 Acoustic absorption performance of common materials ... 11
Table 5 Green wall settings of previous studies ... 28
Table 6 Material information and category. ... 31
Table 7 Comparison of peak absorption and peak absorption frequency ... 41
Table 8 Surface roughness. ... 48
Table 9 Settings of supporting system. ... 52
Table 10 Equipment for reverberation measurement ... 56
Table 11 Average αs of different frequency ranges of LWS with various supporting systems. ... 63
Table 12 Average αs of LWS coverage rate study. ... 67
1. Introduction
With the development of modern living style, new issues related to building environment have gathered the attention of researchers. Of a larger scale, global environment issues such as air pollution and greenhouse effect have urged the construction industry, which is responsible for a considerable amount of carbon dioxide (CO2) emission, to consider green building approaches [1]. Within the scale of a city, the compact population have given rise to problems such as waste management and noise pollution, not only effecting the residence but also the surrounding ecology system [2,3].
Moreover, in daily life, including house and automobile interior, the materials applied having close contact with human bodies would give rise to health issues, as well as quality of living. Researchers have come up with solutions for such concerns by utilizing biomaterials, with their low carbon footprint, the possibility of reducing municipal wastes and composition harmless to human beings.
Biomaterials could be light and easy to embed in constructions or facilities with outstanding functionality. Wood plastic composites (WPCs) are good examples of successful product, normally seen as outdoor facilities, especially as deck boards, with its relatively strong mechanical properties, durability and hydrophobicity [4]. Recently WPCs adopting recycled plastic as matrix has become an option for waste reduction.
However, to deal with the large amount of plastic waste produced, other applications for recycled plastic based WPCs (rWPCs) should be studied. On the other hand, according to life cycle analysis (LCA), acoustic means in buildings are difficult to reuse or recycle, resulting in relatively high environment impact [5,6]. Acoustic tiles and structures occupying extra space would also be unfriendly for high populated cities, where land and
space are scarce. Therefore, it would be favorable to benefit from material that could provide noise reduction features but also serve as built-in structural component. rWPCs possess features of porous materials [7], which would be capable of sound absorption, might provide a possibility of being a built-in noise reduction construction element. As a consequence, the noise reduction capability of rWPCs need to be carefully investigated.
Furthermore, to give a practical demonstration of rWPCs applied as an acoustical method, its potential of featuring as the supporting system of living wall systems (LWS) was studied by measuring its reverberation time. LWS could benefit from the durability and strength of WPCs. Moreover, sound absorption of LWS in high frequency ranges have been demonstrated [8,9], combination of LWS with rWPCs panels, which were expected to be responsible for low-frequency range absorption, would form a system that enables full range absorption. Consequently, a construction element with multi-function and low environmental impact was of anticipation.
To lower the environmental impact of construction industry, this study was intended to examine the potential of rWPCs as built-in acoustic measures to replace conventional acoustic methods. Furthermore, to broaden the application of rWPCs by taking advantage of its physical strength, durability, manufacture flexibility, and its eco-friendly nature, green wall with rWPCs as supporting system was constructed to create full frequency range sound absorption element. LWS has had excellent sound absorption performance for frequencies roughly above 800 Hz to high frequencies about 5,000 Hz [8–11], which makes good complementary with rWPCs, with decent sound absorption at low-frequency range.
Therefore, this study would be conducted within two parts. In Part A, sound absorption coefficient of commercial rWPCs was measured by impedance tube for basic understanding of the material. After primary evaluation of Part A, in Part B two types of well-performing rWPCs were chosen for further testing the behavior within practical scale and coherence with LWS in reverberation room. Moreover, a variety of acoustic mountings were integrated with specimens for enriching guidance for practical applications.
2. Literature review
International events such as the 1992 Rio ‘Earth Summit’, the Copenhagen Conference of 2009, and most recently, the 2015 United Nations Climate Change Conference 21th, have long been emphasizing the urgency of sustainable development.
Direct and indirect activities that produce carbon dioxide, the main substance attributing to global environmental problems, are monitored with enhanced caution while evaluating the overall impact of an industry. The building environment is responsible for 40% of the global emission, indicating that efforts towards reducing impact in architectural domains is indispensable [12]. To achieve a sustainable society, various considerations should be taken into account: the carbon foot print of construction materials and method, waste management, ecology impact, economy development …etc. As a result, eco-friendly materials have become popular in recent years; and, to further promote the application of these materials, proving they are beneficial for living quality would be essential.
Moreover, with the evolvement of modern living style, the living space of each person has been narrowed with overlapping living areas. Such living style also develop heavier transportation and diversified activities. The above would add up to an environment with complex and frequent noise sources, enhancing the significance of acoustic measures [13].
2.1. Acoustics for urban building environment
Noise pollution in city
The importance of studying acoustic measures arises from possible physical and mental damages caused by noise that could be fatal to human health [2]. Human is able
40 to 8,000 Hz, especially at around 1,000 Hz. Daily urban noise sources were listed in Table 1, while traffic noises normally generate sound wave of frequency ranging from 200 to 2,000 Hz. Since noise level exceeding 40 dB would severely disturb sleep, exceeding 55 dB would disturb conversation, it is necessary to alleviate noise level in city for better living quality [13].
Table 1 Daily noise sources [2].
Source Exterior Noise Lcvel (dBA at 30 ft)
Automobile 72 - 75
Bus 82 - 87
Subway train 98 - 103
Truck 82 - 89
Circular saw on concrete 91
Street paver 84
Tree shredding 93
Augered earth drill (10 ft) 94
Evaluation of acoustic performance
To determine the severity of noise pollution and the effectiveness of corresponding measures, acoustic evaluations should be performed considering the intensity of sound wave energy and featuring frequency. In Fig. 1, when the sound wave of noise source encounters a structure or material, its sound energy would have three possible pathways:
energy reflected (Er), energy absorbed (Ea), or energy transmitted (Et). Instruments measure the intensity of sound energy of subjected pathway, after calculation common indicators for sound attenuation evaluation such as sound absorption coefficient (αs), reverberation time (τ) and transmission loss (TL) could be obtained.
Fig. 1 Energy transfer of sound wave [7].
Daily sounds are normally a combination of various frequency sound waves, and material or structure would have different response to the sound wave of different frequency. Therefore, it is necessary to examine the effect of a material to each frequency, or by octave bands, which could be calculated by Equation 1, shown in Table 2.
Consequently, the result of measurement should demonstrate the acoustic property of specimen distinguishing the effect of each frequency individually.
Octave band center frequency
ƒ = √ƒ𝑛× ƒ𝑛+1 Equation 1
Table 2 Commonly seen octave bands Band
number
Octave band center frequency (Hz)
1/3 Octave band center frequency (Hz)
Band Limits (Hz)
Lower Higher
14 25 22 28
15 31.5 31.5 28 35
16 40 35 44
17 50 44 57
18 63 63 57 71
19 80 71 88
20 100 88 113
21 125 125 113 141
22 160 141 176
23 200 176 225
24 250 250 225 283
25 320 283 353
26 400 353 440
27 500 500 440 565
28 640 565 707
29 800 707 880
30 1000 1000 880 1130
31 1280 1130 1414
Measurement methods for absorption coefficient
Sound absorption coefficient (αs) is a common indicator for acoustic performance, which could be defined as the rate of sound absorbed to the incident sound. αs could be calculated by Equation 2, ranging from 0 to 1, with 1 indicating the specimen absorbs all incident sound energy and reflects none. The expression of sound absorption coefficient could be altered according to different measurement methods, for example as noise reduction coefficient (NRC) if multiple sound absorption materials were combined.
Sound absorption coefficient (αs), 𝛼𝑠 =𝐸𝑖 – 𝐸𝑟
𝐸𝑖 Equation 2
Ei : incident sound intensity Er : reflected sound intensity
The sound absorption coefficient of material could be obtained by impedance tube.
According to ISO 10534-2 [14], the structure of impedance tube is shown in Fig. 2, with specific requirements on the inner diameter, tube thickness, length for measuring different frequency range listed in Table 3. Other than the above factors, there are also requirements on the distance between microphones, and the distance between microphones and sample for developing plan waves and avoid distortion of sound field. At last, the back plate of sample holder should be at least 20 mm thick. The absorption coefficient could be calculated by the maximum and minimum sound pressure of the generated standing wave with Equation 3-6.
Fig. 2 Structure of impedance tube [14]
Table 3 Types of impedance tube [14]
Tube type Inner diameter of tube (mm)
Thickness of tube (mm)
Tube length (mm)
Measured frequency range (Hz)
A 75 - 110 > 5 300 - 500 < 2,000
B 25 - 50 > 5 80 - 500 800 - 5,000
𝑃𝑎 =𝑃𝑚𝑎𝑥+ 𝑃𝑚𝑖𝑛 2
Equation 3
𝑃𝑏= 𝑃𝑚𝑎𝑥− 𝑃𝑚𝑖𝑛 2
Equation 4
𝑅 =𝑃𝑎 𝑃𝑏
Equation 5
𝛼 = 1 − |𝑅|2 Equation 6
Pa: maximum sound pressure in impedance tube Pb: minimum sound pressure in impedance tube R: material reflection rate
α: absorption coefficient
By Table 3, it could be noticed that impedance tube can only measure samples with the size of diameter up to 110 mm and restricted thickness. Therefore, the acoustic properties of larger building elements would require other methods for accurate measure.
According to ISO 354-2003 [15] and ASTM C423-17 [16], the sound absorption capacity of building elements could be measured by reverberation time in the reverberation room. The volume of a reverberation room should not be less than 150 m3,
the maximum length of the long side should be less than 1.9V1/3, and the ratio of either two sides should not be an integer for even distribution of low frequencies. For sound field to distribute sufficiently during decay, suspending diffusers are required. The condition of reverberation room would create a significant effect on the results, especially at high frequencies or low relative humidity. Therefore, the relative humidity should be held between 30% and 90%, temperature higher than 15 °C, and kept the same throughout the measurement. The relative humidity of specimen should be balanced with the reverberation room before testing. At last, the area of the specimen should be at least 5.57 m2, altering according to the size of reverberation room, with at least 1 m for either side and ratio of length and width between 0.7-1.0.
There are also requirements on position settings of the specimen, sound sources and receivers to acquire results in free field since the result should not be influenced by sound reflection, sound pressure or vibration. For example, the receiver should be 1 m away from the sound source or any surface. By using interrupted noise method, reverberation time, T60, is acquired by sensing the time of 60 dB sound level drop. After acquiring the reverberation time with and without the specimen, sound absorption coefficient could be calculated with following Equation 7and Equation 8.
𝐴𝑇 = 55.3𝑉 ( 1
𝑐2𝑇2− 1
𝑐1𝑇1) − 4𝑉(𝑚2− 𝑚1) Equation 7
𝛼𝑠 = 𝐴𝑇
𝑆 Equation 8
V: room volume (m3); c: speed of sound (m/s);
T2: reverberation time with specimen; T1: reverberation time of no specimen;
m1 & m2: Sound power attenuation coefficient; S: area of specimen (m2)
Following in Table 4 are some common furnishing materials and their sound absorption capability. It could be observed that materials with softer surface would have better sound absorption at high-frequency range, such as carpets, and panels would have better performance in low-frequency range. Materials with hard surfaces such as unglazed brick and marble would have low sound absorption ability. Resonator blocks have relatively good sound absorption for all octave bands. However, other factors would need to be considered for architectures, such as resonator blocks would occupy larger space, or recently the environmental impact of material has been focused. Therefore, it is necessary to understand the principle of noise reduction for better acoustic mounting decision.
Table 4 Acoustic absorption performance of common materials, reproduced according to [13].
Material
Absorption coefficient Octave band center frequency (Hz)
125 250 500 1000 2000 4000
Unglazed brick 0.03 0.03 0.03 0.04 0.05 0.07
1/4-in. pile height carpet 0.05 0.10 0.15 0.30 0.50 0.55 Painted concrete block 0.10 0.05 0.06 0.07 0.09 0.08
Wood floor 0.15 0.11 0.10 0.07 0.06 0.07
Marble or glazed tile 0.01 0.01 0.01 0.01 0.02 0.02 1/4-in. Hard plywood paneling 0.58 0.22 0.07 0.04 0.03 0.07 8 in. resonator block 0.20 0.95 0.85 0.49 0.53 0.50
Wood roof decking 0.24 0.19 0.14 0.08 0.13 0.10
Methods for noise control
Noise control could be done by absorbing sound energy or blocking noise from acceptor [13]. The further could be achieved by applying sound absorbing materials or acoustic mountings, while the later would normally require heavy solid constructions such as thick concrete walls. However, thick and heavy concrete walls would cause high environmental impact and are still possible to let noise propagate from any cracks or gap, windows and doors. Furthermore, the reflection of sound waves between the buildings in the city would lead to long reverberation time of street noise, enhancing the chance of people exposing to noise disturbance [9]. Therefore, sound absorbing materials with lighter weight would be more preferable acoustic measure comparing to sound wave blocking measures, as well as creating a softer surface that would not contribute to sound reflection [9].
Sound absorbing materials
Sound absorption in materials relies on dissipating sound energy by friction or vibration of air, transferring sound energy to heat [17]. Materials with porous structure are favorable for such mechanism, especially for attenuating sound of high frequency range. Three main types of porous materials are shown in Fig. 3, exhibiting not only cavities but also channels that allow sound wave to travel throughout the material, dissipating sound energy by the frequent friction of air in pore structures. A classic porous material, asbestos had been popular for its sound absorbing ability for the last century, until it was confirmed to be detrimental to human health [17]. As a consequence, materials that possess similar structure as asbestos-based materials have been studied for
replacement. For instance, plant-based natural fibers which were proved to have considerable sound absorbing ability [18–20].
Fig. 3 Three types of porous materials [17]
On the other hand, soil and living plants have also been studied for sound attenuation property for environment sustainability [9]. Soil exhibits porous structure, and has softer surface comparing to asphalt road surface; soil depth, type, and moisture content are factors that might influence acoustic performance [9]. As for living plants, they contribute to noise reduction by scattering sound wave or by vibration with leaves, twigs and trunk [9,21]. Consequently, shrubs, green belt, green roofs and green walls have been studied for their acoustic properties. For example, evergreen vegetation more than 6 m wide may provide 2 − 4 dB sound attenuation [22]; transmission loss of around 10 dB at frequency 400 to 1,000 Hz could be achieved by green roof [23,24]; superior sound absorption was found for green walls comparing to common façade materials [8,11].
However, the materials mentioned above generally are not in favor of dealing with sound waves of frequencies lower than 800 Hz [9]. As mentioned in previous sections, noise generated in city streets has the frequency of 200 – 2,000 Hz; while sound wave with higher frequencies dissipates more easily, sound waves with lower frequencies tend to linger within streets by reflection. As a result, it has been a challenge to mitigate noise of low-frequency range.
Acoustic mountings
The insufficiency of porous materials for noise control at low-frequency range could be compensated by acoustic mountings, including membrane (panel) absorbent and perforated panel absorbent (Helmholtz resonator). The mechanism of panel absorbent is shown in Fig. 4, where the distance of air gap behind the panel would determine the frequency of maximum absorption, which could be referred to Equation 9. For example, maximum absorption of panel with 25 mm air gap would appear at around 250 Hz; with the increase of air gap, the frequency of maximum absorption would decrease.
Frequency of max absorption (Hz), 𝑓 = 60
√𝑑𝑚 Equation 9
d = thickness of panel (m)
m = surface density of panel (kg / m2)
Fig. 4 Membrane (panel) absorbent [13]
The design of perforated panel absorbent is shown in Fig. 5. Its maximum absorption frequency could be calculated by Equation 10 for the case of a single pore, or calculated by Equation 11 the case of a complete perforated panel [13]. To broaden the absorption peak, it is common to combine more than one acoustic method, such as installing perforation board with a layer of porous material and a layer of air gap (Fig. 6) [13].
Frequency of max absorption (Hz)
𝑓 = 𝑐 2𝜋√𝑆
𝑉𝑙′ Equation 10
c = velocity of sound in air (m/s) S = surface area of the neck (m2) r = radius of opening (m)
l’= effective thickness of neck = (l + πr/2) (m) V= volume of contained air in chamber (m3)
Frequency of max absorption (Hz),
𝑓 = 𝑐 2𝜋√𝑃
𝑑𝑙′ Equation 11
c = velocity of sound in air (m/s)
P = perforated ratio (hole area/panel area) d= distance of panel from the wall (m)
l’= effective thickness of neck = (l + πr/2) (m) r = radius of the whole (m)
Fig. 5 Perforated panel absorbent [13]
Fig. 6 Common combined acoustic mounting structure [2]
As mentioned previously, conventional acoustic materials would be harmful to human health, or hard to recycle. Though plant based natural fibers became popular for lower environmental burden, the durability of such materials would still require further studies for practical applications [18,19,25,26]. Therefore, other than natural fibers, recycled materials were also considered for noise attenuation purpose recently, which would further benefit waste management [26,27].
Plastic wastes, consisting of a considerable percentage of municipal wastes, have become a kind of stable resource; furthermore, rubber particles had been proved to be potential sound absorbents [27]. Natural fibers are environmental friendly and would be able to provide mechanical reinforcement for composites with similar mechanisms as glass fiber. Combining plastic with natural fibers would produce material with sufficient mechanical properties, durability, low variance and lower carbon footprint that could be applied in architectures. Such composites are commonly referred to wood plastic
composites (WPCs), or recycled plastic based wood plastic composites (rWPCs) [4,28,29].
2.2. Wood plastic composites and its acoustic potential
2.2.1. Wood plastic Composites
Wood plastic composites (WPCs) had appeared in the early 20th century [4]. Wood flour was added into the plastic matrix to improve its mechanical properties. In recent years, WPCs have been commonly applied for outdoor facilities such as deck boards and fences owing to its characteristics such as water resistance, operation convenience, sufficient durability and reliable strength [30]. For example, some commercial WPCs could reach compressive strength of 34.48 MPa (5,000 psi), tensile strength of 8.28 MPa (1,200 psi) with variation coefficient much lower than solid wood. Studies now are focusing more on its environment sustainable performance, since the commodity plastics of WPCs could be replaced by recycled plastics that contribute to municipal waste management [29]. To have a basic understanding of WPCs, common constituents are introduced in the following sections, including plastics, cellulose fibers, mineral fillers and coupling agents [4].
Plastic matrix
There are several general matrix choices for WPCs, with polyethylene (PE)
and the least being polyvinyl chloride (PVC) [28]. Since the final product is commonly formed by extrusion, compression molding, and injection molding, the operating temperature becomes a decisive factor for promoting material performance [31].
Considering the fact that wood fibers or other plant origin fibers would decompose at around 200 ℃, PE, with a relatively lower melting temperature of 106 - 135 ℃ makes it a favorable choice for the matrix. On the other hand, though PP has melting point around 161 - 170 ℃, lower than the limit of 200 ℃, its higher operating temperature range than PE indicates the higher cost for energy consumption, thus making it less favorable. Not to mention PVC with a wide range of melting point of 100 - 200 ℃, or other plastics with the melting point higher than 200 ℃, such as acrylonitrile-butadiene-styrene (ABS), polystyrene (PS) and polyethylene terephthalate (PET), which would definitely enhance the operation difficulty [4]. On the other hand, to reduce the dependence on fossil fuels, bio-based matrices such as polylactide acid (PLA) and polyhydroxybutyrate (PHB) have been studied in recent years [28,31].
Other features of the plastic matrix would also lead to different characteristics of WPCs, to name a few, crystallinity, glass transition temperature, average molecular weight, and chemical properties. These factors would affect the combination of wood flour and plastic, and further influence the mechanical and chemical performances of the final product [4,28]. For example, PE is inferior to PP in strength, stiffness, creep resistance and slippery prevention. Nonetheless, PP is harder to work with when applying nails or screw due to its stiffness; it is also more brittle than PE. Other features such as flame spread, water absorption, and weather resistance should be as well considered according to different application requirements. As a consequence, a mixture of plastics with various compositions appear for specific functions, while in such cases the operation
temperature would become a challenge [4]. Moreover, the interaction of such matrix with mineral fillers and wood flour / natural fiber would further influence the addition of coupling agent, which would be discussed in the following sections.
Natural fiber
Adding wood flour or plant-based fibers as fillers contribute to not only improved physical properties but also lower costs. For example, the tensile modulus of neat PP was 1,400.00 MPa (203,000 psi), filling with 40% jute promoted the figure to 7103.45 MPa (1,030,000) psi, which could be compared to filling with 40% glass fiber of 7526.21 MPa (1,100,000 psi) [4].
Common sources of plant origin fiber include wood flour, sawdust, rice hulls, and papermaking sludge [31]. These sources differ in chemical components, density, fiber aspect ratio, particle size and shape, surface area and moisture content. The above factors would further influence the morphology and performance of WPCs. For instance, rice hulls might contain more minerals than wood fiber, leading to better microbial degradation resistance; sources with higher hemicellulose content would release more volatile organic chemicals (VOC) during production, ending up with lower density of the final product, or corrosion of factory instruments; particle size and shape, as well as its distribution would affect the viscosity of hot melt, influencing the uniformity thus quality of product [4].
Last but not least, the amount of natural fiber added and the modification method of natural fiber would influence the water uptake of the product, which would have a
significant effect the dimensional stability of material [32]. Therefore, an addition of mineral fillers has been considered for the overall formula for their stability comparing to relatively unpredictable natural fibers [4].
Mineral fillers
Mineral fillers affect WPCs in a similar way as the natural fiber but would be more meant for stability. Calcium carbonate, talc, silica, glass fibers… etc. has been reported in existing commercial application [4,33,34]. Some mineral fillers would provide other advantages, for example, the shape of carbon black is nearly spherical, which could act as lubricant in hot melt; hot melt of higher viscosity is usually favorable for manufacturers to avoid the damage of equipment caused by fillers. On the contrary, side effects such as increasing degradation rate aroused by free metal ions should be taken into account [4].
The main considerations of adding mineral fillers or wood flour include the overall cost, performance, and overall manufacture efficiency, which are all significant for the industry. In an actual case, 40% of glass fiber in PP enhanced up to 3.6 times tensile modulus comparing to neat PP, the same proportion of wood flour only enhanced by 1.6 – 2.6 times. However, the cost of glass fiber is higher than wood flour. Consequently, a mixture of fillers and natural fiber of various proportions were seen in products according to their application [34]. In such cases, the combination of all components would be a key factor of product quality, since the diversity of surface property for plastic, mineral fillers and natural fibers, thus coupling agents are required to provide the product with ideal strength and features [4,34–36].
Coupling Agent
Coupling agents, or compatibilizers, are essential to combine all of the components or poorly mixed components with weak interfaces would become malfunctioning products [31,33]. Hence, two types of coupling agents of different mechanisms are employed to create even and well-bridged interface of WPCs: one that could form bonds with the polymer matrix and fillers, or the other function by generating entanglement or segmental crystallization with the polymer matrix. Maleated polyolefins, a typical compatibilizer, has been predicted to have both of the mechanisms. Its maleic anhydride groups would interact with cellulose fiber at extrusion temperatures, while the polyolefin parts form entanglements with the plastic matrix [37,38]. However, the actual interaction between the constituents of WPCs has not been clarified yet [4]. Regardless of the actual mechanism, with the assistance of the coupling agent, mechanical properties are improved [39]. In the following case, a better bonding between fillers and matrix had been proved by SEM (Fig. 7a and Fig. 7b), where the pull out of fibers are obvious without compatibilizers (Fig. 7b) [7].
Fig. 7 SEM of WPC with (a) sufficient coupling agent and (b) insufficient PMDI
Recycled material based WPCs (rWPCs)
Replacing virgin plastic with recycled plastics as raw material for WPCs has been proved to be feasible [28,34,40]. However, since it would take extra procedures to separate recycled plastics, for the consideration of cost, manufacturers often get mixed plastic as raw material, which would indicate complex operation conditions. Moreover, these recycled wastes have high chances of containing impurities, as a result, it has been difficult to control the quality of WPCs made by recycled plastics, indicating more study required for better operation guides [28].
2.2.2. WPCs and acoustics
WPCs (or rWPCs) consists of a plastic matrix, plant fibers, and additives or fillers.
According to a previous study, recycled rubber particles were moderately sound absorptive, and further perforation process led to a high absorptive performance of wide frequency range [27]. The addition of plant fibers and mineral fillers might further enhance sound absorption of WPCs for forming porous structures [17]. Consequently, WPCs are expected to have decent noise reduction performance. The final porous structure morphology of WPCs would depend on manufacture process, applied materials and bonding, as well as the impurities of recycled raw materials [7,28,41], making it more difficult to predict the microstructure of final product, which would be closely related to its acoustic properties. For instance, ash content and the addition of carbon black was considered influential for rWPCs produced by waste tire, which showed transmission loss up to 35 dB [7].
Other techniques might as well benefit the sound absorption of WPCs, such as foaming [42]. The additives, impurities and techniques having influence on the density, microstructure and mechanical strength of WPCs would be linked together as physical property factors, where density and mechanical strength would determine the application fields of WPCs, and microstructure would determine the sound absorption of WPCs.
WPCs with lower density might indicate microstructure with more cavities, which would lead to better sound absorption, but cavities might also indicate compromised mechanical strength. Consequently, if specific type of WPCs was manufactured, before measuring the sound absorption property of WPCs, it would be necessary to examine the density and mechanical strength of WPCs in advance [41,42].
Despite the microstructure of WPCs that represents its own acoustic nature, the performance of WPCs in practical use should be determined by in situ factors. Current final products of rWPCs often come as panels, therefore it is possible to construct a panel absorbent or perforation board structure for the acoustic purpose to improve its added value [2,13]. Though the property of single rWPCs board combined with membrane absorbent and perforation structure had been examined [41], designs for practical application would rely on further study. For example, the commercial products were often assigned to present decorative patterns should also be considered since with various surface roughness the sound attenuation performance might also be improved [17,43].
At last, it would be a pity to neglect the structural strength and molding flexibility of WPCs. Therefore, designing WPCs as structural elements with acoustic performance would make the most of the properties of WPCs. Such structure would also be potential of eliminating space occupation in cities for crowded living style with its built-in feature,
where rWPCs bricks in the study of Guzman and Munno could be a good example [44].
For instance, bricks of rWPCs with triangular holes showed higher sound absorption than solid clay bricks (Fig. 8).
Fig. 8 rWPCs bricks with triangle hole design for acoustic purpose by Guzman and Munno [44]
2.3. Green walls and acoustic
In this work it was expected to give a green solution for urban noise. Previously the potential of rWPCs was discussed, and since by now WPCs has been hard to recycle [31], an application method for longer serving duration should be of better choice. To alleviate the influence of urban noise, measures that would directly face noise sources would be more effective. Therefore, green walls have been considered, where rWPCs could be combined as its supporting system with its mechanical strength and durability, and are expected to compensate green walls lacking sound absorption in low-frequency range.
The earliest record of green walls could be dated back to 2,000 years ago, in the Hanging Garden of Babylon and the Roman and Greek Empires, when the Greeks took advantage in vines covering pergolas, shading building envelopes during summer.
Furthermore, fruit espaliers provided economic value, whereas climbing roses served as ornament plants [45]. Recently, green walls have been proved to improve urban biodiversity, alleviate heat island effect, contribute to storm water management and enhance air quality [46,47]. Moreover, studies have shown that the presence of green wall would provide recreational values for communities, which further leads to an increment of the local real estate [48]. Such feature differentiates green walls from green roofs since the access of green roofs is limited to certain citizens who have access. The applicable area is another feature that differentiates the two similar green designs since high rising buildings in modern cities would have a larger wall area comparing to roof.
To further take advantage of the feature, noise attenuation designs have been
reached by its adaptable area, and also for green walls directly facing street noises [22].
Recent studies for green walls acoustics had been focused on substrates and plants. Type, porosity, moisture content, and depth had been discussed for substrates; while species, tortuosity (leaf dominant angle), flow resistivity (leaf area density) and plant height are considered for plants [8–11,21]. Generally, the substrate of green walls would be responsible for most of the sound absorption, especially for middle range frequencies, while plants would slightly improve noise attenuation of high-frequency range [11,49].
For example, the study of Davis et al. had relatively thicker substrate exposed in reverberation room (Fig. 9), resulted in high sound absorption coefficient for frequency bands over 500 Hz (Table 5).
Fig. 9 Garden modules in study of Davis et al. [11]
Other than the factors above, the coverage rate of plants could also be compared:
with the higher number of plants per square meter, the higher the sound absorption [8,11].
At last, the design of green walls would also influence noise mitigation, since some
species or configuration of plants dispersal might cause resonance at certain frequencies, leading to amplification of noise, which should be taken into account for designers [8].
To sum up, green walls are potential passive sound attenuation methods, and further studies are required for practical application.
Table 5 Green wall settings of previous studies [8,10,11].
Reference Species Plants
per m2
Substrate depth (m)
Crown size (m) Wong et al. [8] nephrolepis exaltata (boston ferns) 13.89 0.14 0.32 Davis et al. [11] nephrolepis exaltata (boston ferns) 79.01 0.10 - Azkorra et al. [10] helichrysum thianschanicum 100.00 0.08 0.40
On the other hand, there are still drawbacks to be conquered according to the type of green walls, which has a wide range of variety for adapting modern constructions.
Manso and Castro-Gomes categorized green walls into two main systems, green facades, with simple designs and low environmental burden, and living walls, with more complicated irrigation systems that allow further aesthetic potential [50].
Green facades mostly consist of climbing vines, which would impair the exterior wall if directly cling to the construction, and would still be limited to the maximum growth of the species. Consequently, garden modules made of felt pockets, trays and planter tiles have been developed to promote creativity and adaptability. Nonetheless, such living wall systems (LWS) would require well-designed irrigation and drainage facilities, which would suggest a higher cost. Moreover, irrigation or drainage systems connected with tubes might allow infection between each garden module, leading to more
or LWS (especially for LWS) might be constructed by stainless steel, galvanized steel and glass fibers that would give high environmental impact, as well as other components with insufficient durability requiring constant renewal [45,49–51]. As a consequence, it would be beneficial to find out supplement methods for these weaknesses.
3. Part A: Recycled material based WPCs and Acoustics
Since current acoustic means would occupy certain space and utilizes higher carbon footprint materials, studying rWPCs that could be integrated into constructions with its structural strength and with noise attenuation potential would be helpful for green designs [52]. rWPCs were proved with porous structure favorable for sound absorption while applying rWPCs is beneficial for municipal waste reduction. However, the impurities of raw material indicate uncertainty of its feature. Therefore, it is expected in this study rough tendency of rWPCs sound absorption could be generalized by considering density, thickness and structure of the material, enriching reference data for applying rWPCs, and compensating the insufficiency of previous studies [27,41,44].
In Part A, commercial WPCs made with recycled plastic were tested for sound absorption coefficient by impedance tube. Various structure types, acoustical mountings, and surface patterns were included to have comprehensive understanding of how to apply WPCs as acoustic materials.
3.1. Materials and Methods 3.1.1. Materials and sample preparation
The materials were kindly provided by Huan Su W.P.C. (Taoyuan, Taiwan). The recycled plastic based WPCs (rWPCs) specimens were consisted of 40% recycled PP and
PE mixture, 30% wood fiber and 30% glass fiber, with density claimed to be 1.39 g/cm3. The examined groups are listed in Table 6, with three replicates for thickness, chamber height and density, measured according to ASTM D792-13 [53]. To confirm the uniformity of the specimens, tensile tests were performed referring to ASTM D638-03, where specimens were cut into shape shown in Fig. 10 and ten replicates were taken for each selected group [54].
Table 6 Material information and category.
Group Density (c.v.) (g/cm3)
Chamber height (c.v.) (mm)
Thickness (c.v.) (mm)
Structural design
Aw 1.483 (0.13) a 12.93 (0.40) a 25.65 (0.55) ab Bw 1.397 (0.03) b 13.77 (0.73) b 26.85 (0.23) bc Cw 1.417 (0.01) c 6.86 (3.87) c 21.48 (0.22) d
Dw 1.419 (0.04) c - 27.09 (0.32) c
Dws 1.383 (0.00) d - 25.61 (0.42) a
Perforation design
Ap 1.478 (0.59) a 12.80 (0.06) a 25.98 (0.25) a Apc 1.511 (0.16) b 12.58 (1.72) a 26.20 (0.70) a Ap3v 1.512 (0.06) b 12.73 (0.33) a 25.87 (0.00) a Ap3h 1.515 (0.21) b 12.79 (0.82) a 25.95 (0.51) a
*c.v.: coefficient of variation (%)
**same letter indicates no significant difference between groups
For measurement in impedance tube, the specimens were cut into circle shape of 99 mm diameter, with three specimens tested for each group. Four types of rWPCs were categorized according to structure, where A, B, C had hollow chambers and D was solid, as shown in Fig. 11a. All groups went through same surface treatment: random wood grain pattern on one side and slip prevention grooves on the other, except for Dws, which had wood pattern on both sides.
Fig. 10 Specimen for tensile test (Type I), parameters in mm.
To determine the effect of surface pattern, opposite sides of structure group A of wood grain pattern (abbreviated as “w”) and grooves (abbreviated as “g”) were measured. An additional group of plain surface (abbreviated as “p”) with also structure A was measured (Fig. 11b). To further study the effect of perforation absorbent, pores of 5 mm diameter were drilled at specific locations of the specimen as shown in Fig. 11c, including three types: one pore at the center (Apc), three vertical pores at the middle chamber (Ap3v), and three horizontal pores at three different chambers (Ap3h).
Last but not least, since the specimen would not absolutely fill the impedance tube, considering the structural difference, effect of rotation angle 0˚, 10˚, 30˚, 50˚, 70˚, and 90˚ defined by Fig. 12 of specimen in impedance tube was analyzed. For solid groups, definition of chamber direction was replaced by direction of wood grain pattern.
Fig. 11 (a) side view of specimen (b) wood grain pattern and grooved pattern (a)
(b) (c)
Fig. 12 Definition of rotation angle
3.1.2. Sound absorption measurement
The normal incident sound absorption coefficient (αs) was measured according to ISO 10534-2 [14]. Fig. 11 showed impedance tube (type 7758, 3560-C system) of Bruel &
Kjaer (B&K), where specimens with diameter of 99 mm were inserted in the tube at point A. Due to limit of sample structure and tube size, the measurement range of αs was between 50 to 1,600 Hz. Each group had three replicates, and the result of each replicate was obtained by an average of 500 measurements for fulfilling the requirement of ISO 10534-2.
To further study the performance of rWPCs combining panel absorbent, handle at point B was adjusted to add extra air gap with 1, 3, 5, and 10 cm thick behind specimens.
produced by Auralex StudiofoamPro with noise reduction coefficient claimed of 0.9.
Fig. 13 Impedance tube.
3.1.3. Surface and morphology study
Two measurements were performed to analyze the possible transmission of sound wave through the specimen. The surface roughness readings were collected by roughness meter Surfcorder SE 1700 (Kosakalab, Tokyo, Japan) at distance of 12.55 mm, with 2.5 mm cut-off and speed of 0.1 mm/s; three readings were taken at different locations of each sample and the mean value was calculated to represent the roughness value. For the wood grain pattern, the rough area and smooth area were measured separately due to the detection limit (fig. 9b). Secondly, scanning electron microscope (SEM) (Joel JSM-5410) were applied for microscale study of surface and the tensile section of rWPCs.
3.2. Results and discussion 3.2.1. Uniformity of specimen
Normally, rWPCs are thought of as material with high uniformity. A variety of A
B
specimen might occur through manufacture or cutting process, including non-uniform structure or edges, which might influence the result of impedance tube. For instance, by measuring the density of each specimen, variations could be found within the same group even the composition of material was the same. There was also significant difference in density over different groups (Table 6) even the composition of material was the same, which could be caused by different extrusion molding process. Hence, the possible effect on the physical property due to density was studied by SEM and tensile test since morphology and microstructure of the material would be related to acoustic performance.
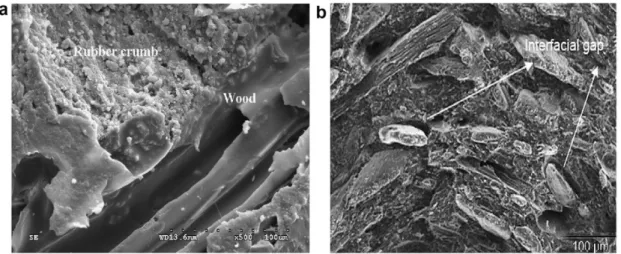
SEM figure of fracture sections of the sample with density 1.48 (Aw) and 1.38 (Dws) g/cm3 were shown in Fig. 14a and Fig. 14b for observing the difference in microstucture.
In Fig. 14a, there were small vacancies with round shape caused by fiber or additive pull out, while larger vacancies were seen in Fig. 14b. It might indicate that the two exist distinctive physical performance, for example, larger and irregular pull outs might suggest lower mechanical strength. Therefore, tensile tests were performed to determine whether the variance in density and microstructure would influence the mechanical property.
Fig. 14 (a) fracture section of rWPCs with density = 1.48 g/cm3 (b) fracture section of rWPCs with density = 1.38 g/cm3
The result of the tensile test of selected groups shown in Fig. 15. The average tensile strength was 10.19 MPa, and there was no significant difference in tensile strength between each group despite a significant difference in density according to ANOVA (Tuckey’s HSD) test. However, it could be observed that groups with wood grain pattern had a larger variance, which might indicate that surface patterns would have a certain influence on specimen property. The phenomenon might be due to the irregularity of the surface leading to stress concentration in certain areas, thus causing larger tensile strength variance. Therefore, though the groups with wood grain patterns showed larger variance, the plain samples with relatively smaller coefficient of variation less than 4.5 % would still suggest that the specimen had a uniform interior structure, and for following sound absorption measurements the surface patterns would be focused.
Fig. 15 Tensile strength of selected groups.
On the other hand, though the effect might be trivial while applying rWPCs in practical situations of larger scales, the structural or morphology of each sample might interfere the result of measurement by impedance tube of a relatively smaller scale. To
5 6 7 8 9 10 11 12 13
Aw Ap Cw Dws
Tensile strength (MPa)
Group
filter out the effect caused by specimen and impedance tube, various positions of specimen in the impedance tube were set for observing its affect to sound absorption.
In Fig. 16, sound absorption of Dw showed no obvious variation with rotation;
contrarily, Aw (Fig. 17) showed sound absorption curve transforming with rotation angle.
It was obvious that the structure of rWPCs would influence its sound absorption ability, however there were limited theories to explain the phenomenon.
For Aw, sound absorption peak of frequency around 500 Hz would decrease with rotation angle with sharper absorption peak, while for frequency from 500 to 1,100 Hz sound absorption would increase with decreasing rotation angle. The structure of Aw with different rotation angle might lead to different vibration modes for its different fulcrum.
In the case of chamber placed horizontally, the specimen would be supported by both panels; when chamber was placed vertically to ground, the specimen might possible be supported not only by panels but also the chamber walls. Contrarily, weight load of solid group Dw was relatively even comparing to Aw. Therefore, different vibration modes might appear with varying rotation angle, thus absorbing sound energy of different frequency.
Fig. 16 Variance of sound absorption of Dw with rotation angle.
Fig. 17 Variance of sound absorption of Aw with rotation angle.
Other than the variation within the same specimen caused by rotation, the effect of structure design among groups would be discussed in the following sections, which could
0.00 0.05 0.10 0.15 0.20 0.25 0.30 0.35 0.40 0.45 0.50
50 250 450 650 850 1050 1250 1450
Absorption coefficient
Frequency (Hz)
0 10 30 50 70 90
0.00 0.10 0.20 0.30 0.40 0.50 0.60 0.70 0.80 0.90 1.00
50 250 450 650 850 1050 1250 1450
Absorption coefficient
Frequency (Hz)
0 10 30 50 70 90
be explained by the mechanism of panel absorbent. Considering the variation within the same specimen, measurements would be taken with chamber vertical to the ground to minimize the influence of interaction between impedance tube and specimen, while sharper sound absorption peak would allow easier determination of variation in absorption frequency.
3.2.2. Effect of structure on sound absorption property
The average incident sound absorption coefficient (αs) of corresponding groups and reference (acoustic tile) were shown in Fig. 18, with the average peak αs and peak αs
frequency listed in Table 7. It could be observed that Aw and Bw had peak αs around 370 - 580 Hz. Cw gave high αs of 0.72 at around 600 Hz. Solid groups Dw and Dws had moderate αs around 550 – 690 Hz, which showed larger variance comparing to hollow groups. The hollow groups Aw, Bw and Cw had high sound absorption peaks at around 380 – 640 Hz, while the peaks would move to lower frequencies as the hollow height increased.
Comparing to common construction materials (Table 4), the hollow groups had improved sound absorption performance at mid-low frequency range, while solid groups had relatively less improvement. Consequently, the hollow structure of rWPCs might be not only beneficial for alleviating structure weight but also beneficial for reducing noise.
Fig. 18 Sound absorption of various structure rWPCs panels
Table 7 Comparison of peak absorption and peak absorption frequency Group Peak αs (c.v.) Peak αs frequency (c.v.) (Hz)
Structure type
Aw 0.89 (1.71) a 490 (1.47) ab Bw 0.86 (1.16) a 435 (3.46) a Cw 0.72 (2.13) b 596 (1.24) bc Dw 0.41 (7.26) c 618 (9.80) c Dws 0.39 (12.52) c 659 (13.67) c
Perforation design
Ap 0.79 (8.25) a 467 (0.65) a Apc 0.90 (2.10) b 517 (0.22) b Ap3v 0.96 (2.41) bc 601 (1.64) c Ap3h 0.99 (0.15) c 666 (0.30) d Surface
pattern
Aw 0.89 (1.71) a 490 (2.42) a Ag 0.85 (7.20) a 476 (0.63) ab Ap 0.79 (8.25) a 467 (0.65) b
*c.v.: coefficient of variation (%)
**same letter indicates no significant difference between groups
0.00 0.10 0.20 0.30 0.40 0.50 0.60 0.70 0.80 0.90 1.00
50 250 450 650 850 1050 1250 1450
Abosrption coefficient
Frequency (Hz)
Aw Bw Cw Dw Dws Acoustic tile
For further understanding the factors that might influence sound absorption, ANOVA (Tuckey’s HSD) test was performed. The result suggested that chamber height had the most significant effect to peak αs, with r = 0.963 comparing to factors such as density, thickness, chamber width and weight that had r lower than 0.5. The phenomenon could be referred to as panel absorbent, which would be discussed in the following section.
3.2.3. Effect of adopting acoustic methods on sound absorption property
3.2.3.1. Panel absorbents
Panel absorbents improve sound absorption by transferring sound wave energy to mechanical energy with its structure of panel and the air gap. Depending on the thickness of air gap, the panel absorbents are effective of sound absorption of low frequency. Fig.
19 and Fig. 20 showed the corresponding variation of sound absorption to increasing air gap behind specimen group Aw and Dw, with peak αs and peak αs frequency in Table 7.
Fig. 19 Sound absorption of Dw with various air space thickness for panel absorbent.
0.00 0.10 0.20 0.30 0.40 0.50 0.60 0.70 0.80 0.90 1.00
50 250 450 650 850 1050 1250 1450
Absorption coefficient
Frequency (Hz)
0 1 3 5 10
Fig. 20 Sound absorption of Aw with various air space thickness for panel absorbent.
Panel absorbent was effective for improving the sound absorption property of group Dw. As the air gap thickness increased, the maximum sound absorption of Dw increased with lowering peak frequency, until reaching air gap thickness of 3 cm. There was no significant difference for peak αs according to ANOVA analysis between the result of 3, 5, 10 cm air gap. For Aw, peak αs frequency of all air gap thickness had significant difference according to ANOVA analysis but had no significant difference in peak αs as air gap thickness increased. Both groups had peak αs at around 250 Hz with 3 cm air gap, which were superior to traditional materials of similar mounting (i.e. 10% perforated panel with 25 mm mineral wool over 25 mm air gap had αs less than 0.5 at 250 Hz [13]), indicating that rWPCs were potential materials for compensating the deficiency of common porous materials at lower frequencies.
On the other hand, if the absorption peak at around 650 Hz was seen as the feature absorption of rWPCs according to Dw, the minor absorption peak of Aw at around 600
0 0.1 0.2 0.3 0.4 0.5 0.6 0.7 0.8 0.9 1
50 250 450 650 850 1050 1250 1450
Absorption Coefficient
Frequency (Hz)
0 1 3 5 10
![Fig. 3 Three types of porous materials [17]](https://thumb-ap.123doks.com/thumbv2/9libinfo/9604283.630499/23.892.258.656.218.660/fig-types-porous-materials.webp)
![Fig. 4 Membrane (panel) absorbent [13]](https://thumb-ap.123doks.com/thumbv2/9libinfo/9604283.630499/25.892.131.785.113.460/fig-membrane-panel-absorbent.webp)
![Fig. 6 Common combined acoustic mounting structure [2]](https://thumb-ap.123doks.com/thumbv2/9libinfo/9604283.630499/27.892.166.778.118.459/fig-common-combined-acoustic-mounting-structure.webp)
![Fig. 8 rWPCs bricks with triangle hole design for acoustic purpose by Guzman and Munno [44]](https://thumb-ap.123doks.com/thumbv2/9libinfo/9604283.630499/35.892.167.746.318.794/rwpcs-bricks-triangle-design-acoustic-purpose-guzman-munno.webp)
![Fig. 9 Garden modules in study of Davis et al. [11]](https://thumb-ap.123doks.com/thumbv2/9libinfo/9604283.630499/37.892.131.765.584.935/fig-garden-modules-in-study-of-davis-et.webp)