CONSTRUCTION AND ANALYSIS OF EDUCATIONAL ASSESSMENTS USING KNOWLEDGE MAPS WITH WEIGHT APPRAISAL OF CONCEPTS
8
0
0
全文
(2) Researchers have shown that offering overview supports by providing access to relevant information greatly help people make decisions, solve problems, and avoid disorientation problems (Edwards & Hardman, 1999; Thomas, 2009). Graphic tools or map presentations can be used to create overview supports, restructure content, and deepen or elaborate knowledge of a subject (Zumbach, 2009). Knowledge maps provide a graphical representation of the relationships among concepts. They reveal underlying relationships of the knowledge sources, using a map metaphor for spatial display. Hence, teachers can recall or comprehend more specified distribution of concepts weights when they catch from a knowledge map than when they stand on from textbooks and those teachers with new in-service often benefit the most. This study integrates knowledge maps into educational assessment systems. It builds a novel educational assessment system, called the Knowledge Map Assisted Assessment System (the KMAAS), which automatically constructs real-time updated knowledge maps with weight appraisal of concepts for creating effective assessments. The KMAAS harness a number of technologies like course concept extraction, knowledge maps, natural language processing, items categorization, and items retrieval. This study extracts important “keywords” from textbooks, teaching materials, and test items and uses them as the “nodes” to represent learning concepts in knowledge maps. The “concept weights” are a set of importance values weighted within the curriculum. The terms which directly indicate course topics are considered to play a more important role in assessments (Song, Wenyin, Gu, Quan, & Hao, 2010) and are given a higher weight. When compiling an assessment, teachers always intend to include important course concepts in the assessing and to maintain correct balance between course concepts among test items. Using most of the assessment authoring tools to date or pencils and papers, however, problems could occur, such as neglecting key concepts in the curriculum or having disproportionate course topics distribution, when teachers create assessments or test items. The KMAAS can ensure that these mistakes do not happen. Teachers can first use KMAAS to analyze course materials of the assessment range and display a concept-weight-annotated knowledge map which concretizes and visualizes importance of course concepts and the relationships among these concepts in the range. They then select test items from item banks or create they own test items in a test sheet. In the mean time, KMAAS analyzes the sheet being complied and displays another similar real-time updated knowledge map to show the balance among course concepts in the test items. Teachers can crossrefer to these maps to help them adjust concept balances and select or create appropriate test items. In KKMAS, teachers can analyze and organize their collection of test items and assemble test items they want to use by comparing the weight appraisal of course concepts and their relationships on the knowledge maps. Moreover, they can generate exercises, assessments and tests, and then use the system to help adjust the balance of test items to match the course concept weights. Although KMAAS was experimented in this study using a science course subject with its related items or assessments, it is not necessarily that KMAAS is confined to such a limited domain. The methodology and technologies KMAAS employed are all well developed and all domain independent. To transfer KMAAS to other subject course material, test items, and test sheets, would require no further labor work than download/upload and creating files.. 2. RELATED WORKS Course concepts, assessment items, and knowledge maps play an important role in this study. Researchers argue that the notion of concept can be thought of as an atomic unit of knowledge (Chang, Chiu, Lin, & Heh, 2003). Integrated knowledge is created by forming connections among concepts (Hsu, Kuo, Chang, & Heh, 2002). Instruction in schools is intended to teach concepts (Novak, 1979). Each course unit is made up of a certain number of concepts, and each concept has its own size and its own special importance in the course material. In 2006, Agarwal, Edwards, & Perez-Quinone proposed that when selecting test items, some general principles should be followed. Each item should relate to a specific course concept so that a correct answer implies knowledge of that concept. Also, test items should cater to varied knowledge levels. A number of studies have been conducted related to course concepts and assessment questions. For example, Smith, Wood, & Knight, (2008) designed an assessment tool recently to assess central course concepts in genetics and diagnose misconceptions or preconceptions. The created assessments were taken by more than 600 students at three institutions. This tool can be used by genetics instructors to measure students’ learning gains as well as to identify strengths and weaknesses in teaching approaches for specific concepts. Huang and.
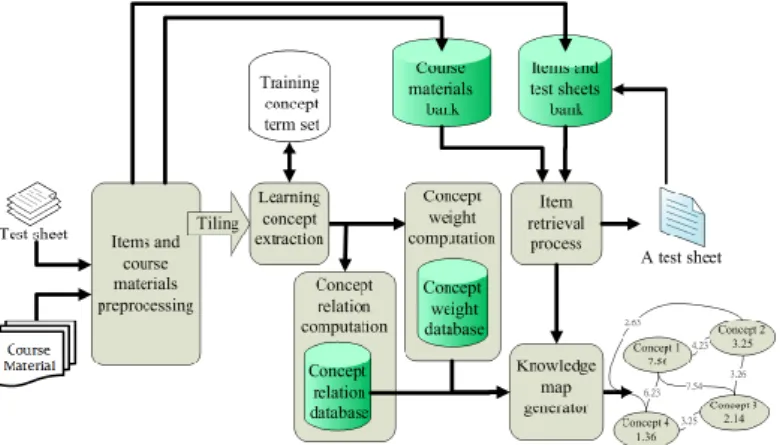
(3) colleagues (2008) proposed to incorporate the intelligent diagnosis and assessment tool into an open software e-learning platform developed for programming language courses. Their study applies the corresponding relation of the concepts and questions to explore the degree of student familiarization with the concepts, according to student's assessment records and their experiments were conducted in two introductoryundergraduate programming courses to examine the effectiveness of the proposed diagnosis and assessment tools. Also, Hwang, Tseng, and Hwang (2008) proposes a novel approach for constructing concept-effect relationships, diagnosing learning problems, and providing personalized learning suggestions for Science and Mathematics courses, based on students’ current test and historical assessment records. It has been shown that a clear and strong relationship exists between course concepts and test items. Thus, by determining concept weights for course materials and understanding the relationship between these course concepts and test items in advance can provide important information for supporting teachers when they construct educational assessments. It can also help teachers to know which concepts need further focus or remedial instruction. Knowledge-representation methodologies have been devised to date for knowledge-based applications. These techniques provide a bridge between human knowledge and machine knowledge (Kim, Suh, & Hwang, 2003). The term graphic knowledge organizer, or knowledge representation tool, is commonly used to describe two-dimensional visual knowledge representations, which show relationships among concepts or processes by means of spatial positions, connecting lines, and intersecting figures (Ives & Hoy, 2003). Knowledge mapping is a method for representing knowledge, which expresses the knowledge structure of a particular theme in the form of a visualization or figure. It can also serve as a common framework or context for the purposes of knowledge sharing, decision-making and problem-solving (Rouse, Thomas, & Boff, 1998). Speel et al. (1999) define knowledge mapping as the process, methods and tools for analyzing knowledge areas in order to discover features or meaning and to visualize these in a comprehensive, transparent form, such that the complexes or implied-relevant features are clearly highlighted. Knowledge maps are created by transferring certain aspects of knowledge into a graphical format that is easy to understand. Prusak and Davenport (1998) note that developing a knowledge map involves locating important knowledge in the domain and then publishing some sort of list or picture that shows where to find it. Knowledge maps serve as scaffolds or supports to cognitive processing because they can reduce cognitive load, enhance representation of relationships among complex constructs, provide multiple retrieval paths for accessing knowledge and serve as important props for communicating shared knowledge.. 3. KMAAS SYSTEM ARCHITECTURE AND OPERATIONS This study proposes a novel approach, which uses knowledge map with appraisal of concept weights and other ICTs, and implements an assessment system KMAAS to help primary school teachers in Taiwan, or elsewhere, create educational assessments properly. Besides knowledge maps, KMAAS combines natural language processing and machine learning technologies for concept knowledge extraction and test item classification.. 3.1. System architecture The architecture of KMAAS is depicted in Fig. 1, which has six major functional modules, including the item and course material preprocessing, the concept extraction, the concept relation computation, the concept weights computation, the item retrieval processing, and the knowledge map generation modules. The details of each module are described as follows. (1) Item and course material preprocessing module: This module is responsible for performing sentence segmentation and determining morphological features of test items and course materials. In general, specific text preprocessing is required before automated concept extraction and item categorization can be performed. Chinese sentences are characterized by the absence of delimiters to mark word boundaries like those found in English sentences. Chinese sentence segmentation is thus essential for most language processing systems that utilize techniques originally developed for the English language (Wang, Chang, & Li, 2008). This study harnesses natural language processing technology to perform.
(4) (2). sentence segmentation and text tagging, which automatically locates various Chinese keywords in sentences of test items or course materials and tags them with appropriate morphological feature tags; the module selects among them important concept terms and filters out superfluous keywords so that key concept candidate terms can be identified and sent to the next module. Learning concept extraction module: This module allows teachers to browse and select course concept vocabularies from the concepts repository produced in the preprocessing stage. Teachers can add or modify concept vocabulary, producing a list of important keywords that are then defined as the vocabularies of the course learning concepts. The module uses one of the training datasets to construct a concept extraction model, which is then employed to extract concept vocabularies accurately from test items and course materials.. Figure 1. System architecture.. (3). (4). Concept relation computation module: This module calculates the relationship strength between the concepts extracted from test items and course materials, so that teachers can clearly see the distribution of concepts and the interdependent among these concepts. Formula (1) refers to TF-IDF and calculates the relation between two concepts. (1) where RS (Concept1, Concept2) is the degree of correlation between concept 1 and concept 2. The Frequency is the number of times that concept 1 and concept 2 appeared in the same sentence in the course materials. The Distance between two concepts is measured by the distance between their representing keywords as they appear in the same sentence and AVG (Distance) is the average distance between two keywords, i.e. summation of the distances divided by the number of times the two keywords appear in the same sentence (Johnson & Wichern, 2002). The higher the RS value is, the stronger the relationship is. A concept relation database is managed by this module. Concept weight computation module: This module computes the weight of each concept in the concept repository to represent their relative importance in the course material. An algorithm called RSISF (Relation Strength Inverse Sentence Frequency) is proposed for the concept weight conversion. In short, it converses the summation of the relationship strengths a concept has to other concepts into the weight of the concept. Formula (2) realizes RSISF and works as follows. (2) . RS: the relationship strength between two concepts stored in the concept relation database, as calculated by Formula (1). N: the total number of sentences in the course materials. n: the total number of sentences in which the concept appears together with others in the course materials. The higher the concept weight is, the more important the learning concept is in the course material. The results of the computations are stored in a concept weight database. In KMAAS, teachers can manually select different versions of course materials on a same topic and combine them for computations to increase the precision of concept weights..
(5) (5). (6). Item retrieval process module: This module helps teachers with the selection of appropriate test items from the item bank and assists them in compiling a test sheet. All collected items follow the concept classification and are stored in the item bank. The weights and relationships of the concepts in the specified course range for assessment are displayed in their strength order for teachers’ reference. When a teacher chooses a concept, the associated test items are retrieved and displayed in the order of their importance, which is based on the criteria such as the number of course concepts an item has, concept strength summation the item has, and how many times this test item has been used. Knowledge map generation module: This module generates graphical knowledge maps that display relationships and concept nodes using Graphviz technology (Low, 2004). Concepts identified by the learning concept extraction module from the course materials of the specified assessment range are used to generate an annotated knowledge map, with concept weights and link strengths both coming from the concept relation database and the concept weight database. The map concretizes and visualizes the importance of these concepts and their relationships’ strengths. This module also analyzes the test sheet currently complied by a teacher with test items selected from the item bank or created on site, and displays another similar real-time updated knowledge map to show the balance among course concepts in the test items. This map depicts the overall structure of all the relevant concepts in the test sheet to assist the teacher in developing a comprehensive understanding of the concepts’ distribution among test items and in making decisions about item selections and creations.. 3.2. System Operations The operational KMAAS can help teachers select test items that effectively assess teaching objectives of a course and avoid inappropriate distribution of test items and concepts. Cross-referring the real-time generated knowledge maps, teachers can analyze and adjust, according to the course concept weights and relation strengths, the configuration proportion of test items in a test sheet. KMAAS was evaluated using the fifth- and sixth-grade "natural science and life technology" curriculum materials in Taiwan and the item bank is initially fed with over 830 related test items. Teachers perform operations using five major interfaces as shown in Figure 2, including item input, course materials input, data review, item selection guide, and relevant records interfaces. Teachers may upload a test sheet with the test items put into the item bank and, in the mean time, receive a concepts distribution analysis knowledge map. Alternatively, teachers could create a new test sheet, using any test items from the item bank, which are in accordance with their testing need and teaching objectives. Either way, a real-time updated knowledge map will always be display for their reference. Figure 2 shows the item input interface. In this interface, teachers could add, delete and review electronic test sheets and upload test items in them to the item bank. Teachers hit the "Add a new test sheet" button to add a new text-based test sheet file, fill in the relevant information about the test sheet, and save the file. The system then conduct an analysis on the sheet by, such as CKIP processing, morphological features checking, and automatic concept classifying, on the test item sentences. A knowledge map is displayed afterwards showing the result of the analysis. An example is shown as in the lower right corner of Figure 1. Through the course materials input interface, teachers add course curriculum materials into KMAAS to facilitate concept extraction from these course materials. The system uses CKIP technique to mark the morphological features of the course materials, removes redundant contents, and extracts candidate concepts from these materials. The data review interface can then be used to help improve the accuracy of automatic concept extractions. Although the system could extract concept vocabularies fully automatically, teachers might want to see how effective the system is in extracting appropriate concept vocabularies from textbooks or from any course materials. When inappropriate concept vocabularies do appear, teachers can manually filter out irrelevant or superfluous ones. This practice ensures the extracted concept keywords are more accurate with each use of the system later. The result is then put into the concept extraction training model for further processing. Through item selection guide interface, teachers choose one or more electronic test sheets for final analysis. Teachers could choose students’ grade level and then select desired electronic test items with their assessment aims in mind. They can use this interface to see the overview of concept weights and concept relationships for an archived or just compiled test sheet by generating a corresponding knowledge map. The ranking of concept weights and their relationships corresponds to their importance in the course material..
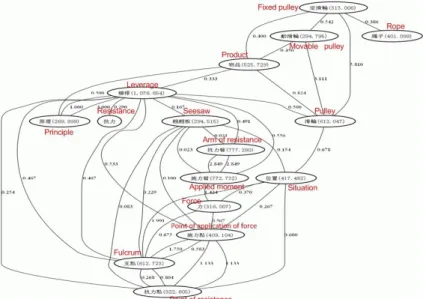
(6) Figure 2. The items input interface.. Figure 3 shows the appraisal of concept weights and their relationships of a knowledge map example on a primary school course on levers. It is created from the combination of three related test sheets after the systematic analysis and shows the whole picture of the core concepts distributions, with regard to the concept trends in terms of distributive test items about the specific subject domain “levers”.. Figure 3. The knowledge map of a course content on the topic of lever.. When teachers click on a concept in the concept list column of the item selection guide interface, all the test items related to this concept would be displayed in the order of their importance, which is based on the criteria such as the number of course concepts an test item has, the concept strength summation the test item has, and how many times this test item has been used before. Teachers could select test items from this list in accordance with their assessment objectives and export them into a test sheet text file, which consists of the selected items and the proportion of each concept. They could convert the file into an assessment portfolio and save it in the test sheet bank for sharing with other teachers too.. 4. EVALUATION The evaluations conducted are to investigate, in addition to its usability and appealing, how to improve KMAAS in order to make assessment compilations more effective and more efficient. The method of.
(7) formative evaluation is successful in that it has resulted in an improved quality of the system. The method, typically involving a small group of users or participants in the project, has been extremely useful in producing modules which are suitable for their target audience, are easy to use, and are instructive. It is also relatively easy for developers to modify the modules according to the recommendations of the evaluators (Phelps & Reynolds, 1999). Using such a method, six elementary school teachers who actually teach a physics course on “levers and forces” in Taiwan were invited to use and evaluate KMAAS. System performance was evaluated in terms of user satisfaction and extraction accuracy. The teachers reported on the usefulness and usability of the system in a Technology Acceptance Model (TAM) questionnaire by providing written feedbacks about their satisfaction in using the system. These evaluations are discussed in the follows. For the extraction accuracy evaluation, standard performance measures, precision and recall, were examined by comparing the concepts and their rankings as extracted and obtained by the system to those obtained by participating teachers, with special focus on whether the concept importance ranking provided by the system are similar to that of by the teachers. The precision and recall measures are defined as shown in Formula (3). Precision (p) = ; (3) Recall (r) = ; where A are the concepts selected by teacher experts, C are the concepts selected by KMAAS, and B is the intersection of A and B. Fifteen most important concepts of the “levers and forces” course automatically extracted by the system were compared to the 15-20 concepts considered important by teachers. Eleven concepts were common to both lists, and each concept in the list generated by KMAAS was picked an average of 4.27 times from a total of 6 teacher lists. The average precision is 0.733, with the highest being 0.865 and the lowest being 0.61. This result demonstrates that the comparison between automatic system extraction and teachers selection reaches up to 73% consistency. The first of the evaluations of this study is set to examine teachers’ satisfaction with the KMAAS. The Technology Acceptance Model (TAM) is a widely-used robust framework for surveying users’ satisfaction (King & He, 2006; Venkatesh & Davis, 2000). The questionnaire used in this study is based on the TAM model and responses are collected using five-point Likert scales. Six teachers were invited to complete a questionnaire eliciting information concerning attitudes and responses. The findings show the mean score for most of the items is greater than 4, except for two items. Four of the teachers mentioned the disfluency of the interfaces, but suggested that their problems could be overcome by reading the manual or using the system more frequently. The results are overall very positive. In the evaluations, in general, all teachers felt that the system, which provided them with knowledge maps and weight appraisal of concepts, is very novel; they reported favorably on the value of the system for assisting with their assessment works. The knowledge maps, by aggregating the concepts and presenting the whole assessment structure, enable teachers to make inferences and to reflect on test items and allowing them to make good decision on item selection.. 5. CONCLUSION This study proposes a novel methodology that harnesses knowledge maps with weight appraisal of concepts and concept relationships and builds an assessment system for assisting primary school teachers in creating assessments. KMAAS enables teachers to analyze and reorganize their collection of test sheets and test items, and provides conceptually-organized methods for retrieving test items. It does so by performing learning concept extractions and automatic classifications on each collected test item to establish the associations between concepts and test items. When compiling a test sheet, teachers may refer to an automaticallyconstructed knowledge map presenting the importance of course concepts and interrelationship among course concepts and test items. This map helps teachers to understand and evaluate test item distributions according to the weight appraisal of concepts. It also serves as a useful blueprint for assisting teachers as they design various assessment projects. Moreover, teachers can use KMAAS to create and manage their own assessment e-portfolios and to share them with each other via the network. For the evaluation of KMAAS, evaluation have been carried out in terms of the accuracy of learning concepts extraction by KMAAS and user satisfaction, measured by a questionnaire given to teachers who tested the system. The results promise that KMAAS has a high potential and high practical value for succeeding in ICT-based educational assessment domain, and can definitely help teacher with their assessment creation works..
(8) Although KMAAS was proved successfully in a science course subject with its related items or assessments, it is not necessarily that KMAAS is confined to such a limited domain. The methodology and technologies KMAAS employed are all well developed and indeed perform automatically with very few human intervention. For other subject course material, test items, and test sheets, using KMAAS would require no further labor work than download/upload and creating files.. REFERENCES Agarwal, R., Edwards, S., & Perez-Quinones, M. (2006). Designing an adaptive learning module to teach software testing. Paper presented at the SIGCSE'06, Houston, Texas, USA. Bonham, S., Beichner, R., Titus, A., & Martin, L. (2000). Education research using web-based assessment systems. Journal of Research on Computing in Education, 33(1), 28-45. Chamoso, J. M., & Ca´ceres, M. J. (2009). Analysis of the reflections of student-teachers of mathematics when working with learning portfolios in Spanish university classrooms. Teaching and Teacher Education, 25(1), 198-206. Chou, S., & Liu, C. (2005). Learning effectiveness in a Web-based virtual learning environment: a learner control perspective. Journal of Computer Assisted Learning, 21(1), 65-76. Conca, L., Schechter, C., & Castle, S. (2004). Challenges teachers face as they work to connect assessment and instruction. Teachers and Teaching, 10(1), 59-75. Edwards, D., & Hardman, L. (1999). mapping and navigation in a hypertext environment. Hypertext: Theory into practice, 90. Goodison, T. (2002). Learning with ICT at primary level: pupils' perceptions. Journal of Computer Assisted Learning, 18(3), 282-295. He, Q., & Tymms, P. (2005). A computer-assisted test design and diagnosis system for use by classroom teachers. Journal of Computer Assisted Learning, 21(6), 419-429. Hsu, C., Kuo, R., Chang, M., & Heh, J. (2002). Implementing a Problem Solving System for Physics based on Knowledge Map and Four Steps Problem Solving Strategies. Paper presented at the IEEE 2nd International Conference on Advanced Learning Technologies, Kazan, Russia. Huang, C.-J., Chen, C.-H., Luo, Y.-C., Chen, H.-X., & Chuang, Y.-T. (2008). Developing an Intelligent Diagnosis and Assessment E-learning Tool for Introductory Programming. Educational Technology & Society, 11(4), 139-157. Innovations in Education and Teaching International, 45(1), 77-89. Hwang, G. J., Chu, H. C., Yin, P. Y., & Lin, J. Y. (2008). An innovative parallel test sheet composition approach to meet multiple assessment criteria for national tests. Computers & Education, 51(3), 1058-1072. Ives, B., & Hoy, C. (2003). Graphic organizers applied to higher-level secondary mathematics. Learning Disabilities Research & Practice, 18(1), 36-51. Johnson, R., & Wichern, D. (2002). Applied multivariate statistical analysis (5 ed.). New York: Prentice Hall. Kim, S., Suh, E., & Hwang, H. (2003). Building the knowledge map: an industrial case study. journal of knowledge management, 7(2), 34-45. King, W., & He, J. (2006). A meta-analysis of the technology acceptance model. Information & Management, 43(6), 740755. Low, G. (2004). Graphviz-Graph Visualization Software. Retrieved 10.12, 2008, http://www.graphviz.org/About.php Novak, J. D., & Gowin, D. B. (1984). Learning how to learn. Cambridge Univ Press. Smith, M., Wood, W., & Knight, J. (2008). The genetics concept assessment: a new concept inventory for gauging student understanding of genetics. CBE-Life Sciences Education, 7(4), 422-430. Song, W., Wenyin, L., Gu, N., Quan, X., & Hao, T. (2010). Automatic categorization of questions for user-interactive question answering. Information Processing & Management. Article in press. Speel, P., Shadbolt, N., Vries, W., Dam, P., & O'hara, K. (1999). Knowledge mapping for industrial purposes. Paper presented at the 12th Workshop on Knowledge Acquisition, Modeling and Management, Alberta, Canada. Wang, H.-C., Chang, C.-Y., & Li, T.-Y. (2008). Assessing creative problem-solving with automated text grading. Computers & Education 51(4), 1450-1466. Yin, P., Chang, K., Hwang, G., Hwang, G., & Chan, Y. (2006). A particle swarm optimization approach to composing serial test sheets for multiple assessment criteria. Educational Technology and Society, 9(3), 3-15. Zumbach, J. (2009). The role of graphical and text based argumentation tools in hypermedia learning. Computers in Human Behavior, 25(4), 811-817..
(9)
數據
相關文件
Through study in various knowledge contexts and through engaging in a range of learning activities, students will acquire technological concepts and knowledge and develop
Strands (or learning dimensions) are categories of mathematical knowledge and concepts for organizing the curriculum. Their main function is to organize mathematical
stating clearly the important learning concepts to strengthen the coverage of knowledge, so as to build a solid knowledge base for students; reorganising and
DVDs, Podcasts, language teaching software, video games, and even foreign- language music and music videos can provide positive and fun associations with the language for
To explore different e-learning resources and strategies that can be used to successfully develop the language skills of students with special educational needs in the
Explore different e-learning resources and strategies that can be used to successfully develop the language skills of students with special educational needs in the..
This option is designed to provide students an understanding of the basic concepts network services and client-server communications, and the knowledge and skills
Microphone and 600 ohm line conduits shall be mechanically and electrically connected to receptacle boxes and electrically grounded to the audio system ground point.. Lines in
